In-Game Benchmarks
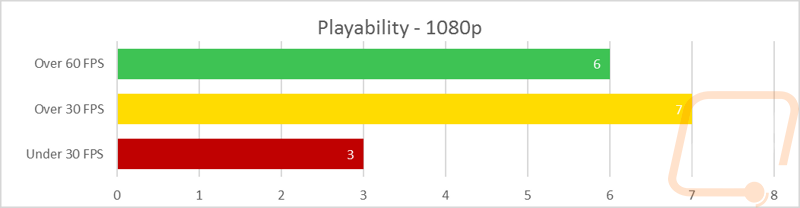
Now that we have an idea of how the cards stand compared to each other, it’s finally time to get down to the in-game performance numbers. To do that I ran through our entire in-game benchmark test suite. The suite has 13 different games tested at both 1080p and 1440p at their highest settings. Four of the games are also tested in more than one configuration to see the difference between DX11 and DX12 performance or in the case of the most recent addition, DOOM I test out both OpenGL and Vulkan performance. The problem is, with so many results it can be a little too much to take in. To help with that I have condensed our results into two graphs, one for 1080p and the other for 1440p. All of our games are run at their max settings and we use the average FPS as the end result. The graphs below are broken down into three FPS ranges to represent unplayable (below 30), playable but not ideal (30 to 60), and ideal (over 60 FPS). So what did I find from those results?
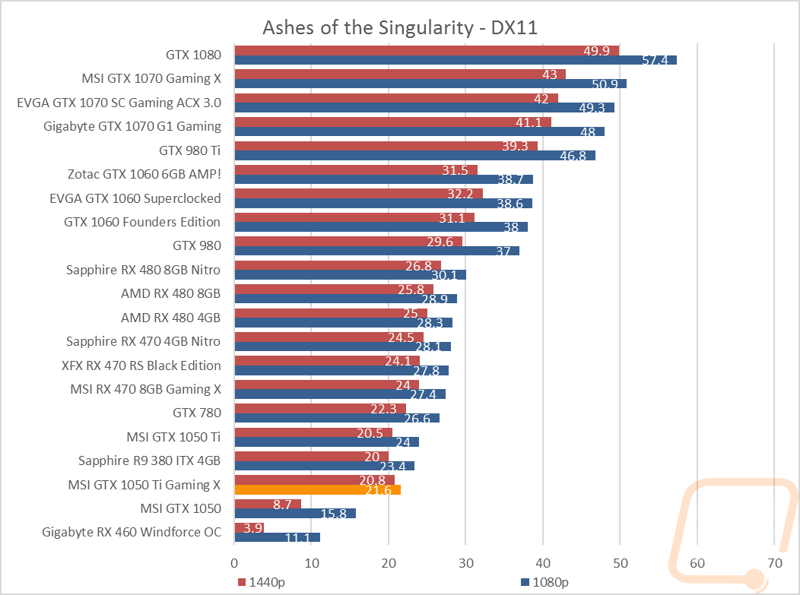
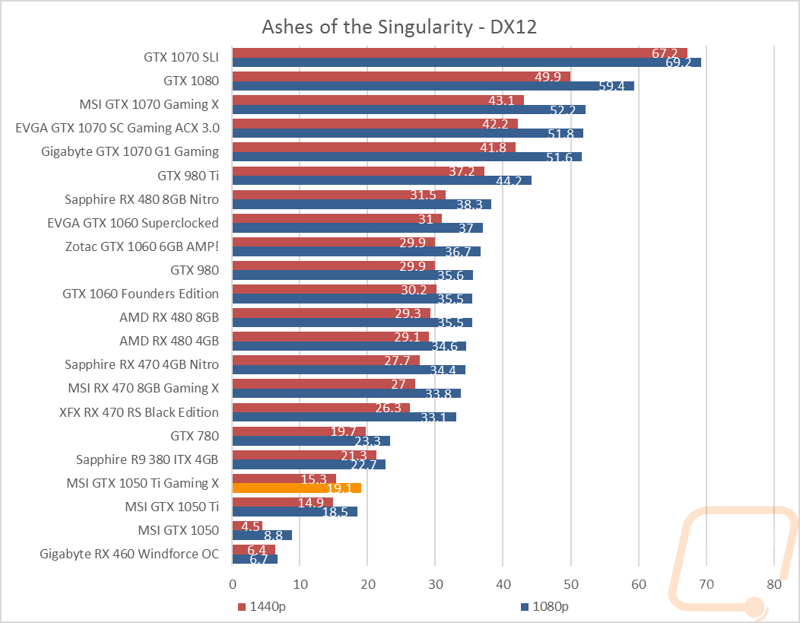
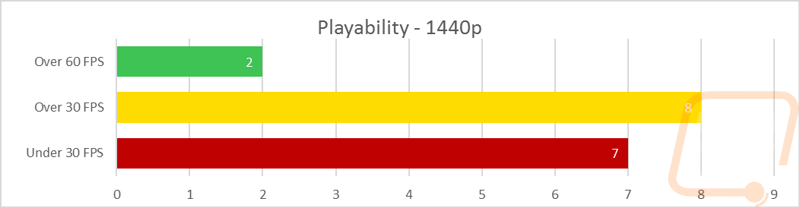
Well, if we just take into account the range charts below, the GTX 1050 Ti Gaming X doesn’t really show any change from MSI’s other Overclocked GTX 1050 Ti, we get the same results at both resolutions. At 1080p almost everything is in the yellow playable or in the green ideal range with just ultra demanding games like Ashes of the Singularity struggling and that game struggles with just about every single card solution. Even at 1440p, a resolution that the GTX 1050 Ti isn’t designed for we do still end up with 10 results being playable and 7 not playable. Both results are actually really impressive when we keep in mind that the GTX 1050 Ti is designed for 60 FPS in the less demanding e-sports friendly games like Overwatch , Dota 2, and League of Legends. The games I test with are cranked up to their highest settings and are much more demanding.
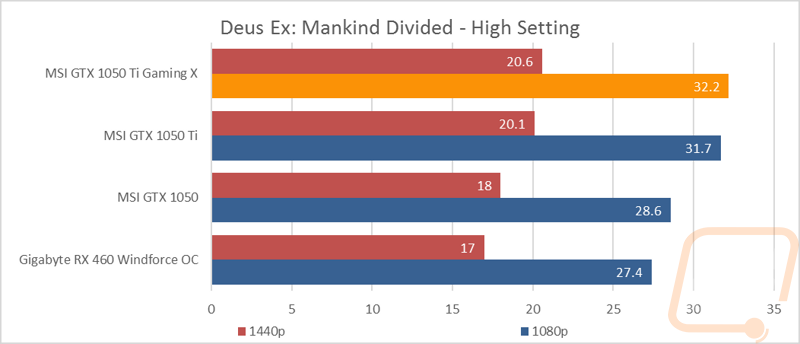
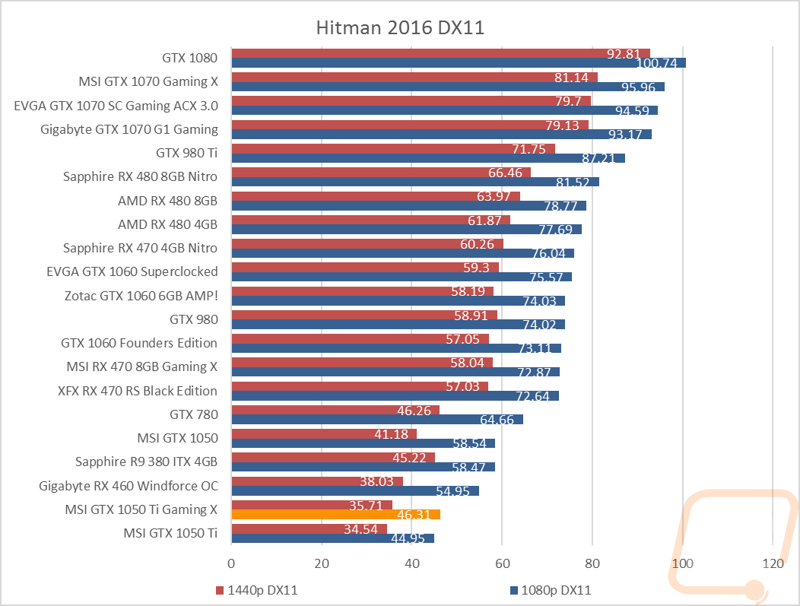
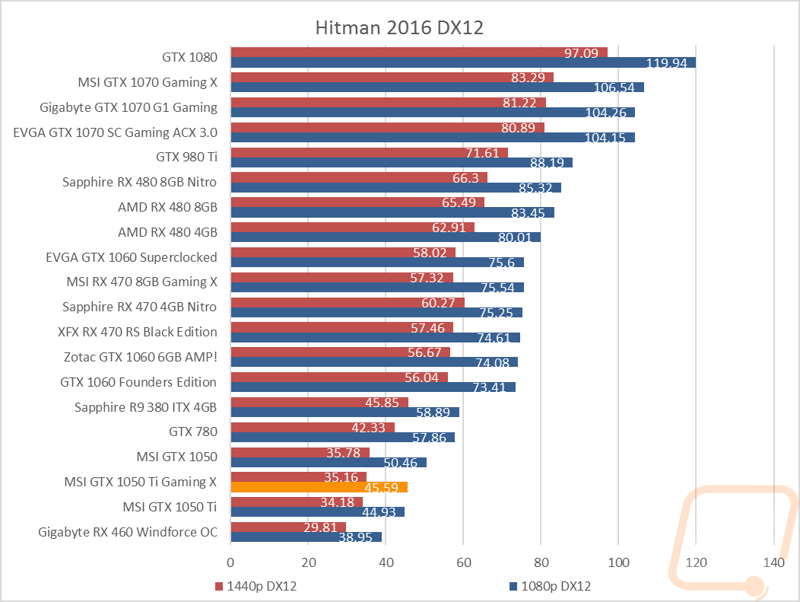
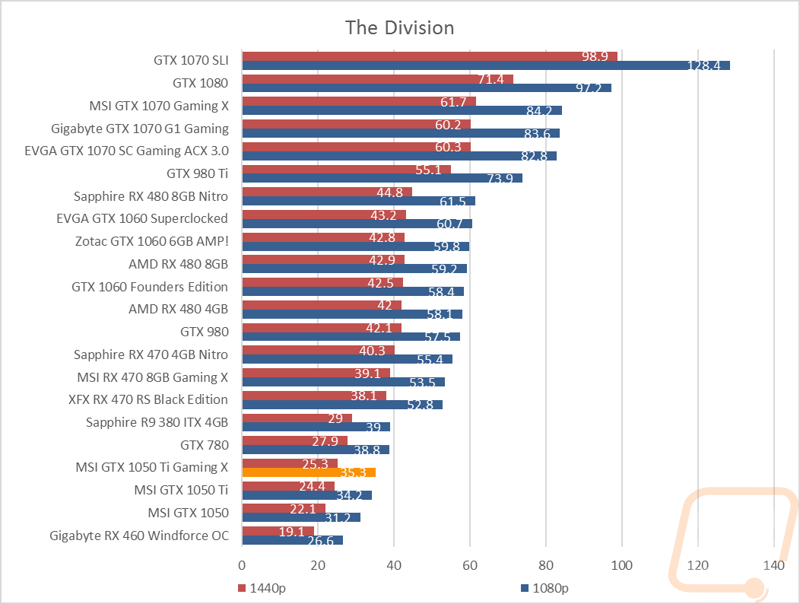
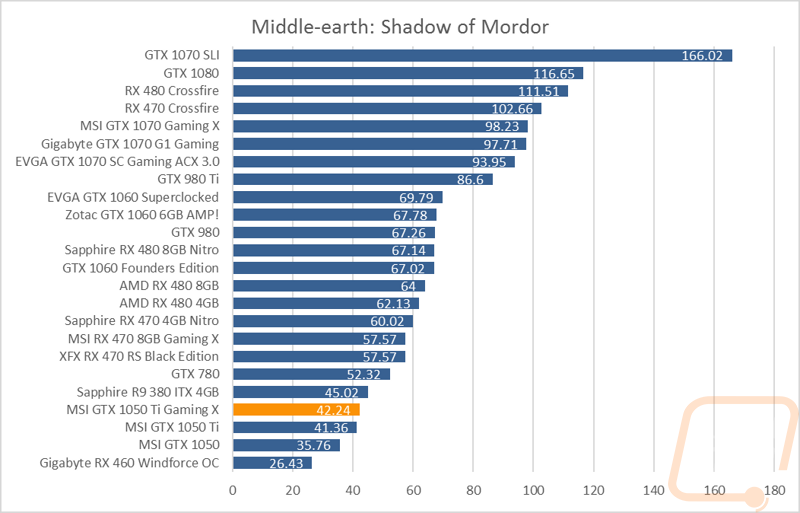
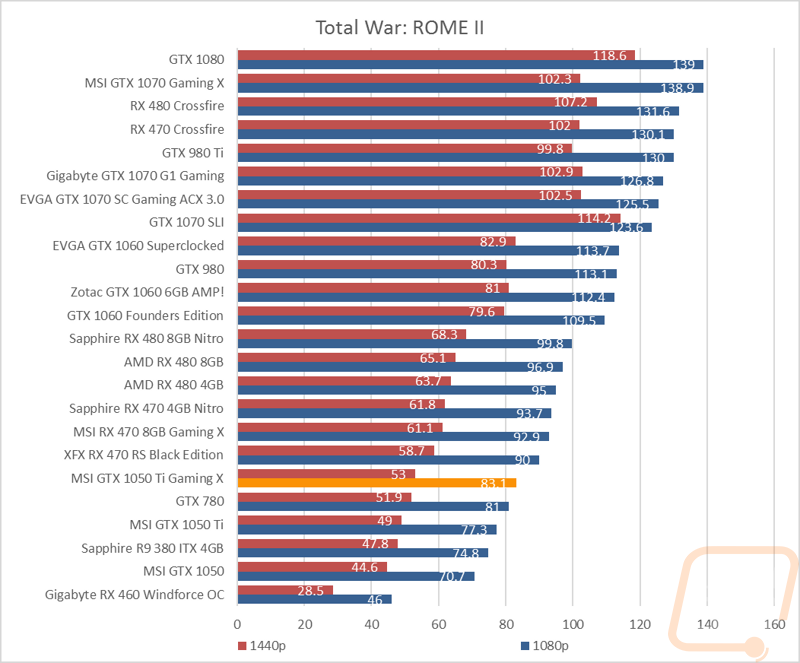
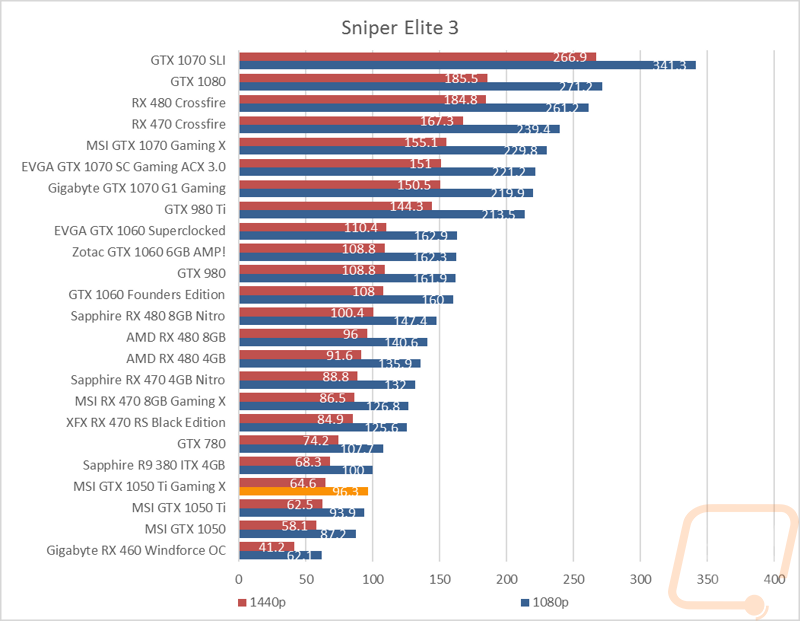
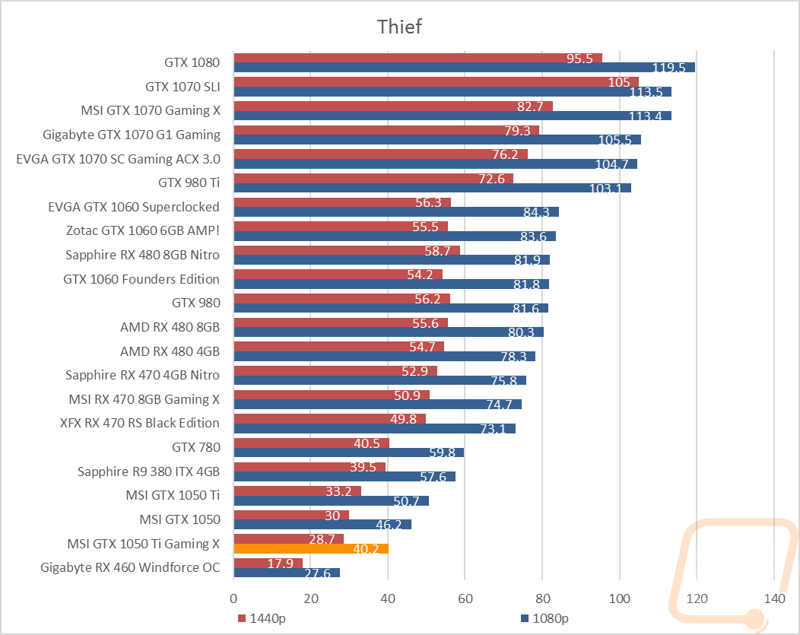
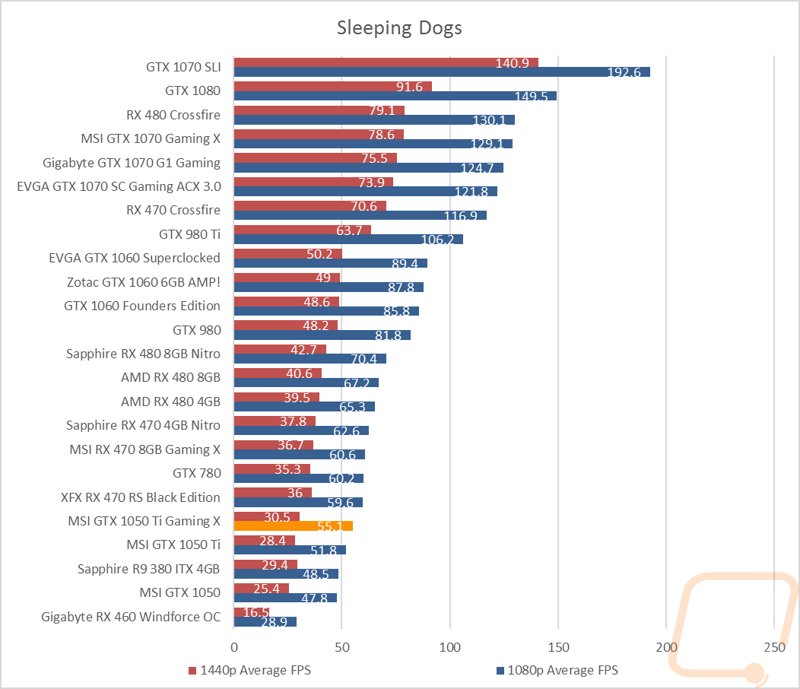
As always I did also include all of the actual results below as well for all of you who are crazy enough (like me) to dig through them all. So what did I find? Well for starters, I did want to point out that unlike what the FPS range graphs might make you think, there is a difference between the slightly overclocked MSI 1050 Ti and the overclocked 1050 Ti Gaming X that I am testing today. Overall the extra overclock gets you 1 FPS average well .8606 officially. That does, however, include a couple results that did stand out, specifically in Thief the Gaming X came in below the GTX 1050 and GTX 1050 Ti. Like I mentioned earlier, in game results aren’t perfectly consistent. Beyond that the Gaming X did stay above the other 1050 Ti as well as the RX 460. The RX 470, on the other hand, was consistently faster as well, by a fairly big margin.