
Returning readers will know that seeing two similar cards pop up means just one thing… Crossfire benchmarking! After I finished up my review of the Sapphire RX 470, I stayed up all night benchmarking the two cards together. I wanted to take a look and find out if picking up two RX 470’s would be better than a single GTX 1070, something that falls into the same price range. In addition, I was curious if we would just see an improvement in the 1080p resolution that these cards were designed for or if maybe they would be more viable for 1440p as well when paired up. As always with our SLI and Crossfire testing. I skip all of the normal review stuff and frankly don’t write to much, leaving you guys with a whole pile of graphs and performance numbers to sort through. So enjoy!
Product Names: Sapphire RX 470 4GB Nitro and XFX RX 470 RS Black Edition
Review Samples Provided by: Sapphire and XFX
Written by: Wes
Testing by: Wes
Amazon Links: Sapphire RX 470 4GB Nitro and XFX RX 470 RS Black Edition
Links to our original reviews
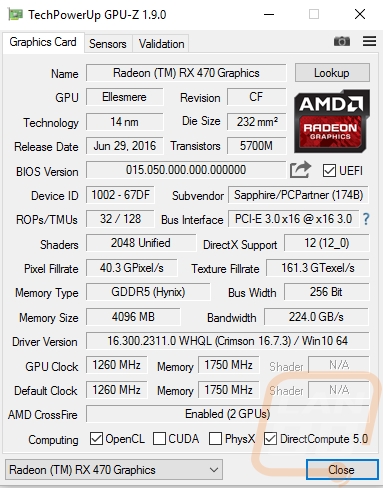
| Sapphire RX 470 4GB Nitro Specifications | |
| GCN Architecture | 4th Generation |
| Manufacturing Process | 14-nm FinFET |
| Die Size | 232 mm2 |
| Transistors | 5.7B |
| Compute Units | 32 |
| Stream Processors | 2048 |
| Clock Speeds (Boost / Base) | 1260 MHz / 1143 MHz |
| Peak Compute Performance | Up to 4.9 TFLOPS |
| Texture Units | 128 |
| Peak Texture Fill-Rate | Up to 154.4 GT/s |
| ROPs | 32 |
| Peak Pixel Fill-Rate | Up to 38.6 GP/s |
| Memory Size | 4 GB |
| Memory Bandwidth | 211 GB/s |
| Memory Interface | 256 bit |
| Memory Type | GDDR5 |
| Board Power | 120W |
| AMD FreeSync™ Technology | Yes |
| DirectX® 12 Suppor | Yes |
| Vulkan™ Support | Yes |
| VR Premium | Yes |
| DisplayPort Version | 1.3 HBR / 1.4 HDR Ready |
| XFX RX 470 RS Black Edition Specifications | |
| Model Number | RX-470P4LDB6 |
| Card Dimension | cm 24 x 12.1 x 4 Inches 9.45 x 4.76 x 1.57 |
| GPU Clock | 1256MHz |
| Stream Processors | 2048 |
| Memory Bus | 256 bit |
| Memory Clock | 7.0 GHz |
| Memory Size | 4GB |
| Memory Type | DDR5 |
| Dual link Support | Yes |
| Max Supported Resolution (DIGITAL) | 4096 x 2160 |
| Display Outputs | 3x DisplayPort 1x HDMI 1x DL-DVI-D |
| Display Port ready | 1.4 |
| HDMI Ready | 2.0b |
| HDR Ready | Yes |
| FinFET 14 | Yes |
| AMD FreeSync technology | Yes |
| DirectX™ 12 Optimized | Yes |
| 4th Generation GCN | Yes |
| AMD LiquidVR technology | Yes |
| AMD Virtual Super Resolution (VSR) | Yes |
| Radeon Software | Yes |
| AMD CrossFire Technology | Yes |
| Package Contents |
6-pin to 4-pin power cable Driver Disk Installation Guide Installation DVD Warranty Card |
| Warranty | 3 Years |
Our Test Rig and Procedures
| Our Test Rig | ||
| CPU | Intel i7-5960X | Live Pricing |
| Memory | Kingston HyperX FURY Black 32GB Quad Channel Kit 2666 MHz | Live Pricing |
| Motherboard | Gigabyte X99-SOC Champion | Live Pricing |
| Cooling | Noctua NH-U12S Cooler | Live Pricing |
| Power Supply | Cooler Master V1000 Power Supply | Live Pricing |
| Storage | Kingston Hyper X Savage 960GB SSD | Live Pricing |
| Case | Dimastech Test Bench | Live Pricing |
| Our Testing Procedures | |
| 3DMark | The same goes for the most current version of 3DMark using the Fire Strike benchmark in normal, extreme, and ultra settings |
| Unigine Valley Benchmark 1.0 | Using the Extreme HD preset to get an average FPS |
| Catzilla 4k | Default tests for 1080p, 1440p, and 4k resolutions using the overall score for each as our result |
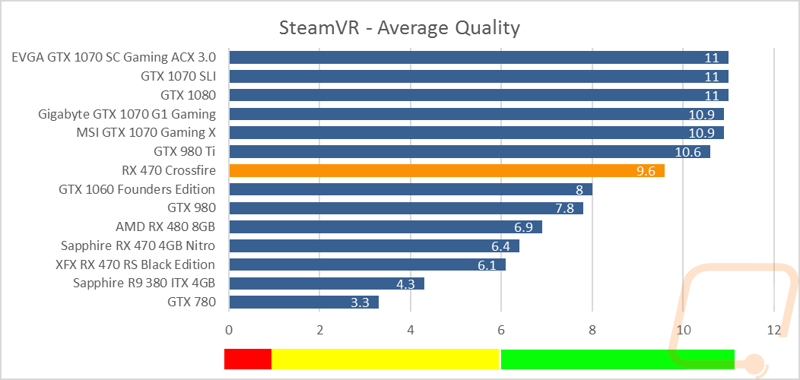
| SteamVR | Default SteamVR test using Average Quality score |
| HITMAN 2016 | Fullscreen with V-Sync turned off Detail, Texture Quality, Shadow Maps, and Shadow Resolution all set to their highest settings. We test using both DX11 and DX12 at both 1080p and 1440p resolutions. |
| Ashes of the Singularity | Built-in benchmark ran at 1080p and 1440p with graphics settings set to the “Crazy” setting with the exception of turning off V-Sync Mode. The benchmark scenario is set to GPU Focused and we use the Average Framerate for All Batches as the result. Tests are run both in DX11 and DX12 |
| The Division | Built-in benchmark ran at 1080p and 1440p with graphics settings set to the default “Ultra” setting with the exception of turning off V-Sync Mode |
| Bioshock Infinite | Using the Adrenaline Action Benchmark Tool we run Bioshock Infinite on the “Xtreme” quality setting. This has a resolution of 1920x1080, FXAA turned on, Ultra Texture detail, 16x Aniso Texture Filtering, Ultra Dynamic Shadows, Normal Postprocessing, Light Shafts on, Ambient Occlusion set to ultra, and the Level of Detail set to Ultra as well. We also run this same test at 2560x1440 using the same settings as mentioned above. |
| Tomb Raider | Using the Adrenaline Action Benchmark Tool we run Tomb Raider on the “Xtreme” quality setting. This has a resolution of 1920x1080, Exclusive Fullscreen turned on, Anti-Aliasing set to 2xSSAA, Texture Quality set to Ultra, Texture Aniso set to 16x Aniso, Hair Quality set to TressFX, Shadow set to Normal, Shadow Resolution on High, Ultra SSAO, Ultra Depth of Field, High Reflection quality, Ultra LOD scale, Post-Processing On, High Precision RT turned on, and Tessellation is also turned on. We also run this same test at 2560x1440 using the same settings as mentioned above. |
| Hitman: Absolution | Using the Adrenaline Action Benchmark Tool we run Hitman: Absolution on the “Xtreme” quality setting other than the MSAA setting is turned down from 8x to 2x. That setting puts the resolution at 1920x1080, MSAA is set to 2x, Texture Quality is set to High, Texture Aniso is set to 16x, Shadows are on Ultra, SSA is set to high, Global Illumination is turned on, Reflections are set to High, FXAA is on, Level of Detail is set to Ultra, Depth of Field is high, Tessellation is turned on, and Bloom is set to normal. We also run this same test at 2560x1440 using the same settings as mentioned above, except on the “high” setting. |
| Sleeping Dogs | Using the Adrenaline Action Benchmark Tool we run Sleeping Dogs on the “Xtreme” quality setting. That means our resolution is set to 1920x1080, Anti-Aliasing is set to Extreme, Texture Quality is set to High-Res, Shadow Quality is High, Shadow Filter is set to high, SSAO is set to High, Motion Blur Level is set to High, and World Density is set to Extreme. We also run this same test at 2560x1440 using the same settings as mentioned above. |
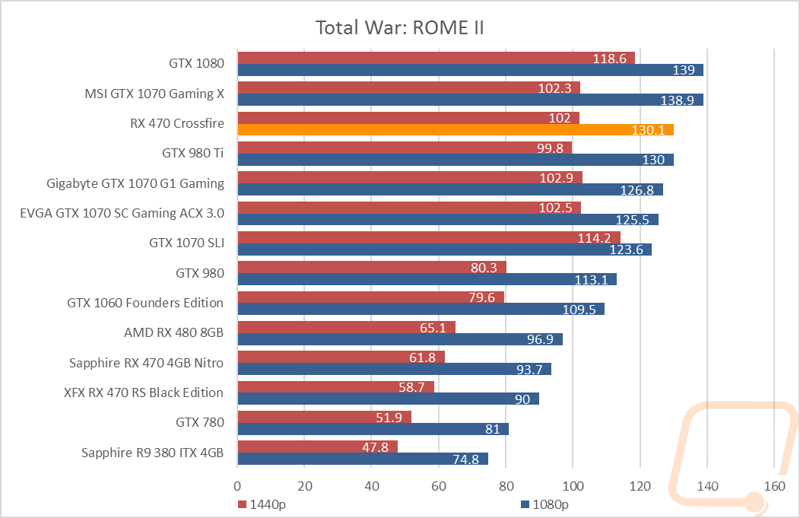
| Total War: ROME II | Ultra-setting tested at 1920x1080 and 2560x1440, built in forest benchmark |
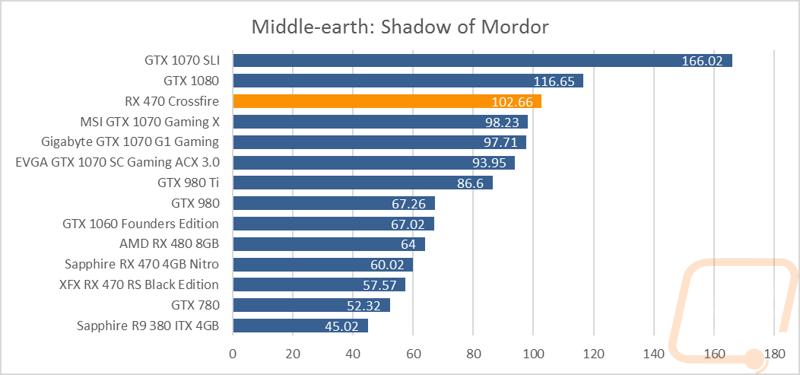
| Middle-earth: Shadow of Mordor | Using the built-in benchmark we test with ultra settings at 1440p |
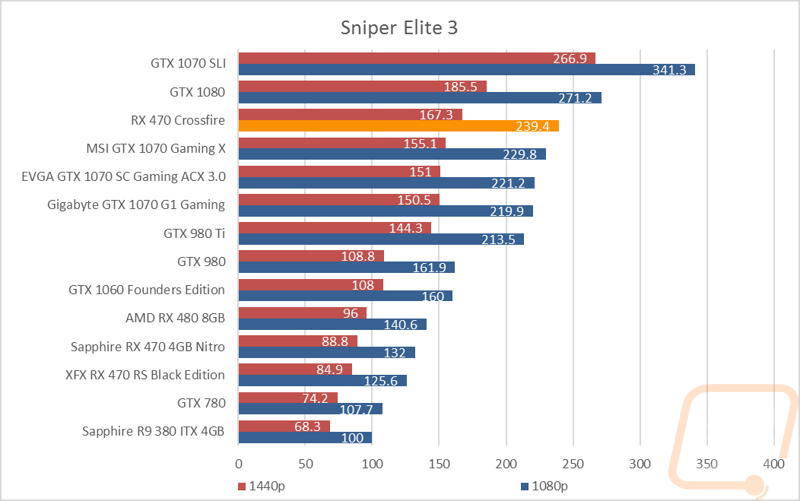
| Sniper Elite 3 | Ultra-setting tested at 1920x1080 and 2560x1440, built in benchmark |
| Thief | Tested using the “Very High” setting at 1920x1080 and 2560x1440 |
| Folding at Home 2.2 | Using the Folding at Home benchmark 2.2.5 set to OpenCL, WU set to dhfr, and run length set to the default 60 seconds. We test at both double and single precision and use the score at the result |
| CompuBenchCL | Video Composition and Bitcoin tests |
| Unigine Valley Benchmark 1.0 heat testing | We run through Unigine Valley using the “Extreme” preset for 30 minutes to test in game cooling performance with the fan speed set to auto then again with the fan set to 100%. |
| Power Usage | Using Unreal Valley Benchmark 1.0, we get our “load” power usage number from the peak power usage during our test. We get our numbers from a Kill-A-Watt connected to the test benches power cord. |
| Noise Testing | Our Noise testing is done using a decibel meter 3 inches away from the video card on the bottom/fan side of the card. We test an idle noise level and then to get an idea of how loud the card will get if it warms all the way up we also turn the fan speed up to 50% and 100% and test both speeds as well. The 100% test isn’t a representation of typical in-game noise levels, but it will show you how loud a card can be if you run it at its highest setting or if it gets very hot. |
Benchmarks
Like our previous coverage of two GTX 1070’s in SLI, I do want to point out that I only include graphs for benchmarks that show an actual performance increase when running in Crossfire. I do this because we use these same graphs for our single card reviews and I wouldn’t want anyone getting confused when they see an RX 460 outperforming two 470’s in Crossfire or similar. Here is the breakdown on what we normally test but I didn’t include in here. For starters, all of the Compute testing isn’t included because Crossfire isn’t the ideal configuration on those. Noise and cooling testing also don't apply here. For synthetic benchmarks, Catzilla was the only benchmark that had any trouble. It worked fine unlike my GTX 1070 SLI testing where it would just crash. But the results matched the single card results.
For games, the following games aren’t included Hitman 2016, Ashes of the Singularity, The Division, and Thief. Thief had no improvement but didn’t drop in performance. The Division saw a 7 FPS drop and in Hitman 2016 I saw a 10 FPS drop across the board. Then in Ashes of the Singularity I saw a 3 FPS drop in DX11 but in DX12 the game crashes when I try to load it with our crazy setting with multiple GPUs turned on. This is a known issue that is included in the most recently AMD Catalyst driver notes, so hopefully that issue will be fixed soon.
Anyhow on to the results!
Power Usage and Final Thoughts
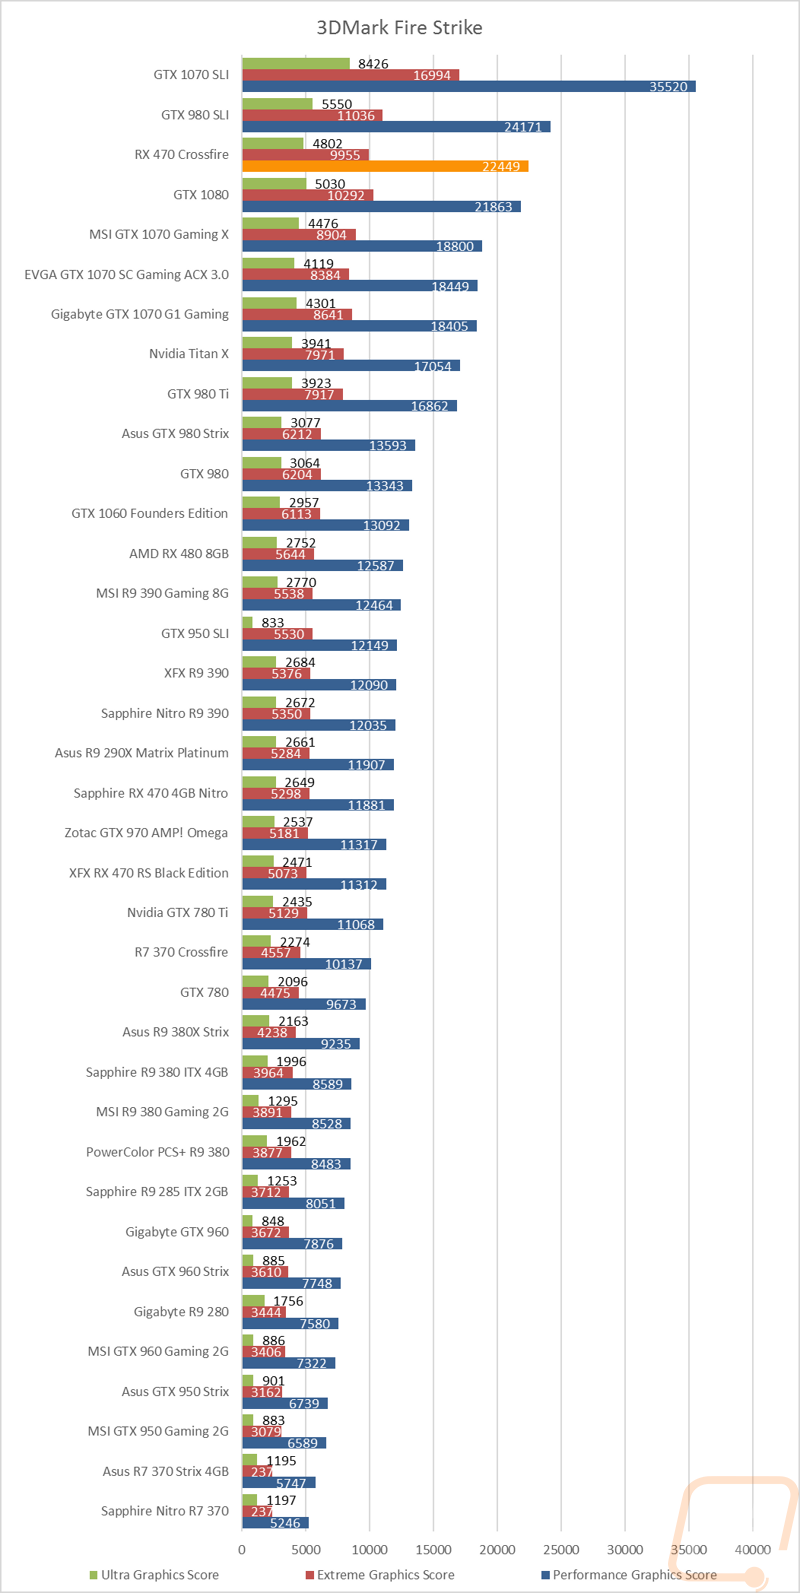
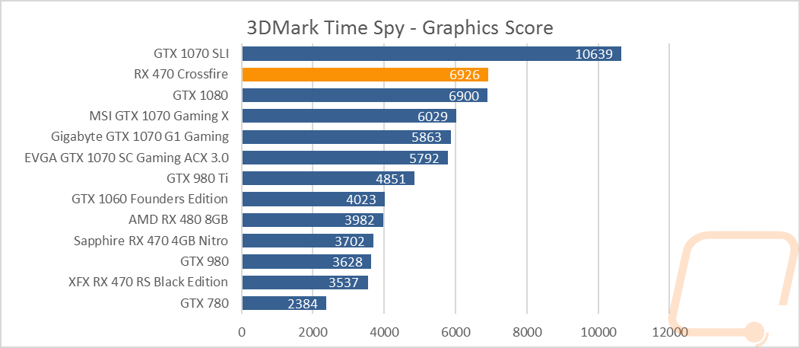
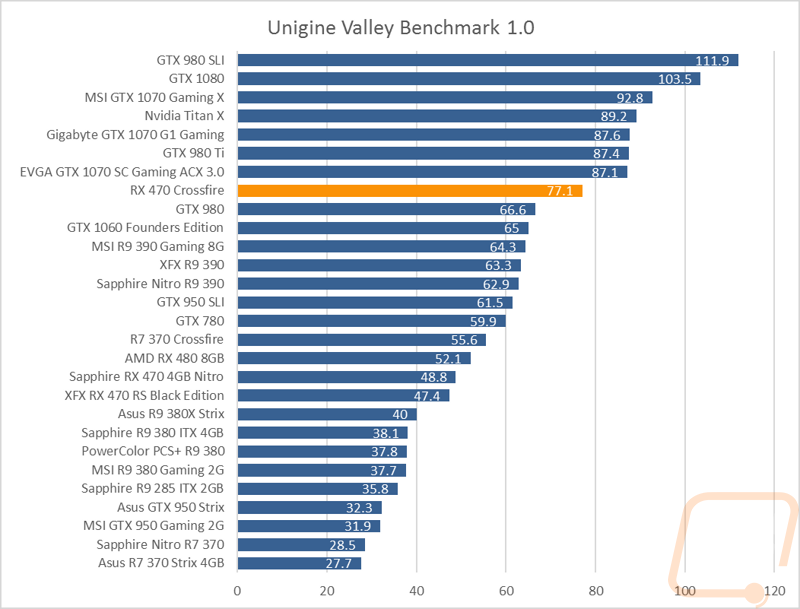
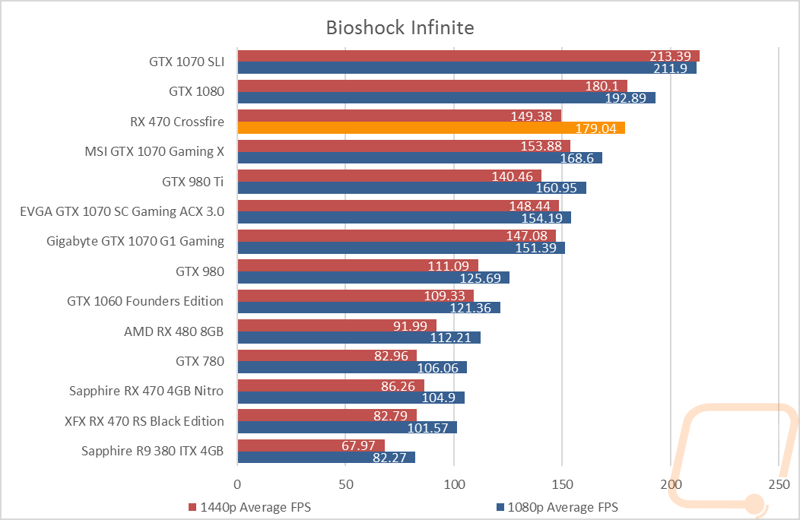
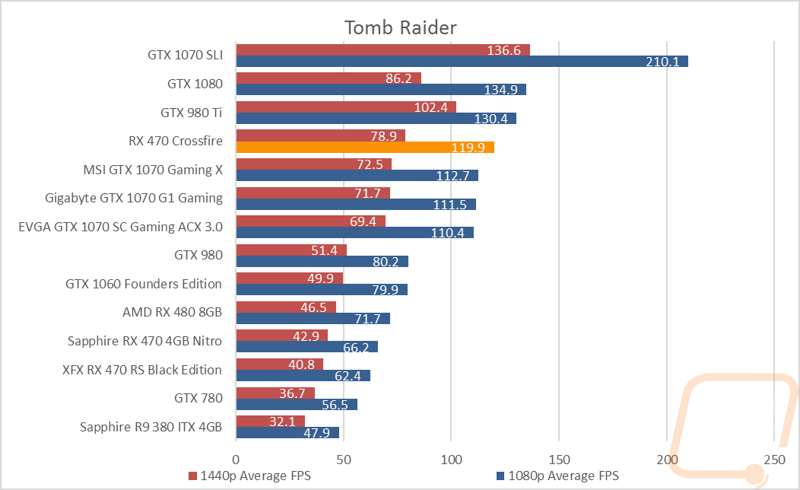
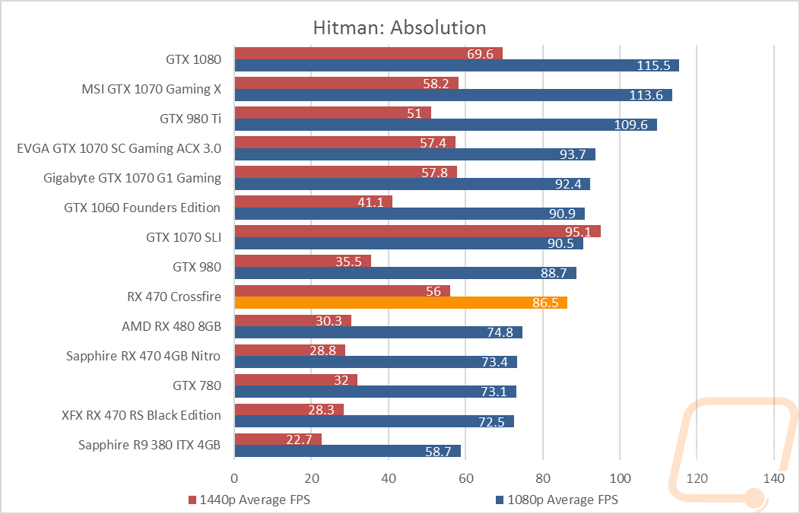
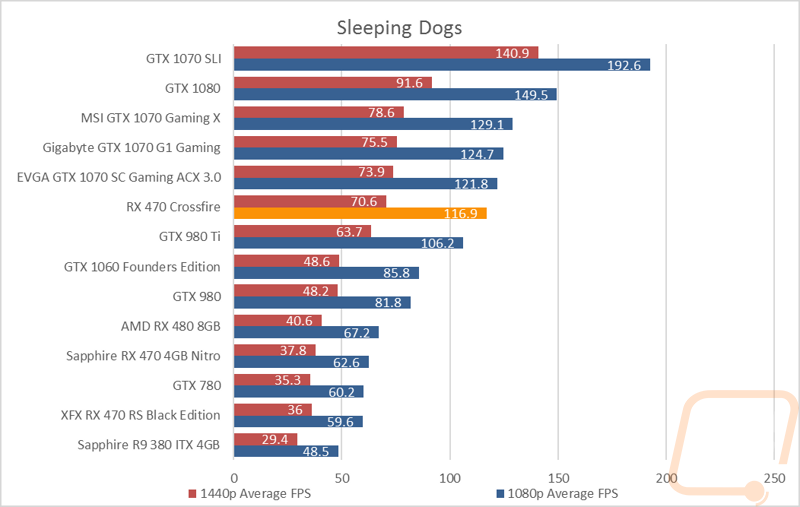
If you didn’t take a look at the benchmark results on the previous page the two RX 470’s kicked some butt in 3DMark. I was expecting the two cards to fall near the GTX 1070 but in 3DMark they actually outperformed the GTX 1080 on the performance setting. The lower vRAM did come into effect when the resolution was turned up and the GTX 1080 did outperform the 470’s in Crossfire in the Extreme and Ultra settings. In Valley Benchmark doubling up the cards took us from 48.8 FPS to 77.1 but this was still less than the GTX 1070 and the GTX 970 Ti. In game, things were a little more hit and miss. Four of our benchmark games didn’t have an improvement or actually dropped in performance compared to a single card but in the other 7 games, the 470’s in Crossfire came in near the GTX 1070 in most cases. A few it was ahead and a few were below, but they were always close.
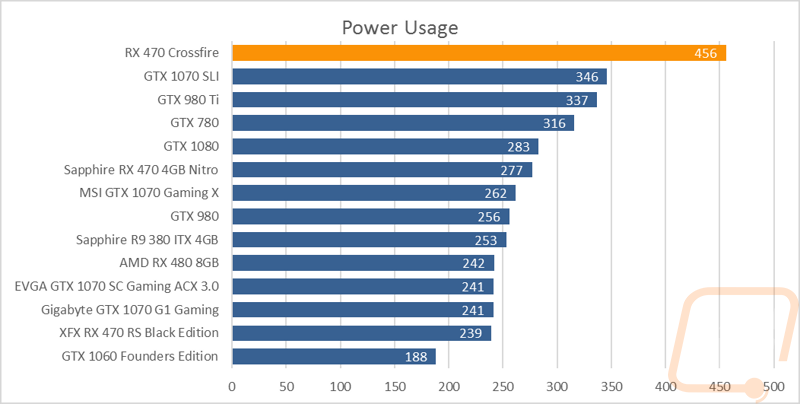
I also took a look at the overall power usage of the cards when in Crossfire. Remember that both cards pulled a lot more power than I expected when running individually, so it wasn’t a huge surprise when they topped the charts here. It is interesting though that the two 470’s are close to the GTX 1070 in performance in most benchmarks assuming Crossfire is supported but the two cards actually pulled 110 more watts than TWO GTX 1070’s did in SLI for me. A lot of that is because the two aftermarket RX 470’s I tested with were overclocked and the Sapphire especially had its power turned way up. Anyhow here are the results.
So is picking up a pair of RX 470’s a good buy. Well for starters this is an interesting one because Nvidia doesn’t really have anything to compete with the RX 470 right now and even the GTX 1060 doesn’t support SLI, so AMD is on their own with these lower priced multi-card configurations. AMD doesn’t publish a list of games with Crossfire support like Nvidia does, so as always, before even considering picking up a second card you should check to see if the games that you actually play support it. Because all of the performance in the world won’t matter if the games you play don’t support it. So are you better off picking up two RX 470’s or one GTX 1070? Well if you play a variety of games the single card solution is going to be the better option, simply because it will perform the best in every game. But assuming your favorite games support Crossfire, picking up two RX 470’s is going to get you similar and sometimes better performance than the GTX 1070. Considering those two cards would be cheaper than even the cheapest GTX 1070 right now, it would be a good buy. Especially for AMD fans who can’t wait for Vega.


