Synthetic Benchmarks
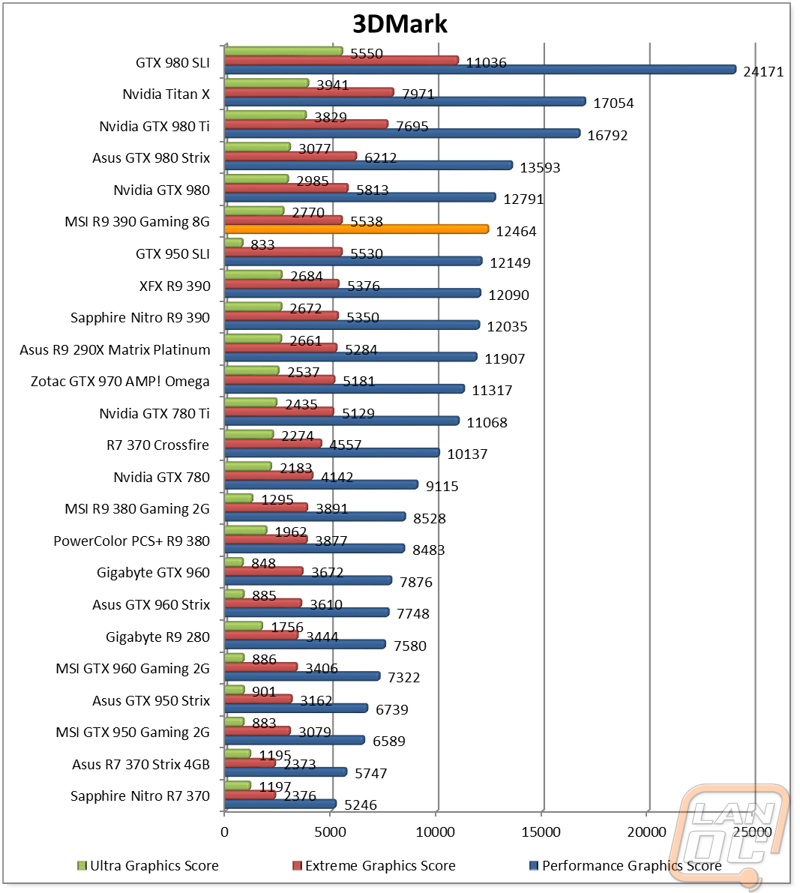
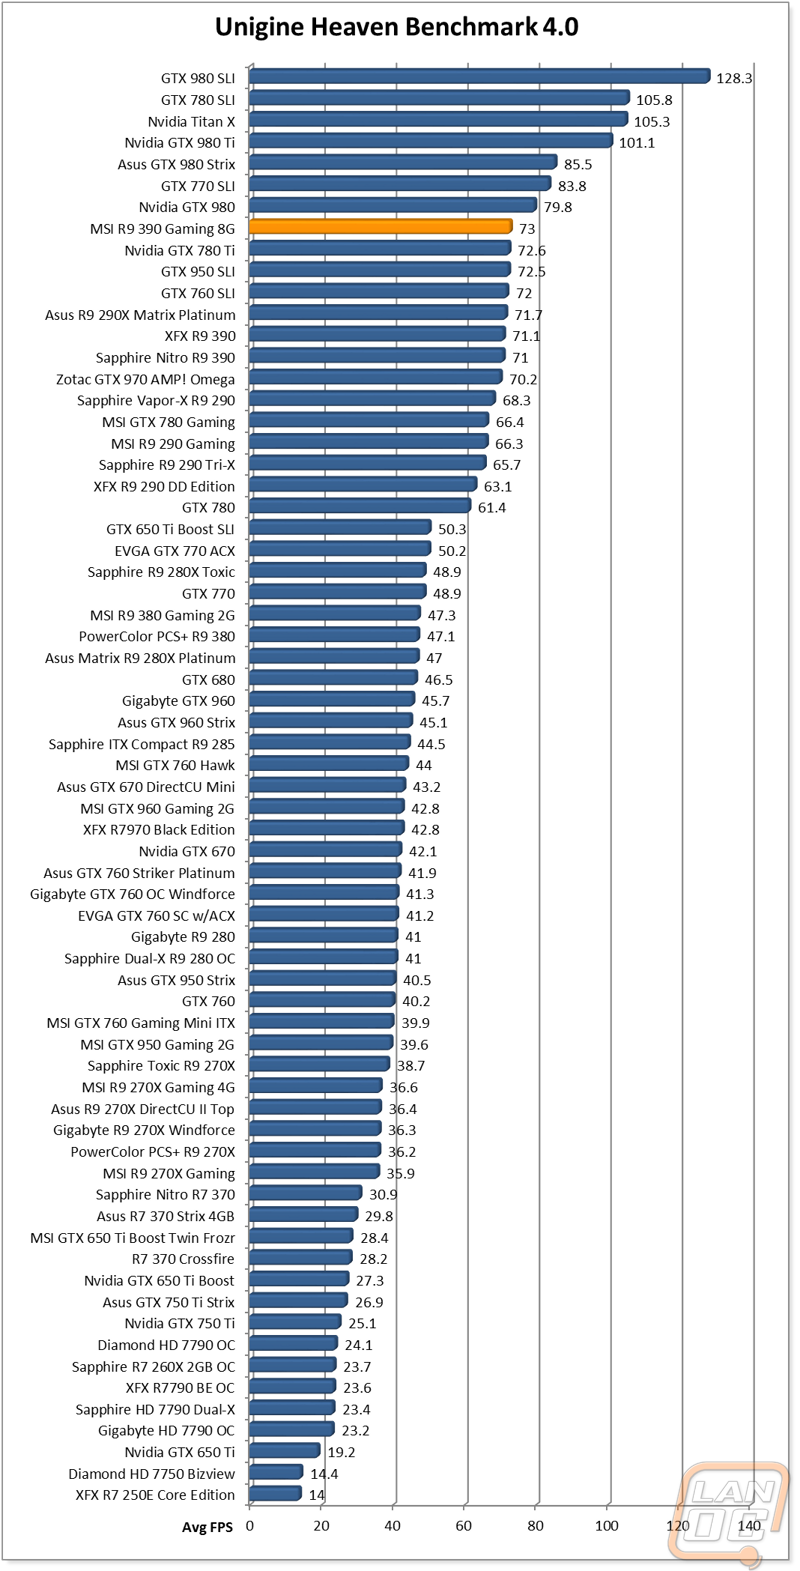
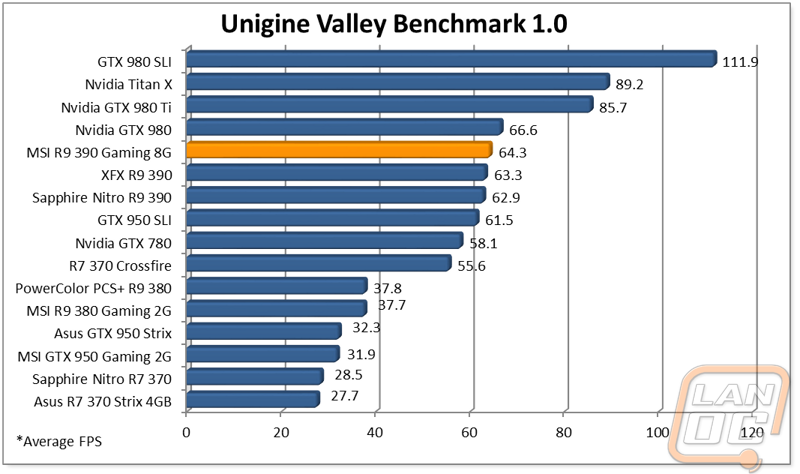
To start off our testing I like to go with out synthetic benchmark suite. Here we don’t see real world performance, but generally the tests all do a great job of being consistent and being able to compare the numbers between cards. So here I wanted to see how well the 390 Gaming 8G would perform compared to the other R9 390’s as well as the GTX 950 SLI that I recently tested. I started first with 3DMark where we can test the card at 1080p, 1440p, and then 4k to get a look at the entire range of performance. The MSI R9 390 Gaming 8G performed well pulling out a slight edge over the other two R9 390’s that were tested in all three tests. It also had a few hundred on the 950’s in SLI in the performance and extreme benchmarks. When the resolution was cranked up in the ultra benchmark the 950’s fell on their face and the 390 Gaming 8G pulled way ahead. The slight increase in performance for the MSI did put us a little close to the GTX 980 reference card as well. In Unigine Heaven Benchmark the results were very similar to the performance test in 3DMark with the 950’s in SLI getting close but not being able to overtake the MSI 390. The gap here between the 390 and the GTX 980 was a lot bigger though. In the Valley Benchmark the gap was much closer (less than 2 FPS).