Synthetic Benchmarks
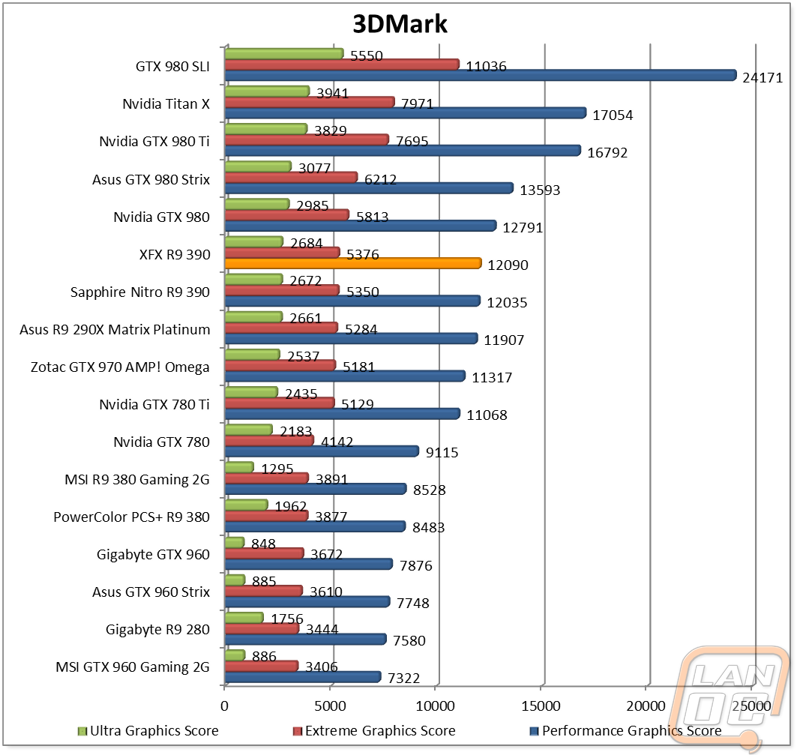
To start off my testing I went with the tried and true synthetic benchmarks. We use these to look at the difference in performance between the cards as they have results they don’t change as much between driver revisions and they are consistent. The results don’t show you how the XFX 390 will perform in game, I will get into that testing next. The first benchmark I went with was 3DMark Fire Strike in all three settings to see how the cards handle various resolutions and graphical settings. The XFX came in with a very similar setup to the Sapphire 390 that I tested last week. The XFX has an extra 5MHz on the GPU clock speed and they have the same memory clock. That small difference did seem to show in 3DMark with the XFX edging out the slightest lead over the Sapphire in all three tests. This put the XFX 390 in right below the GTX 980 and above the GTX 970 just like the Sapphire as well.
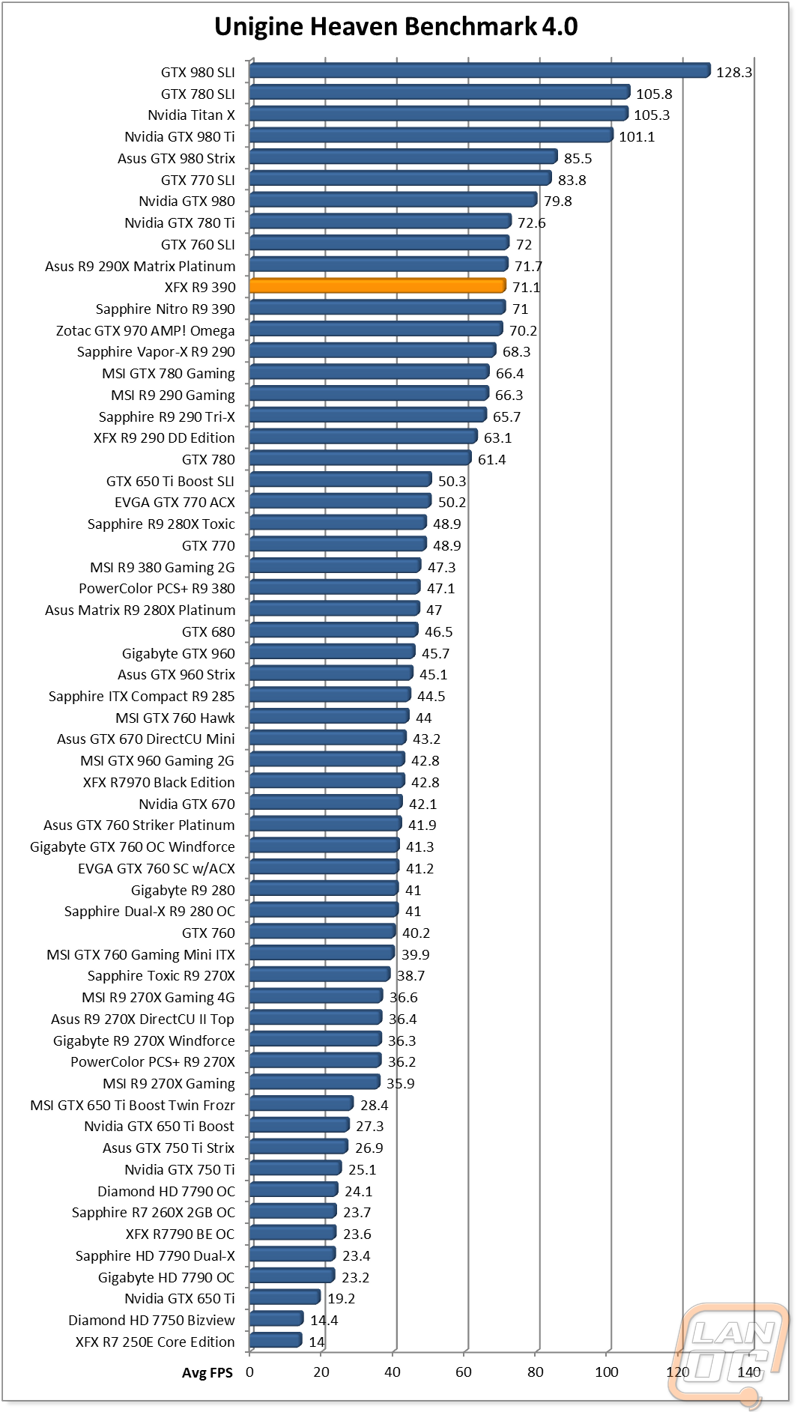
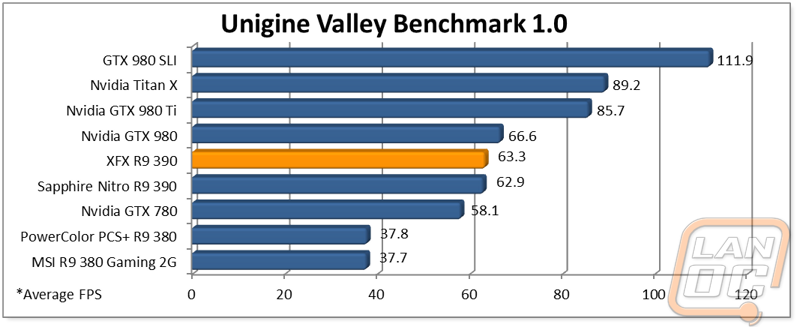
Next I ran through both Unigine benchmarks as we slowly move over to the Valley Benchmark in the future. In Heaven the XFX pulled a .1 FPS edge over the Sapphire and .4 in the Valley Benchmark. In both tests the GTX 980 was out ahead along with the GTX 970 being behind, no big surprises here, other than 5MHz getting you almost a half an FPS in Valley Benchmark lol.