Performance
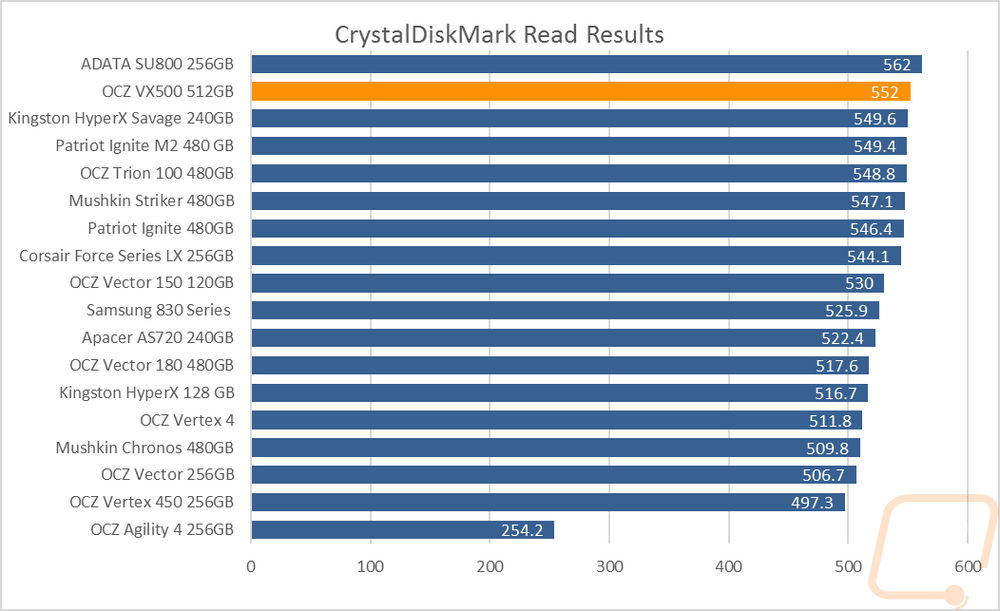
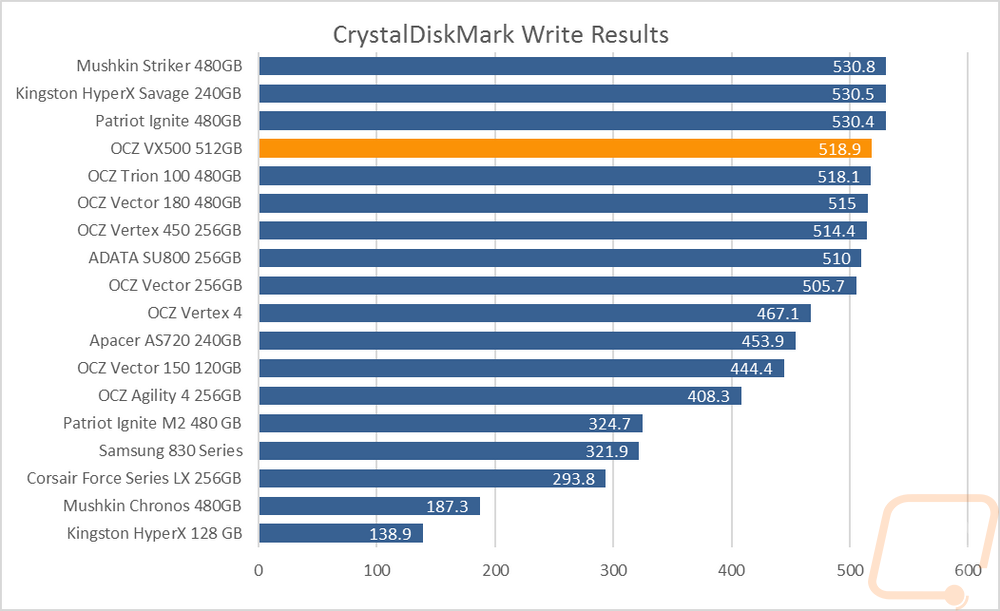
As always to start off my performance testing I started with CrystalDiskMark. Focusing on just the sequential queue depth of 32 at a block size of 128KiB. I do this with both read and writes. For reads, the VX500 comes up close to the top of the charts with just the 3D NAND based SU800 ahead of it. For write speeds, the numbers are a little less impressive with three Phison S10 based drives all ahead of it.
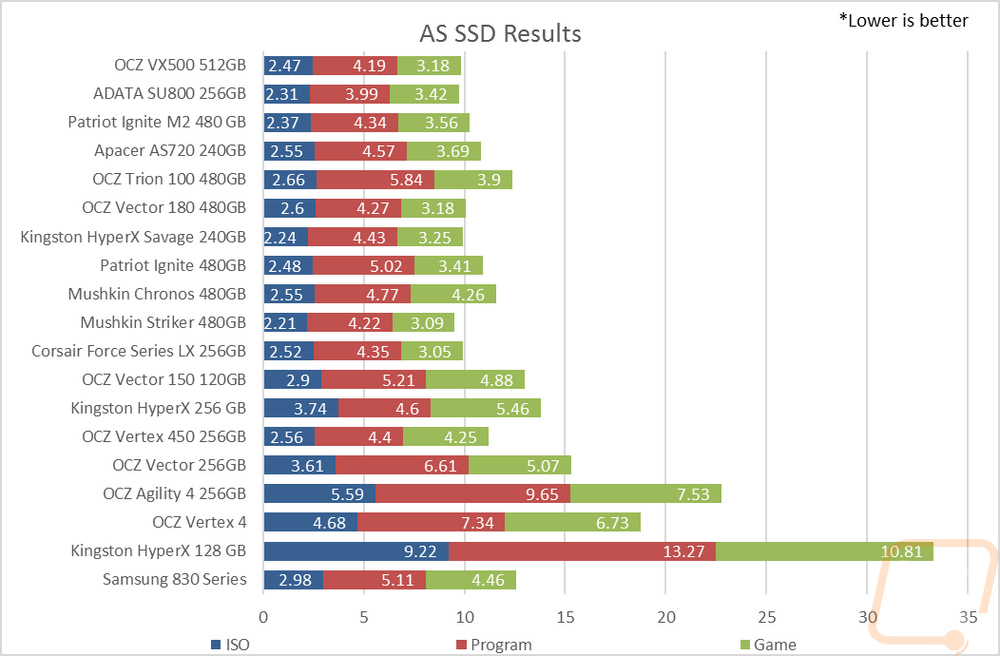
Next, I test using AS SSD using the Copy Benchmark that tests transfer speeds when copying three different file types. Here the VX500 performed well with none of the results being the fastest, but all three being higher than average making for a good overall result.
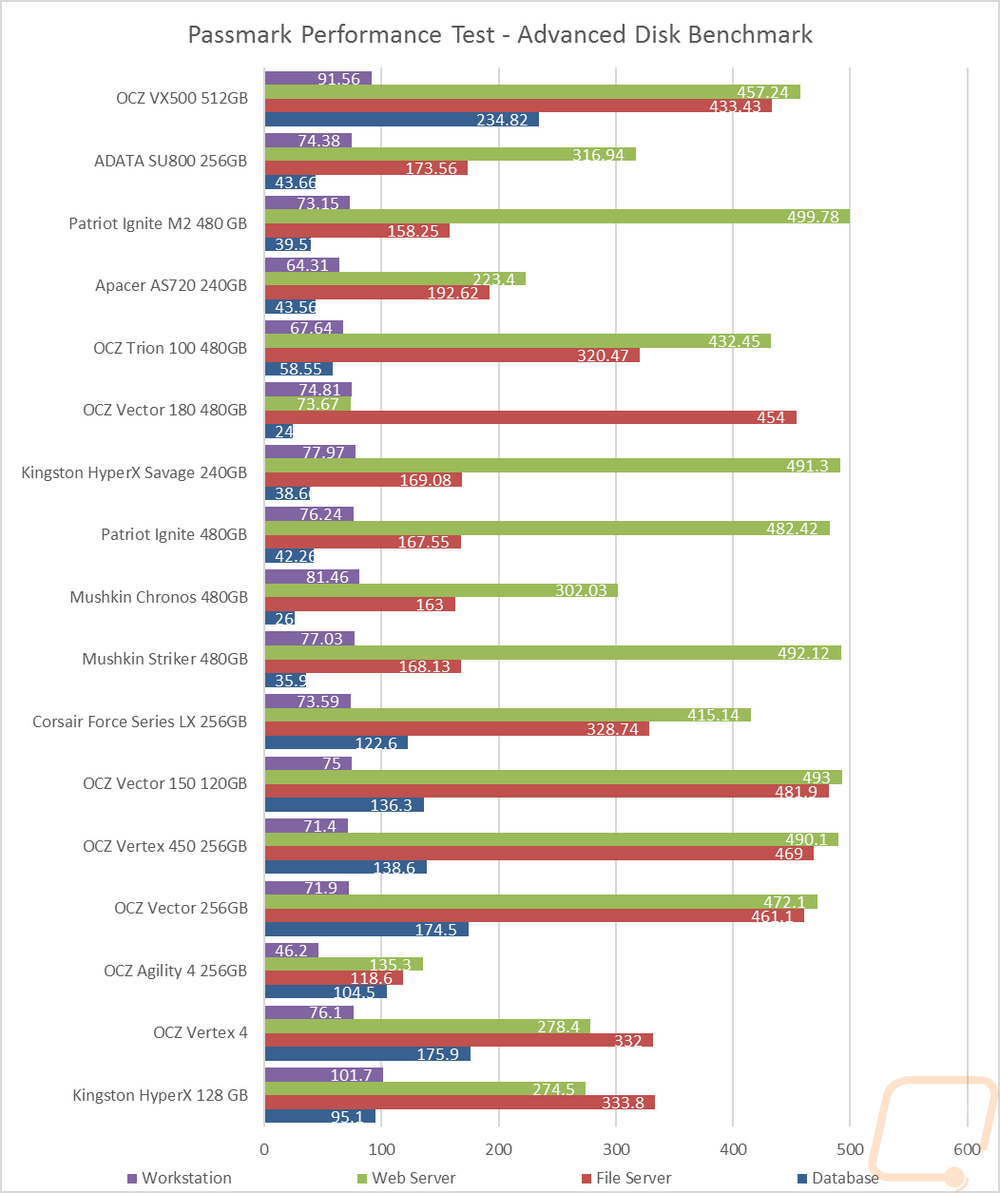
Using the advanced disk benchmark inside of Passmarks Performance Test I tested the VX500 in simulated benchmarks of workstation, web server, file server, and database server load types. These are mostly irrelevant for anyone using the drive in a normal PC with the exception of the workstation workload, but it is nice to know how I would perform in all situations. Here it came out as one of the fastest drives in the workstation workload, the fastest by a large margin in the database workload, and was fast but not near the top in web and file server workloads.
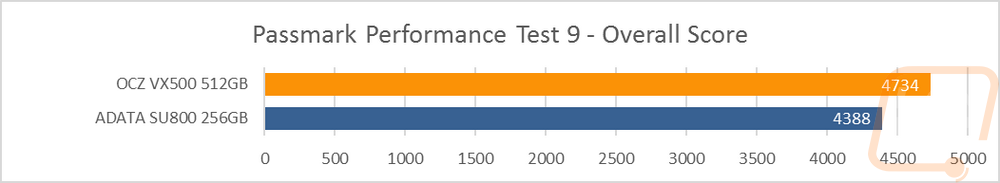
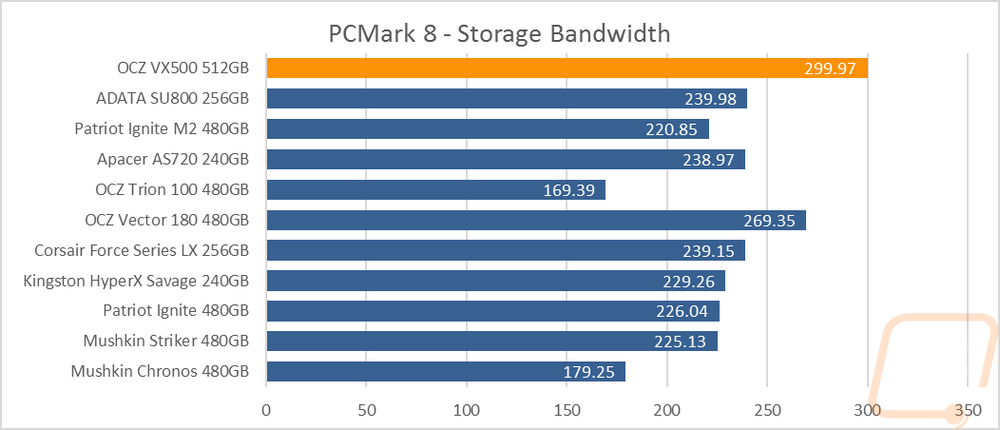
For testing closer to real world I used PCMark 8’s Storage benchmark and Passmark Performance Test 8’s storage benchmark. In PCMark 8 I focused on the overall average bandwidth that the drive sustained during all of the various everyday tasks like web browsing and word processing. This made for a very impressive 299.97 result that is significantly faster than the other drives tested. In Passmarks Performance Test 9 I used the overall score. This is a new test for storage reviews so I only had the SU800 and the VX500 to compare but the VX500 did extremely well with a 346 point lead.
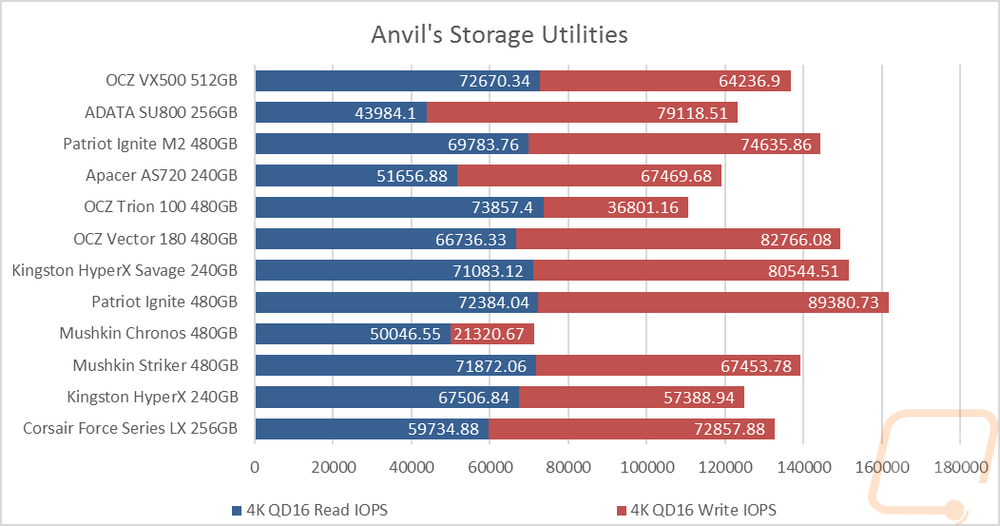
I then jumped into Anvil’s Storage Utilities to check out IOPS. Here I ran the full benchmark but I am only focusing on the 4K 16 queue depth results from both the read and write sides. Here a higher number is better and I combined both results to get a good idea of overall performance. When combined the VX500 is near the middle of the charts but its read speeds are second only to the OCZ Trion 100 of the drives I have tested. The write speeds weren’t too bad but with a few of the Phison S10 drives once again being much faster with write speeds it drops the VX500 in the combined results.
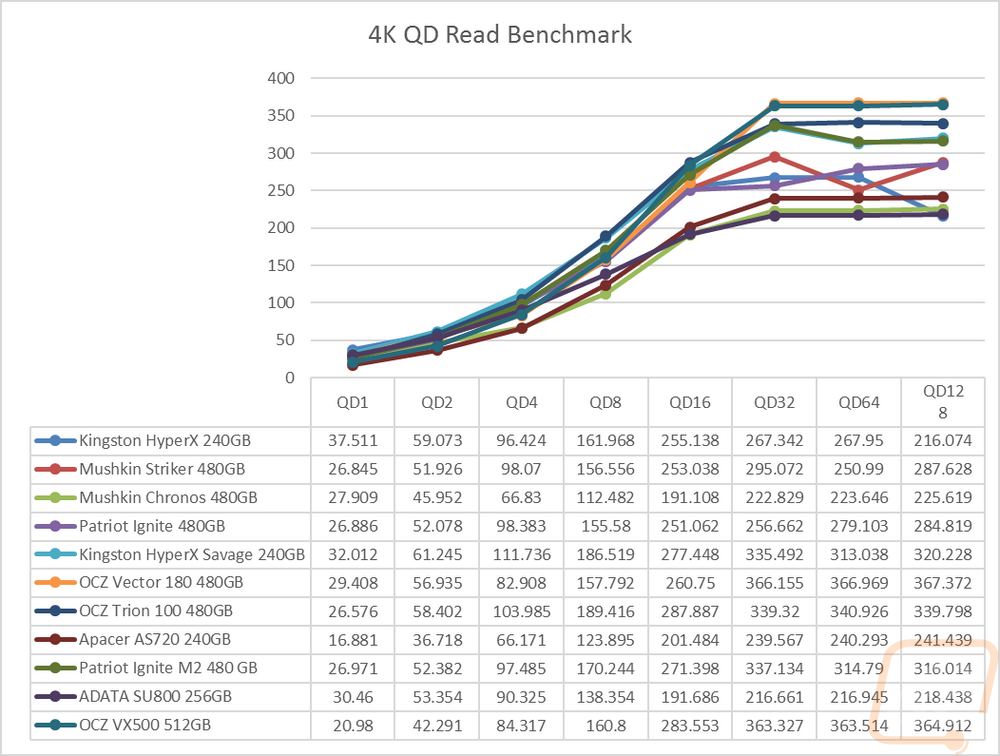
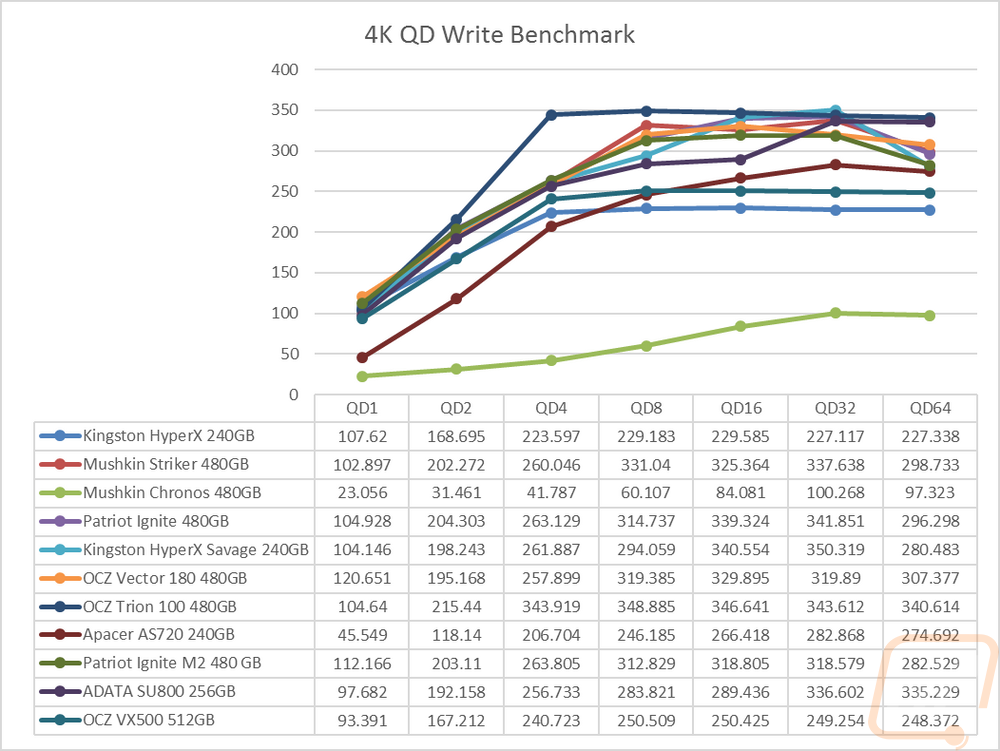
For my last benchmark, I stay in Anvil’s Storage Benchmark but run through a whole series of benchmarks testing the drive across different queue depths on both the read and write sides to see how well it scales up. On the read tests what I found was that the VX500 scales up in the top echelon of the drives tested and was significantly faster than the 3D NAND based SU800 from QD8 on up. It wasn’t the fastest at the high queue depths, but it was in the top three behind the OCZ Vector 180 that it is replacing and the OCZ Trion 100. For the write tests, the numbers weren’t as flattering. The VX500 didn’t really keep up even from the beginning and ended flat from about QD4 with just a tiny bump at QD8.