Performance
Fancy stickers and aluminum cases are great and all, but the performance is what it’s all about in the end. I ran the Vector 150 through our benchmark suite to see how it compares to all of the drives we have tested in the past.
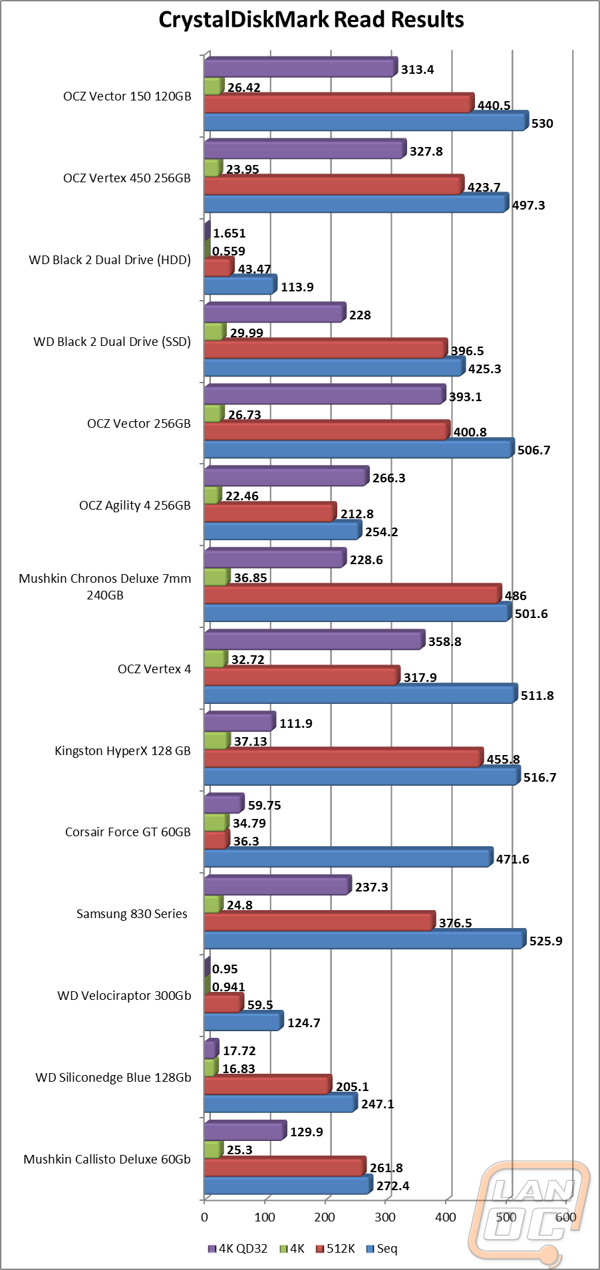
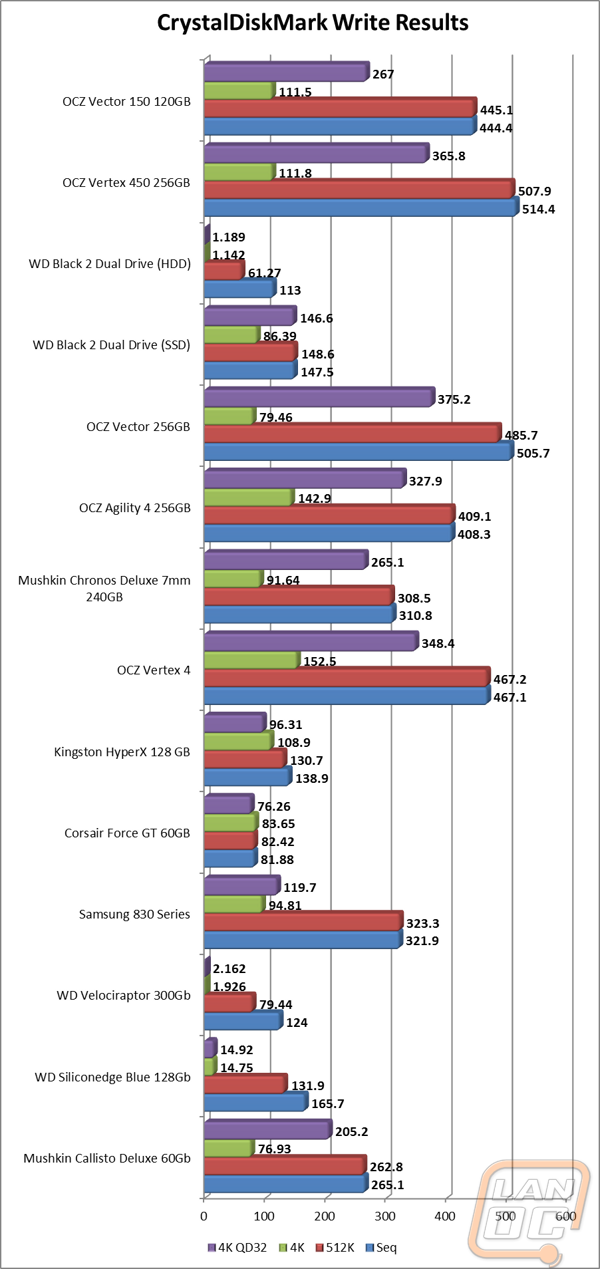
Starting with Crystal Disk Mark the Vector 150 really pulled ahead in maximum read speed on the sequential setting with a whopping 530MB/s. With a queue depth of 32 the performance was a little lower than the Vertex 450 and considerably lower than the original Vector, but when compared to non-Barefoot 3 drives it did perform really well. At 4k the Vector 150 performed noticeably better than the other Barefoot 3 drives, edging closer to the performance that we saw with the Sandforce drives. Write speeds sadly took a big hit compared to the Vertex 450 as well as the original Vector.
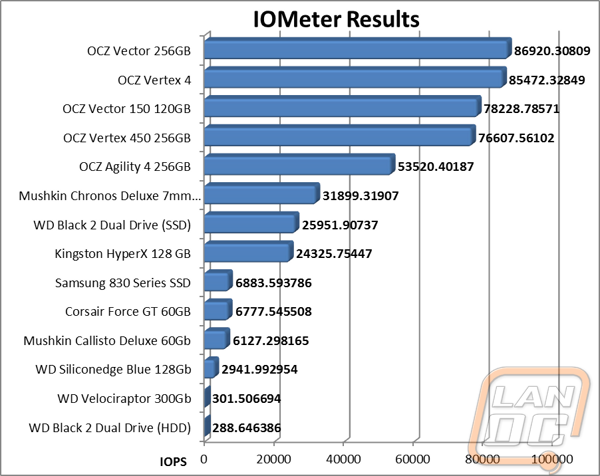
In IOMeter we can see how the Vector 150 falls in below the original Vector and the Vertex 4 for total IO. It still pulls ahead of the Vertex 450 and far ahead of the rest of the drives tested. With a total IO of 78,229.
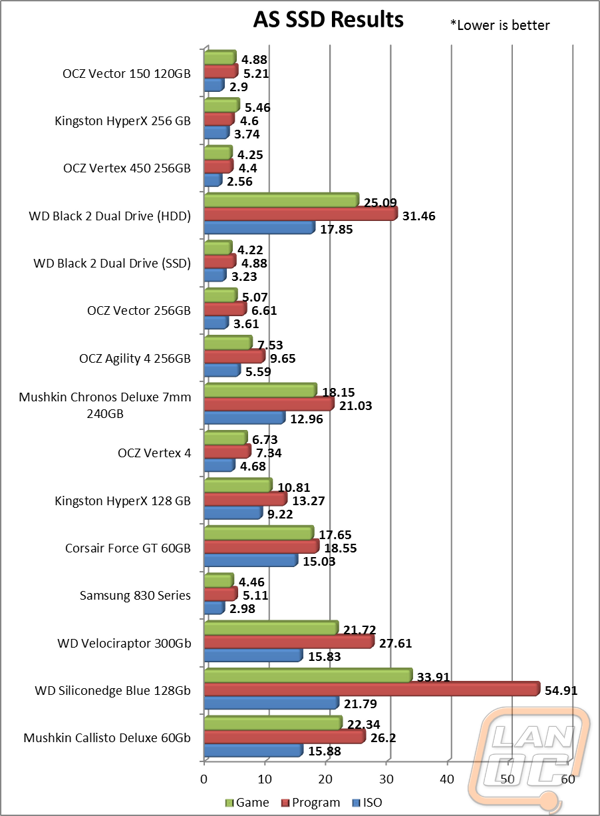
AS SSD is the one timed benchmark that I run the drives through, meaning this is the only time that having a lower score is better. Even so surprisingly the Vertex 450 came in slightly ahead putting the Vector in between it and the original Vector. The WD Black 2 in SSD mode and the Samsung also pulled slightly ahead. All in all the performance was still more than respectable.
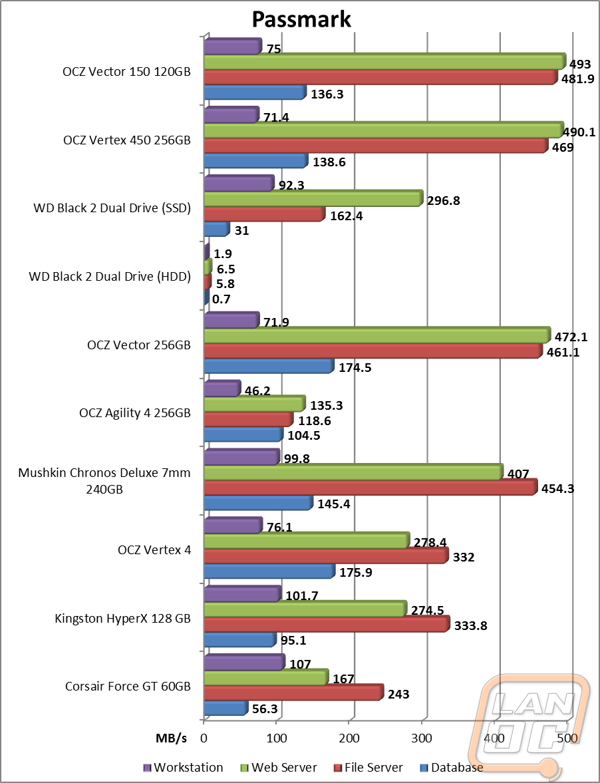
Our Passmark benchmark runs through all four of its usages examples. In three of the four tests the Vector 150 came in almost spot on with the Vertex 450 and not far from the original Vector. The database test was slightly different though with the original vector coming in ahead by a fairly large percentage.
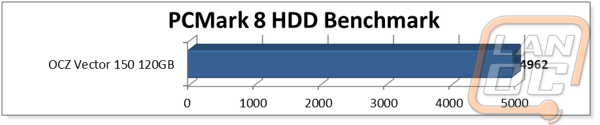
To finish things off I did run the Vector 150 through the PCMark 8 HDD benchmark as well. There aren’t any comparison numbers right now but in the future I will be filling in the results. PCMark 8 does a great job benchmarking the drive in multiple real world situations including WoW and Office. All of the results are put together to create the final score.