AMDs 7000 Series CPU launches brought along with it the new AM5 socket which now uses an LGA socket style as well as DDR5 and PCIe 5.0 as well. For CPUs they have a variety of options and their performance has been impressive. The one exception to that is looking at gaming performance when compared to AMDs own Ryzen 7 5800X3D CPU which was the first desktop processor to have a stacked 3D L3 cache. This was a late addition to the 5000 series of CPUs and offered staggering performance in cache-limited situations, especially gaming. Well for the 7000 series they have announced three 3D CPUs, the Ryzen 7 7800X3D, Ryzen 9 7900X3D, and the flagship Ryzen 9 7950X3D. The two Ryzen 9 CPUs are launching tomorrow February 28th and they did send over the 7950X3D for testing so today I’m going to see how it performs.
Product Name: AMD Ryzen 9 7950X3D
Review Sample Provided by: AMD
Written by: Wes Compton
Amazon Affiliate Link: HERE
3D What?
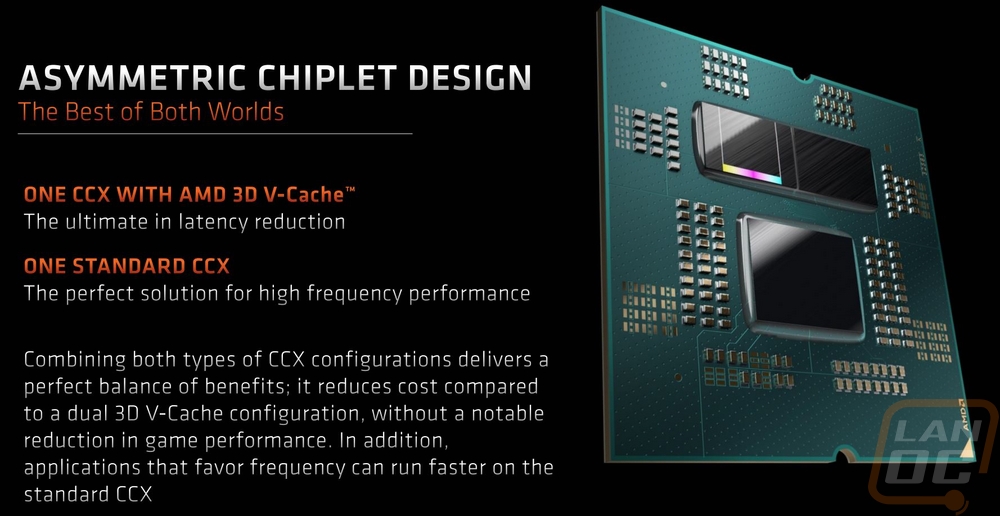
With the 7000 Series of CPUs, AMD brought along a lot of changes which I’ve gone over in past coverage. But the new Ryzen 9 7950X3D and the two other 3D CPUs that AMD has announced while being based on the same Zen 4 architecture have changed a few aspects of things. The specifications however really only show part of the picture. Below I put together the specifications for the new 7950X3D that they have sent over for testing and the original Ryzen 9 7950X that I covered last September. The 7950X3D does have the same 16 core count and 32 threads which puts it right at the top of the product stack alongside the 7950X. It also has the same 5.7 GHz boost clock speed but AMD did change the base clock from 4.5 GHz down to 4.2 GHz. The L2 cache is still 1MB per core but the 7950X3D now has 128MB of L3 Cache which is insane. It has the same 64MB of standard L3 cache like the 7950X but they have also added their 3D V-Cache which is stacked. The reason for the two different L3 caches is to help balance the 7950X3D better depending on what you are using it for. 3D V-Cache offers significant improvements in latency but is expensive. In short, AMD has two chiplets on the 7950X3D with 3D V-Cache paired up with one and then one standard CCX. This balances out the additional cost of 3D V-Cache where doubling up wouldn’t offer much of a performance benefit. This is their asymmetric chipet design.
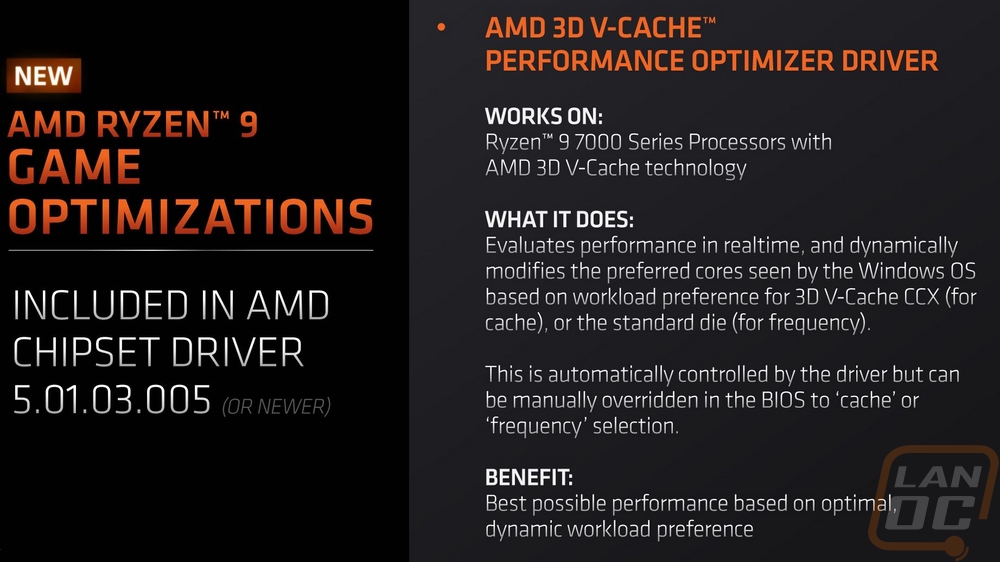
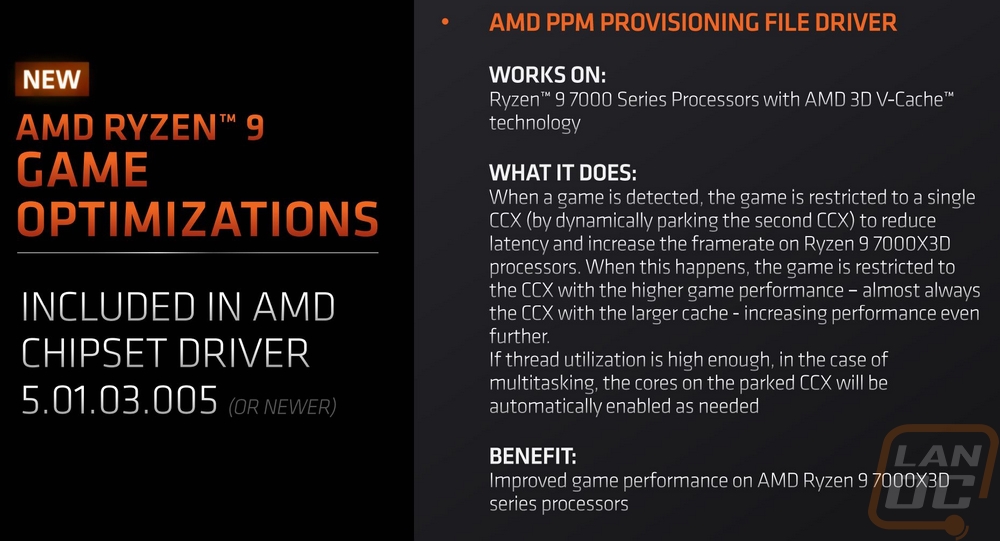
This does mean that AMD has to do a few unique things to optimize everything on the driver and software side of things that I did want to touch on. In the driver, they have the AMD 3D V-Cache performance optimizer which looks at performance in real-time and can change the preferred cores to move things from the 3D V-Cache cores over to the standard d die which is better for frequency-focused applications. Then on the software side of things, AMD is using their PPM provisioning file driver which will detect when you are in a game using Xbox Game Bar and lock the game to a specific CCX depending on what will benefit the game more. They do note that when a game uses more cores it can and will unlock and let all 16 get to work as well.
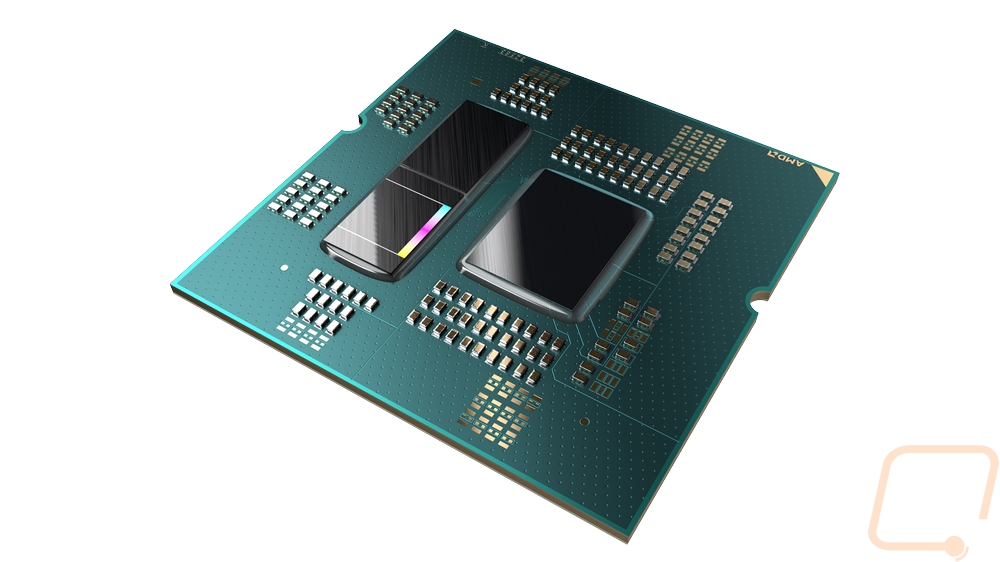
Here is a look at the CPU without the heatspreader and the 3D V-Cache does have that cool rainbow effect on it.
The other big change in the specifications beyond the base clock and L3 Cache can be found in the power draw specs. The 7950X3D has dropped the TDP down to 120 watts from 170 watts on the 7950X. Max current and the max socket power have all been dropped down to match as well and the new TjMax is lower meaning with precision boost it won’t be targeting as hot of a temperature as it boosts the clock speed. The rest of the specs are basically the same, the specs listed this time around list the cooling as a 280mm AIO, not the 240 or 280 AIO that they listed for the 7950X but everything else matches.
|
Specifications |
Ryzen 9 7950X |
Ryzen 9 7950X3D |
|
Cores/Threads |
16/32 |
|
|
Max Boost |
5.7 GHz |
|
|
Base Clock |
4.5 GHz |
4.2 GHz |
|
L2 Cache |
16 x 1MB |
|
|
L3 |
64MB |
128MB |
|
TDP |
170W |
120W |
|
Max Socket Power (PPT) |
230W |
162W |
|
Max Current (EDC) |
225A |
180A |
|
Max Current Thermally Limited (TDC) |
160A |
120A |
|
TjMax |
95c |
89c |
|
Boost Algorithm |
Precision Boost 2 |
|
|
Recommended Cooler |
240-280 Liquid (or equivalent) |
280mm AIO Liquid Cooler |
|
Max Memory Speed (Non-OC) |
DDR5-5200 (2x16GB) |
|
|
ECC Support |
Enabled in-silicon, support varies by motherboard |
|
|
CCD Die Size |
70mm ² |
|
|
CCD Transistor Count |
6.5 Billion |
|
|
IOD Die Size |
122mm ² |
|
|
IOD Transistor Count |
3.4 billion |
|
|
MSRP |
$699 |
$699 |
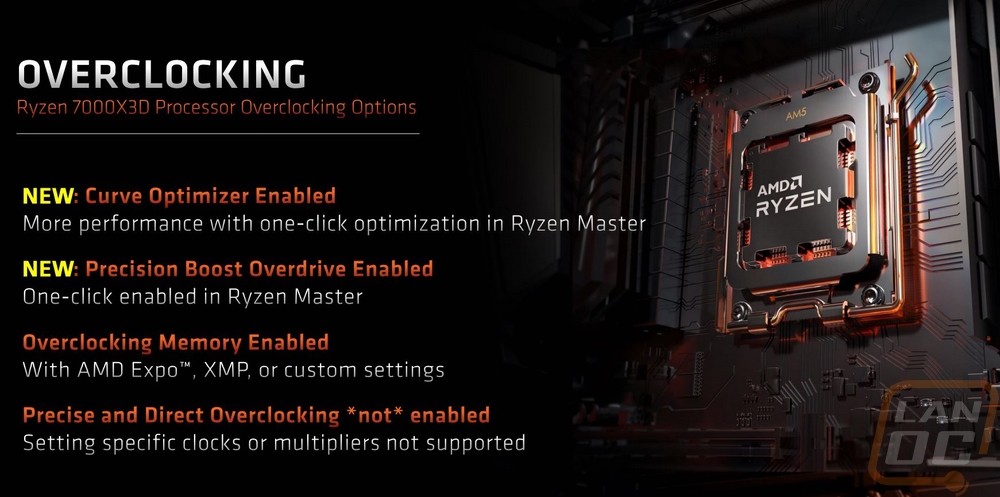
As far as overclocking goes, AMD does have their new AMD Expo memory overclocking enabled. The 7950X3D also supports the curve optimizer and precision boost overdrive which can give you simple one-click overclocks. But precise and direct overclocking is not enabled which means you cant set specific clocks or multipliers. The 5800X3D was the same so this isn’t too big of a surprise, but keep it in mind.
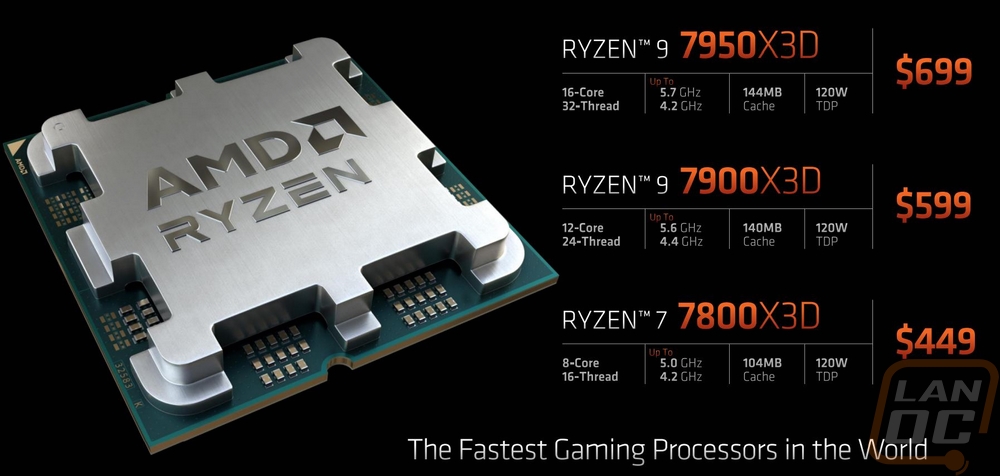
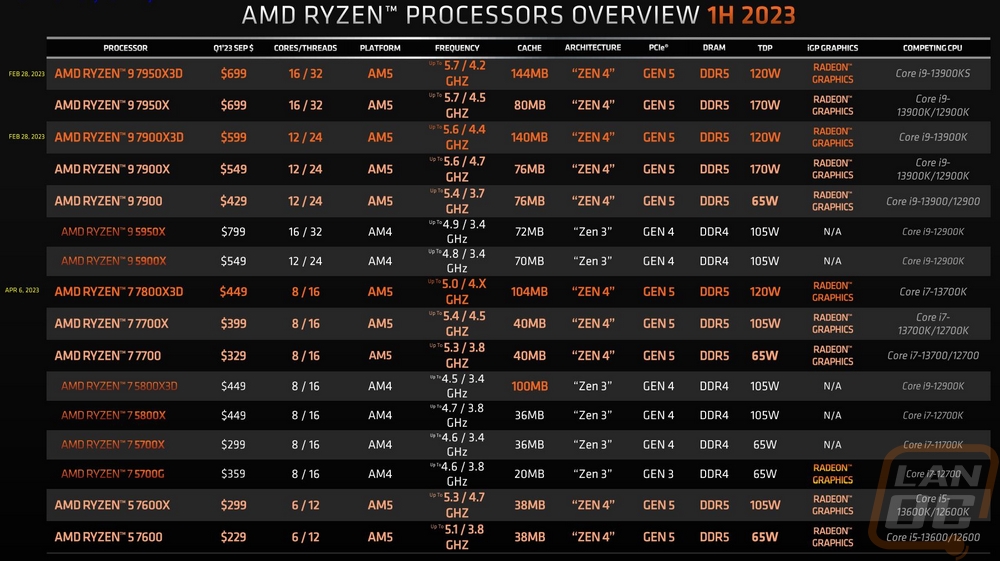
The Ryzen 9 7950X3D is launching at the same $699 MSRP that the Ryzen 9 7950X is priced. AMD is also launching the 7900X3D at the same time for $599 which is priced $50 higher than the original 7900X. The 7900X3D has the same 12 cores and 24 threads as the 7900X but like the 7950X3D it has a lower base clock speed and it has 140MB of Cache whereas the 7900X had 76MB and its TDP is dropped down to 120 watts as well. The third 3D CPU has been announced but doesn’t launch tomorrow like the other two. That is the Ryzen 7 7800X3D which is priced at $449, $50 more than the 7700X, AMD doesn’t have a 7800X model at all to pair up with it but it does match up close with the 7700X. It has 104MB of cache compared to the 40MB of the 7700X and 8 cores and 16 threads. Both its boost clock and base clocks are lower than the 7700X but it has the same 120 TDP that the two other 3D CPUs have when the 7700X is a 105-watt CPU. All three CPUs have built-in dedicated graphics which is a surprise given how much is already packed on the CPU and I will check out how that performs in our testing as well even though these aren’t the type of CPU that you would want to live with onboard graphics for very long. It is nice to have the option for short-term situations though.
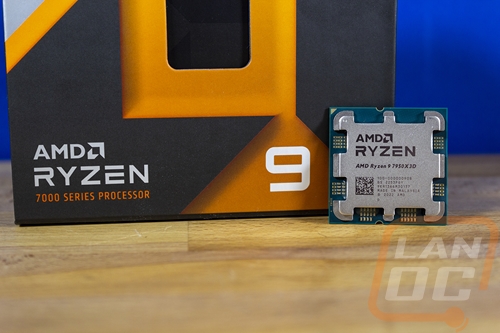
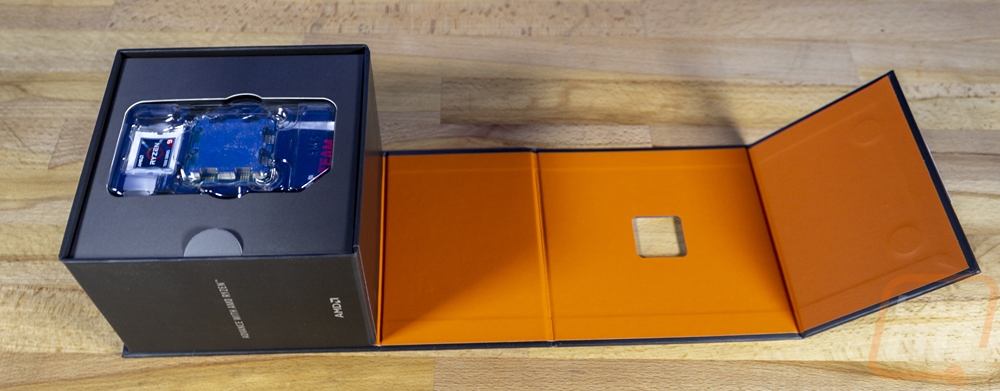
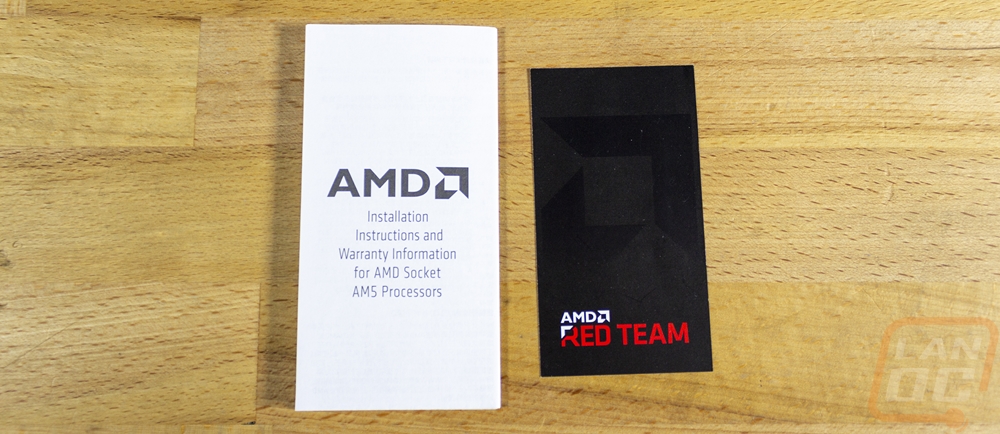
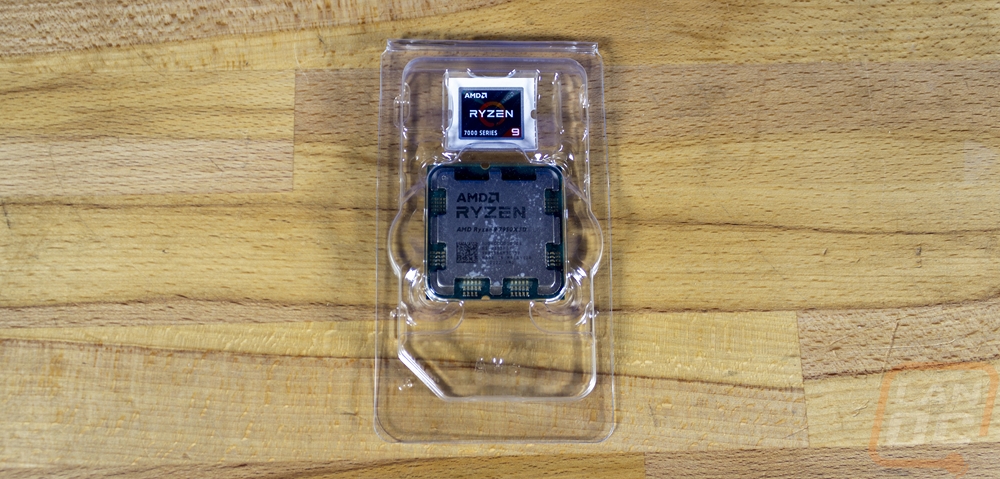
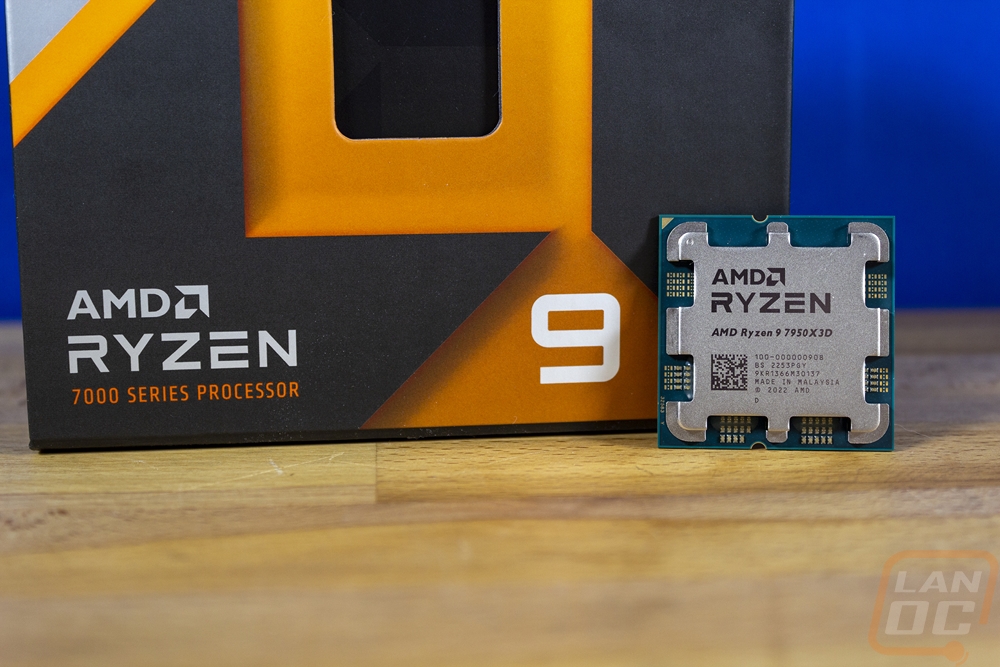
Where AMD often sends just the CPUs in their plastic clamshell for the 7950X3D they did send its full packaging for us to take a look at. The box has the Ryzen orange which I always love around the window on the front that shows the CPU. The packaging is held closed with the seal which when you cut you can roll three of the sides open. Inside the CPU is in its clamshell up on op sitting in a foam housing. While it is a normal-sized box, the 7950X3D doesn’t come with a cooler so a lot of that space isn’t used other than for the foam. You get a team red invitation card and installation and warranty information on a small piece of paper as well but that’s about it.
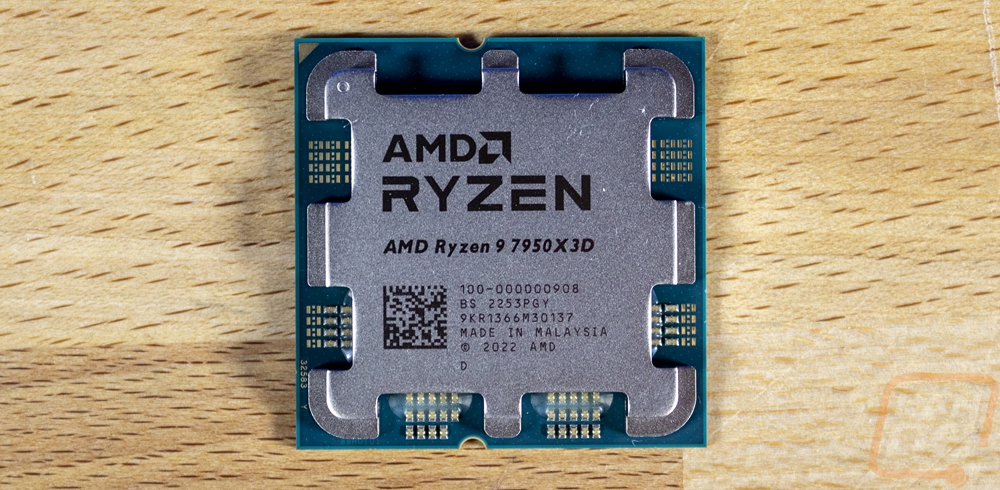
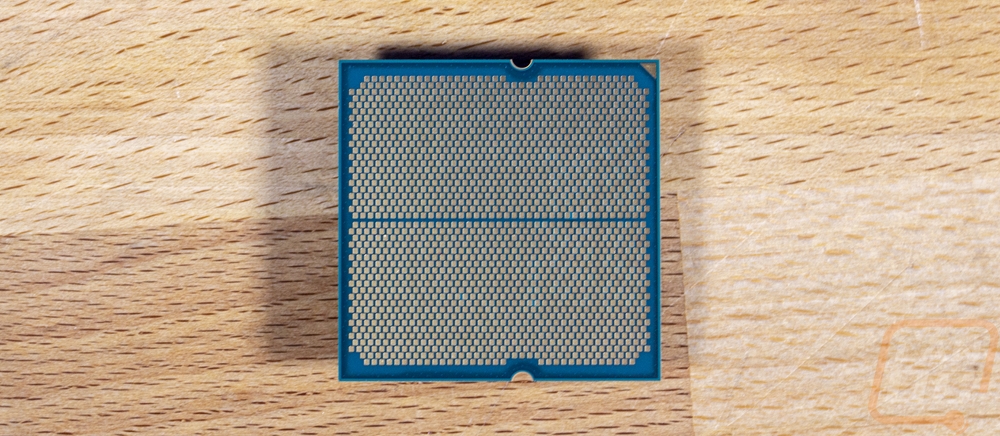
If you haven’t seen any of the new AMD AM5 CPUs there will be a few big surprises here. For starters, the clunky heat spreader of past Ryzen CPUs isn’t there. They have replaced that with the unique design that they originally introduced on the 5800X3D. Below that, though you will see that the CPU doesn’t have any pins, it now has an LGA-style socket like Intel has run for years. This does mean that the CPU is a little less likely to be damaged which is nice but that risk has been transferred to the motherboard socket, so be careful there.
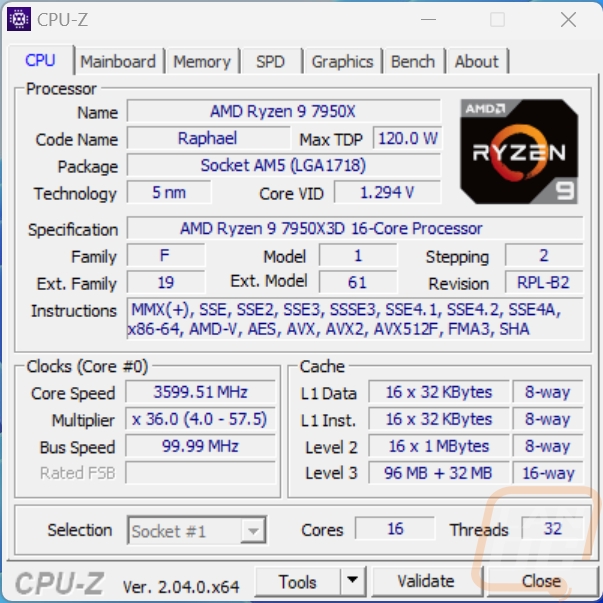
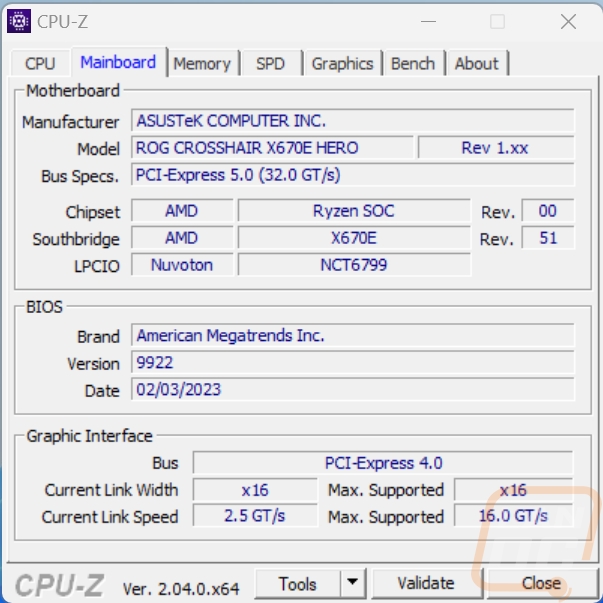
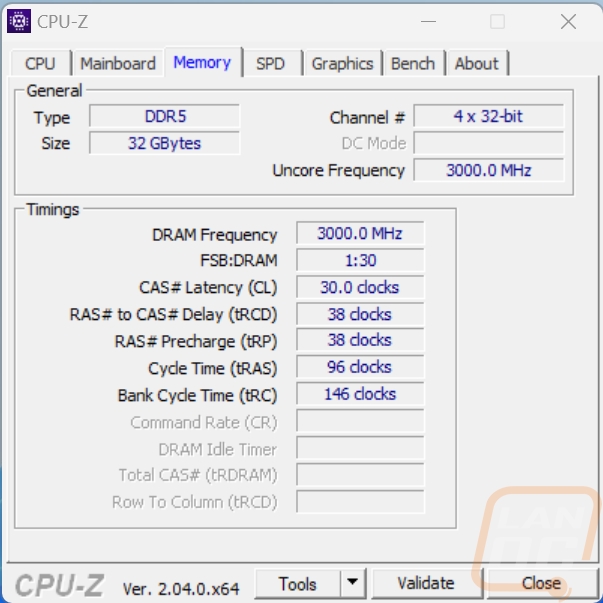
Before getting into testing the Ryzen 9 7950X3D I did check on it with CPUz and also documented our test configuration as well including the test BIOS. You can see our full test configuration in the test bench and procedures section.
Test Rig and Procedures
Test System
Motherboard: ASUS ROG Crosshair X670E Hero - Live Pricing
Cooling: Corsair iCUE H100i ELITE LCD Liquid CPU Cooler - Live Pricing
Noctua NT-H1 Thermal Paste - Live Pricing
Memory: G.Skill Trident Z5 Neo DDR5 16GBx2 6000MHz - Live Pricing
Storage: Kingston FURY Renegade 2TB PCIe 4.0 SSD- Live Pricing
Video Card: Nvidia RTX 4090 FE - Live Pricing
Power Supply: Corsair AX1200 - Live Pricing
Case: Primochill Wetbench - Live Pricing
OS: Windows 11 Pro 64-bit - Live Pricing
|
CPU Testing Procedures |
|
|
Blender |
Using official benchmark using 3.4.0 |
|
Handbrake |
Tested using 2d 4k 60 FPS version, resized using the Fast 1080p30 preset, average FPS used. Here is the file download location http://bbb3d.renderfarming.net/download.html |
|
Cinebench R20 |
CPU and CPU (Single Core results) |
|
Cinebench R23 |
CPU and CPU (Single Core results) |
|
POV-Ray |
Using built-in benchmark. Settings are all set to the "Standard Benchmark Switches" listed on http://www.povray.org/download/benchmark.php |
|
V-Ray Benchmark 1.0.8 |
CPU Benchmark time used as the score |
|
V-Ray Benchmark 5.0.2 |
vsamples score |
|
CPUz |
CPUz's built-in benchmark on the 17.01.64 version, both single and multi-core scores |
|
wPrime |
1024M Setting, core count set to the number of threads the CPU has |
|
7-Zip |
Built-in benchmark set to 32MB, which runs 10 passes. Combined MIPS, Compressing, and Decompressing scores all used. Just the Current result, not the resulting |
|
JetStream 2 - BrowserBench |
Core from website test using Chrome https://browserbench.org/JetStream2.0/ |
|
Passmark 10 |
CPU Mark Score |
|
Crossmark |
Benchmark from BapCo using Revision 1.2 documenting the overall score |
|
PCMark 10 |
Normal test ran, not the express or extended |
|
Procyon |
Office productivity benchmark is done with the current Microsoft Office 365, Photo Editing Benchmark is done with Adobe Photoshop and Lightroom Classic. All products are running on the latest version at the time of testing |
|
Dolphin 5.0 Benchmark |
This benchmark runs automatically and at the end gives you a time result in seconds https://bit.ly/2dpa9n3 |
|
3DMark |
Fire Strike - Physics Score – Performance benchmark, Time Spy - CPU Score, and CPU Profile test |
|
Tom Clancy's Ghost Recon: Wildlands |
Built-in Benchmark, 1080p, High detail setting |
|
Team Fortress 2 |
1080p – high, very high, high, reflect world, high, enabled, 8x msaa, x16, multicore on. https://bit.ly/2vOebin |
|
CS:GO |
This test is done using the workshop map called CS:GO Benchmark. You can find more information at this link. https://www.gamingpcbuilder.com/how-to-install-csgo-fps-benchmark-map/ I test at 1080p resolution. All auto settings are turned off and detail is set to their highest settings. shadow quality high, model texture detail high, shader detail very high, AA set to 16x, uber shaders enabled |
|
Dirt 5 |
Built-in benchmark, running at 1080p on all three resolution settings, V-Sync is turned off, dynamic resolution is turned off, and on the medium detail setting |
|
Far Cry 6 |
1080p with High Detail setting using the built-in benchmark |
|
Shadow of the Tomb Raider |
Built-in benchmark, 1080p, high detail setting, RTX/DLSS Off |
|
Metro Exodus |
Default benchmark with High profile which has 1080p and high detail |
|
Watch Dogs Legion |
Built in benchmark, 1080p, dx12, low detail |
|
Borderlands 3 |
Built-in benchmark. fullscreen, 1080p, medium quality, dx11 |
|
Power Usage |
Idle and load testing using a Kill-A-Watt and wPrime to put the CPU under load and again with the AIDA64 FPU CPU workload |
|
Temps |
Aida64 FPU stability test to load and record temperature readings |
|
AIDA64 |
Memory, Cache, and FLOPS testing done with built-in GPGPU and Memory benchmarks |
|
Onboard Testing Procedures |
|
|
3DMark |
Fire Strike and Time Spy benchmarks GPU score not the overall score |
|
Unigine Superposition |
720p Low and 1080p Medium settings |
|
Team Fortress 2 |
1080p – high, very high, high, reflect world, high, enabled, 8x msaa, x16, multicore on. https://bit.ly/2vOebin |
|
Tom Clancy's Ghost Recon: Wildlands |
Built-in Benchmark, 1080p, Low detail setting |
|
Tomb Raider |
Adrenaline Action Benchmark Tool on the “Medium” quality setting at 1080p |
|
Hitman: Absolution |
Adrenaline Action Benchmark Tool on the “Medium” quality setting at 1080p |
|
Borderlands 3 |
In-Game benchmark, 1080p, Low detail preset |
|
Far Cry 5 |
1080p, Lowest Detail setting, In game benchmark |
|
Shadow of the Tomb Raider |
1080p, Low Detail setting, In game benchmark, RTX/DLSS off |
CPU Performance
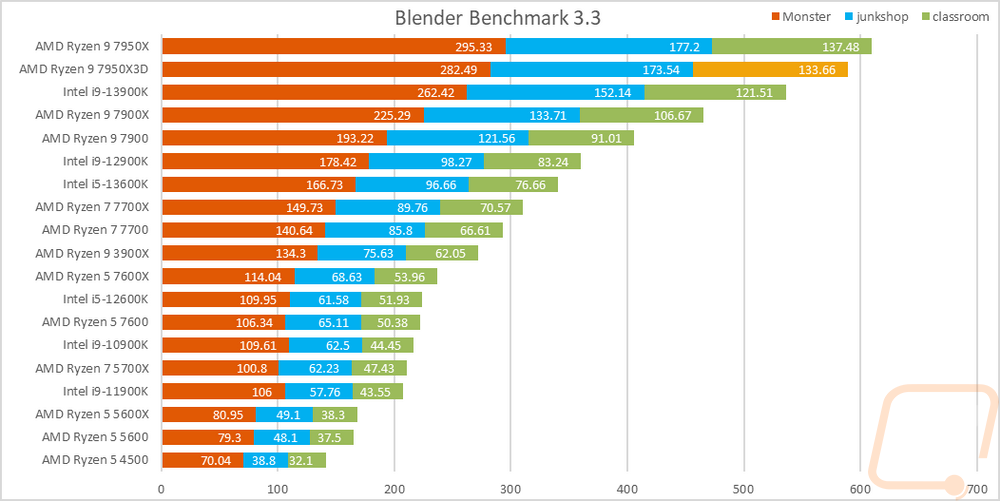
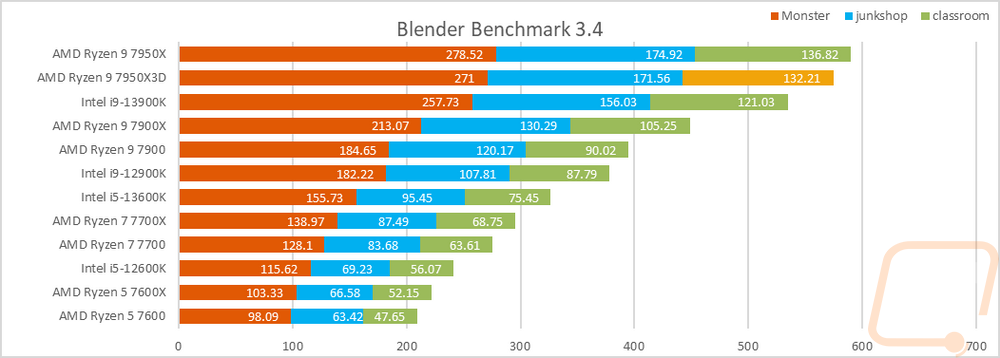
To start testing off I went with a rendering-focused benchmark with the always popular Blender. This benchmark was recently updated so our result list is smaller here. I have all three tests stacked together so we can see an overall of them altogether. Blender loves the higher core counts but clock speed does still make a difference and we can see that here with the 7950X3D coming in a little behind the original 7950X which has a higher base clock in both Blender 3.3 and 3.4. That said it Is still well ahead of the 13900K which is the next fastest CPU tested.
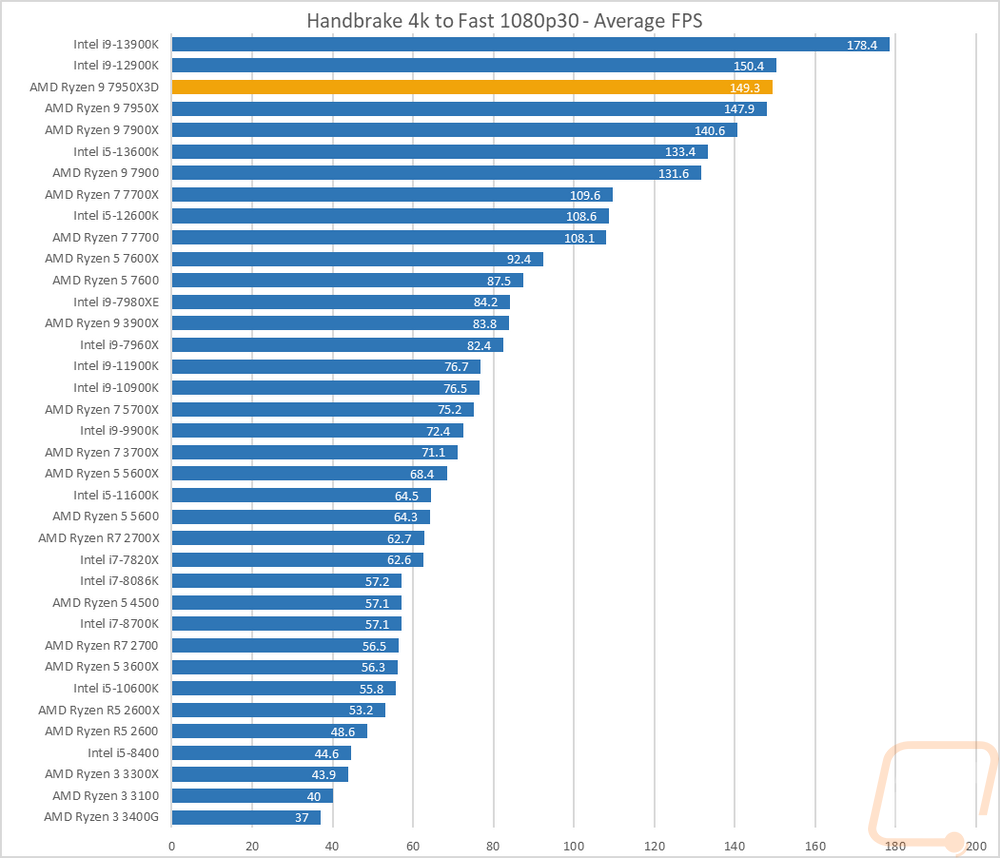
Continuing with the video encoding theme I also have Handbrake which is an open-source transcoder. For this test I am taking a 4k video down to 1080p 30 FPS, the results are the average FPS of that task. The Ryzen 9 7950X3D outperformed the 7950X here by almost 2 FPS. This was enough to get close to the 12900K but the 13900K is still way out in front in this test.
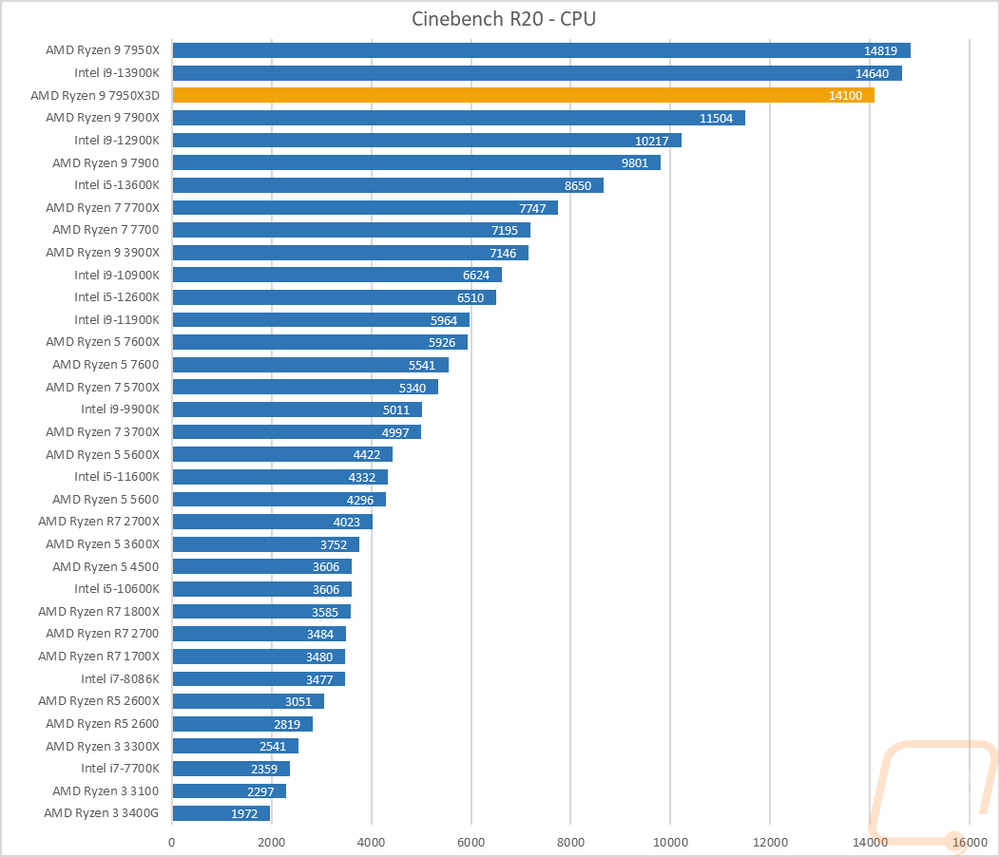
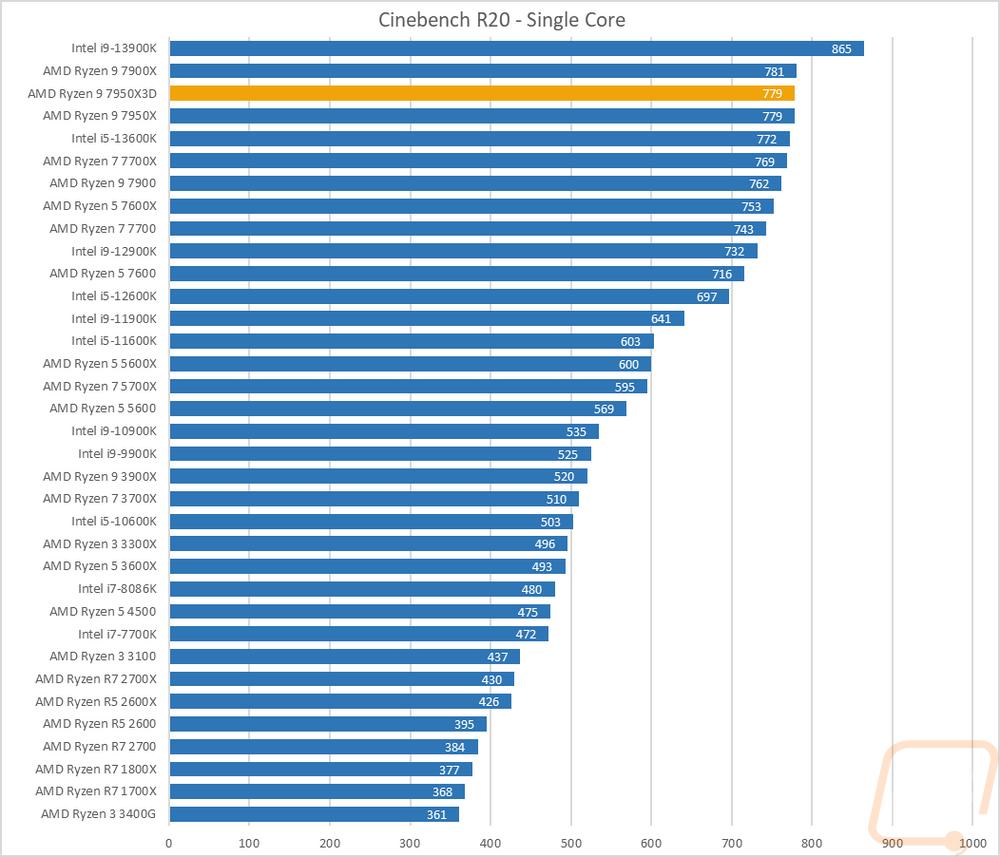
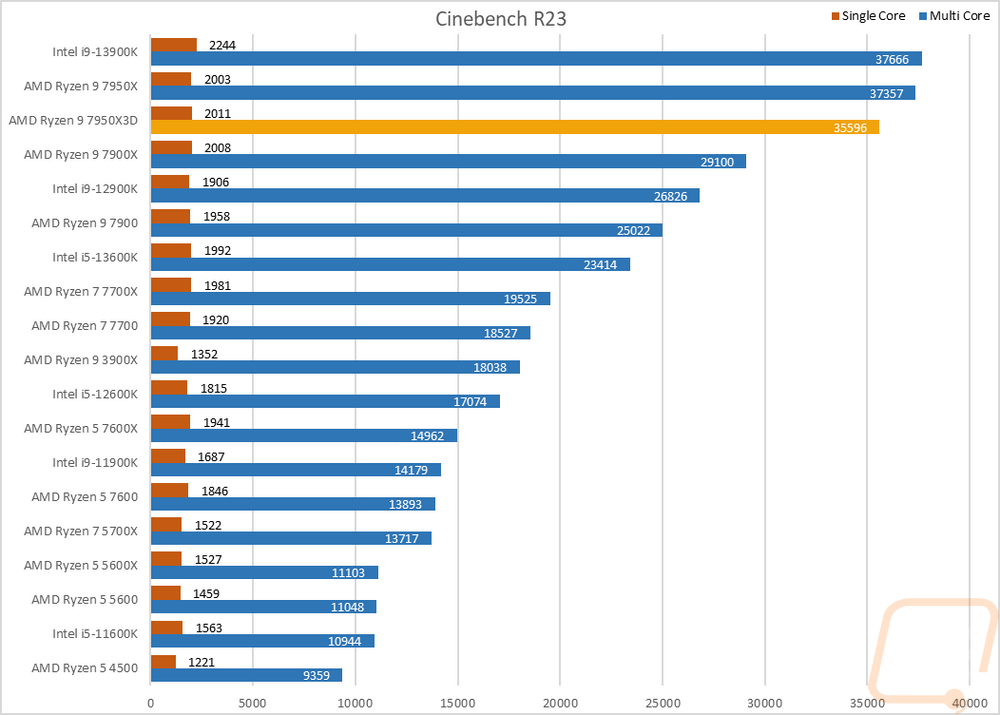
For the always popular Cinebench, I am testing with the current R23 and the slightly older Cinebench R20. I always like Cinebench because we have multi-core and single-core performance which gives us a good look at the performance of the whole CPU and IPC performance. In R20 on the multi-core test, the 7950X3D drops down below the 13900K in the multi-core test but did match the 7950X in the single-core result but is still well behind the 13900K with just one core. In Cinebench R23 the 13900K is still at the top but again we see the 7950X3D drop when compared to the 7950X, it does slightly improve in the single-core however.
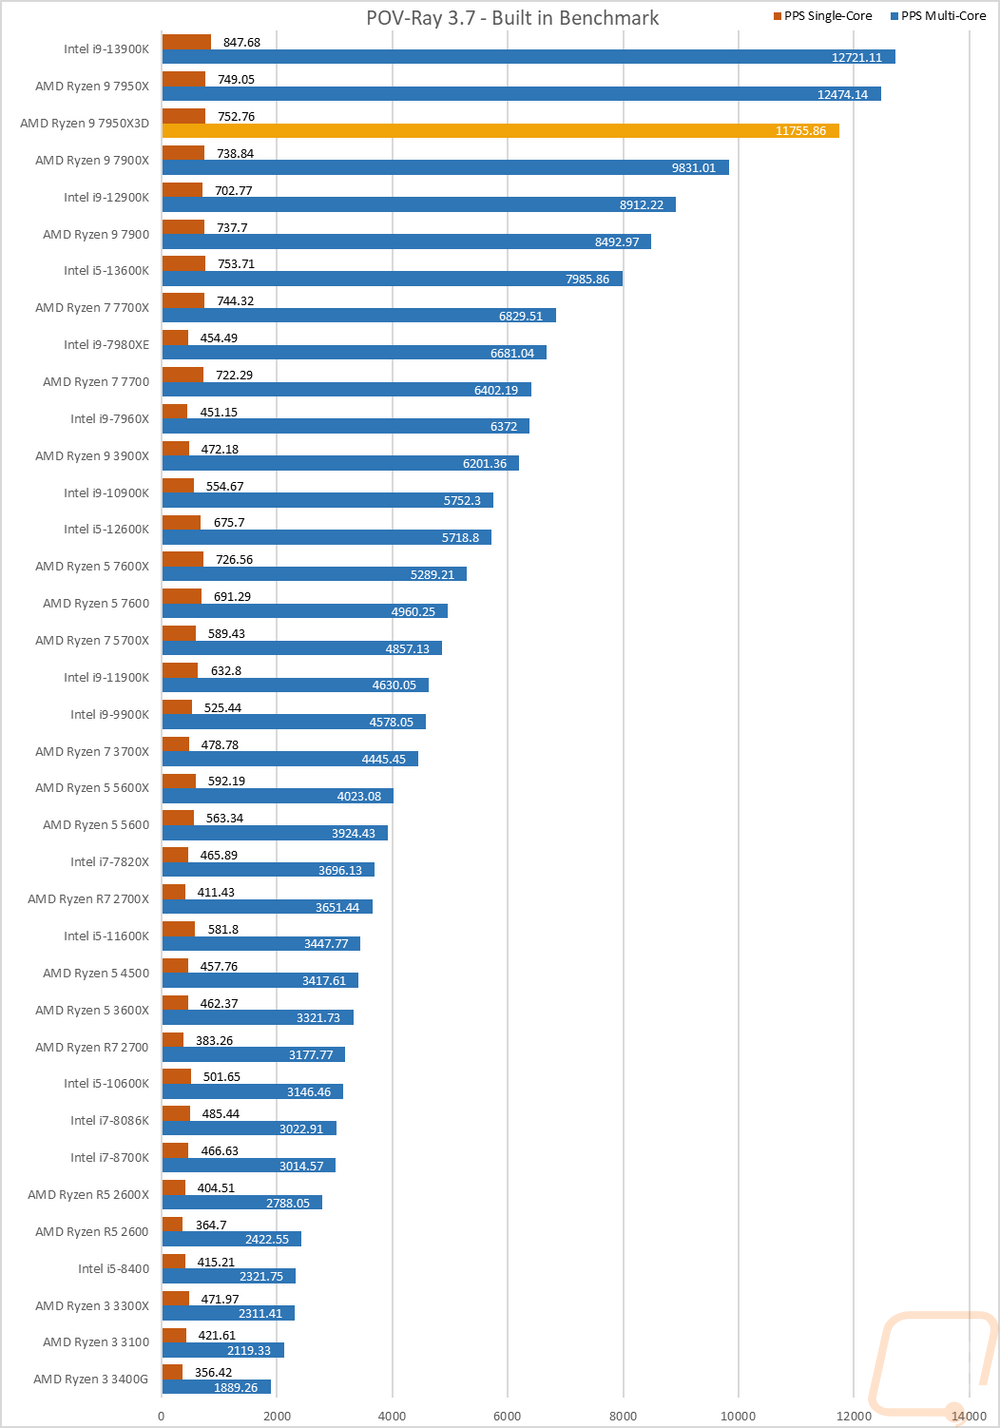
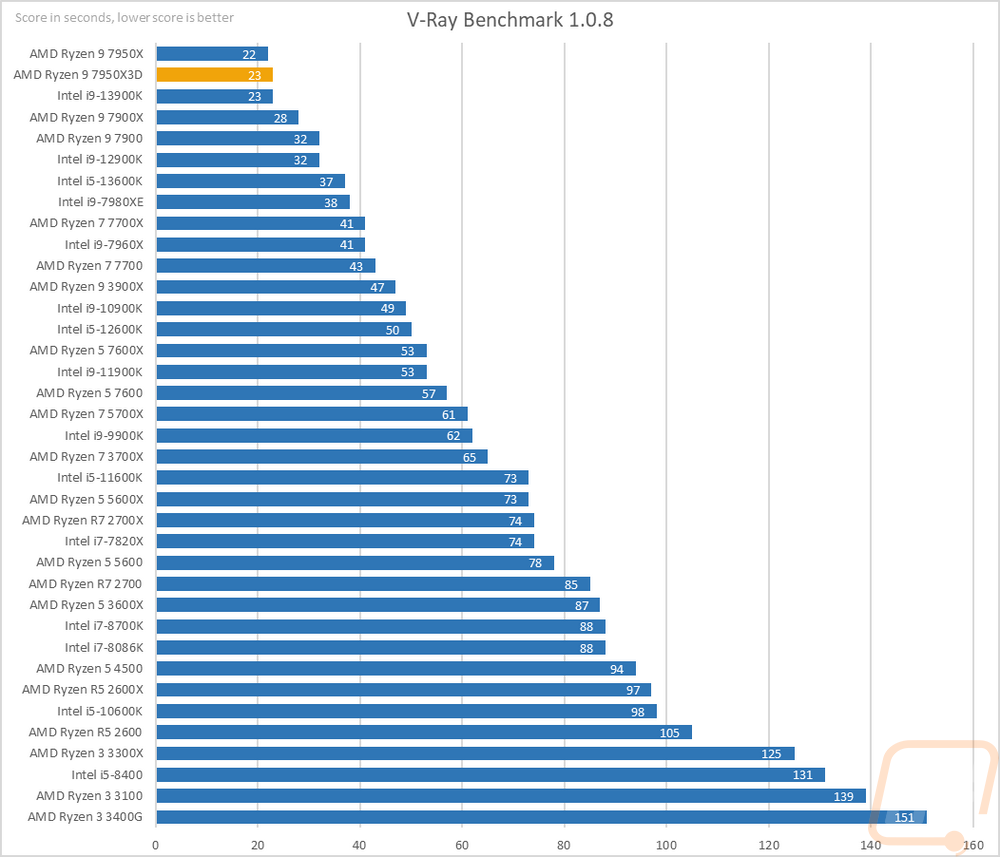
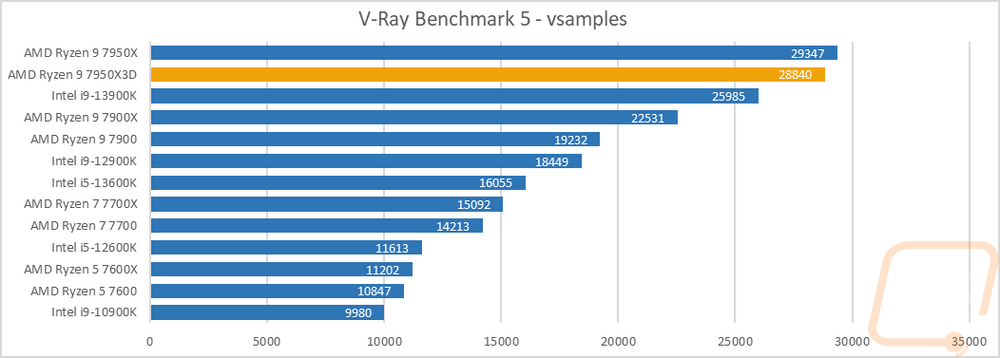
Next up we have ray tracing-focused rendering benchmarks. Here I tested the CPUs in POV-Ray and V-Ray including the newer V-Ray Benchmark 5. POV-Ray was also tested with a single core and across all of the cores. Like in Cinebench the 7950X3D does drop off in the POV=Ray multicore test with its lower base clock and 50-watt lower TDP but again the single-core performance improved slightly. In the older V-Ray, it dropped 1 second to now match the 13900K’s performance and in the newer V-Ray Benchmark 5 the performance did drop slightly from the 7950X but it is well ahead of the 13900K in that benchmark.
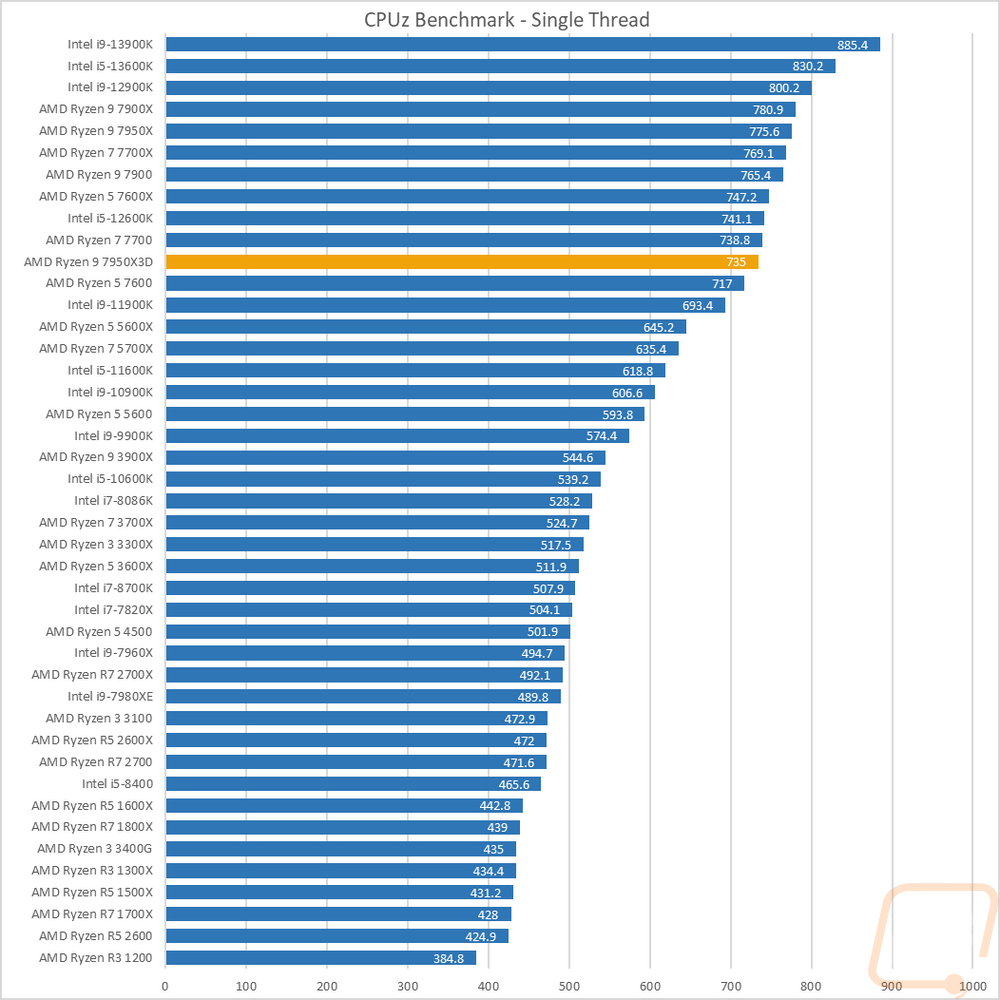
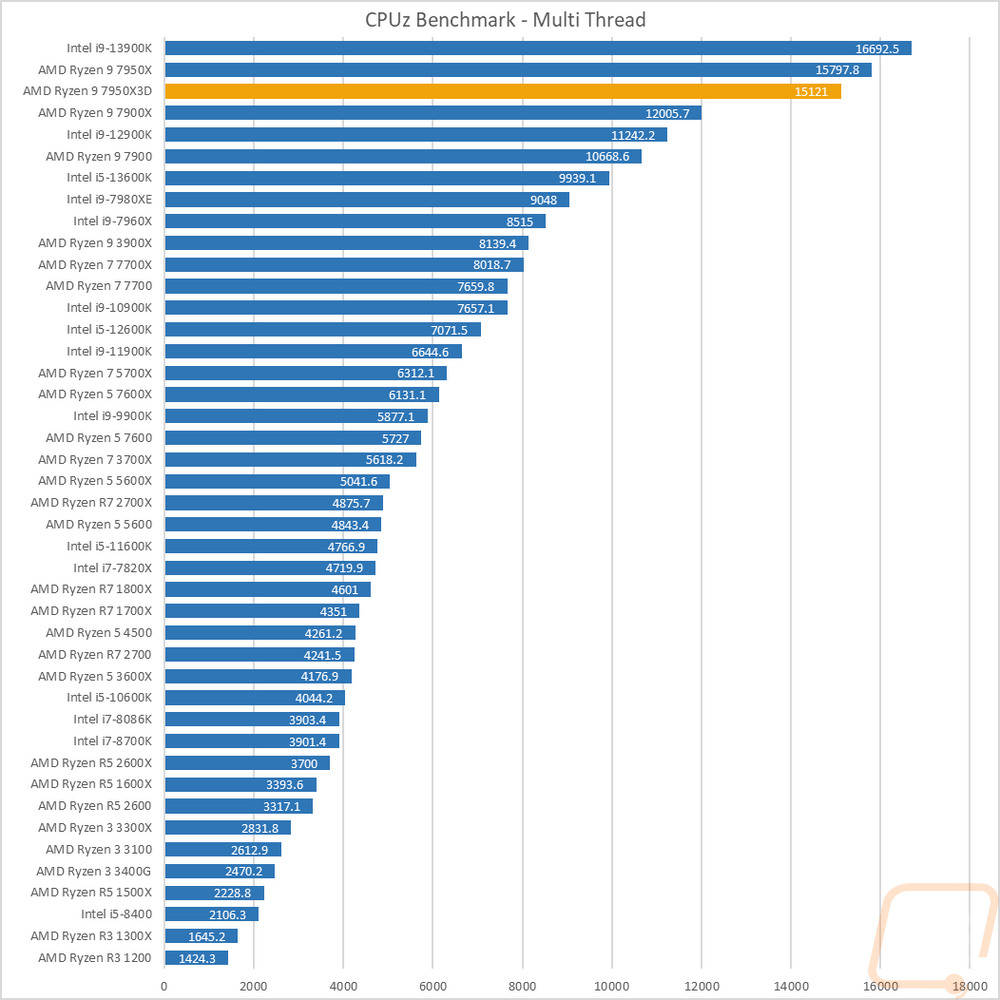
I also tested using the CPUz’s built-in benchmark which does run on a single thread and with all threads. In the multi-thread test, the 7950X3D has the same 16-core and 32-thread configuration that the 7950X has but in the multi-thread CPUz result we do still see the lower base clock and lower TDP making a difference with it sitting back slightly with a 4% performance drop. This still puts it WELL ahead of anything else other than the 13900K. The same drop can be seen in the single thread test as well which the 7950X3D drops down 5% which puts it down in the middle of the non-X 7000 Series CPUs.
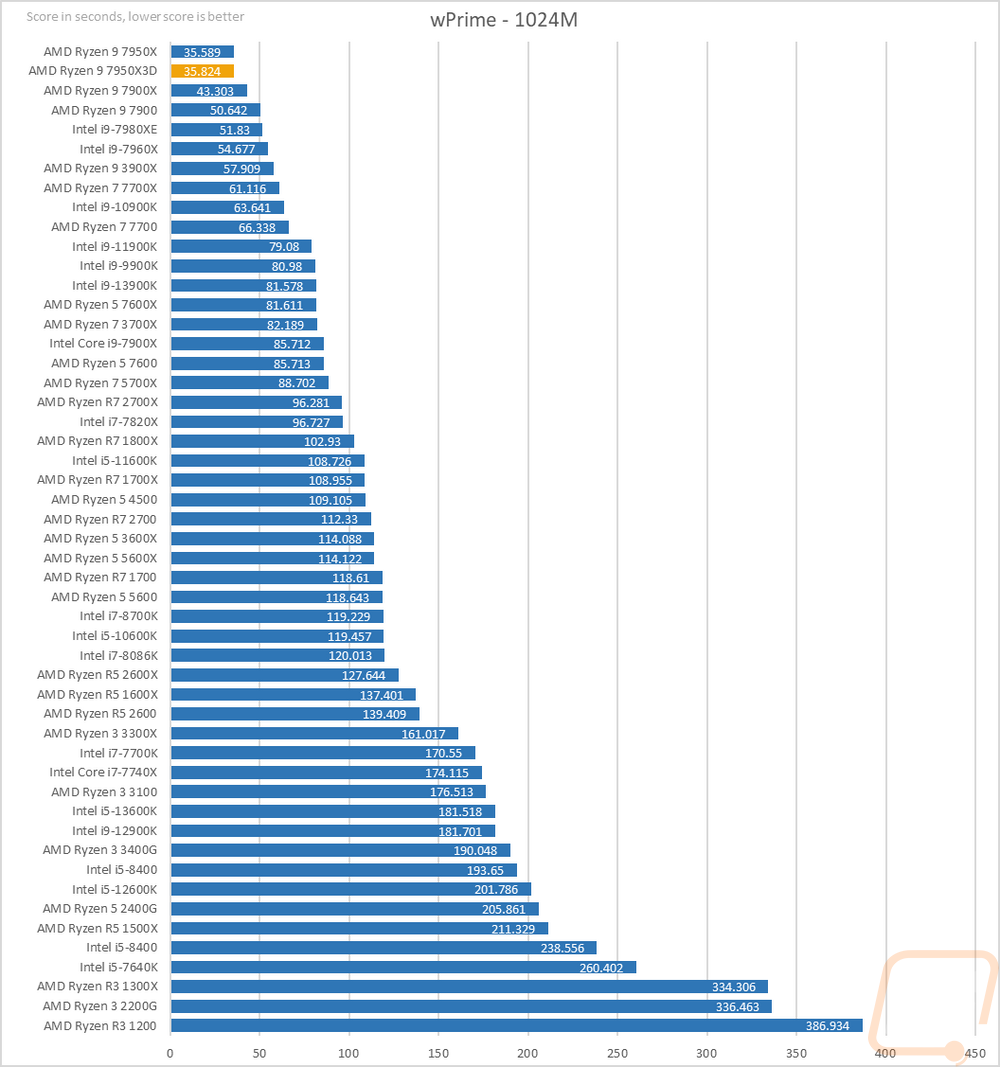
Next, we have wPrime which is a classic overclocking benchmark that calculates pi out to 1024 million digits and is timed. This is a multi-thread heavy test which has the older high core count CPUs still all over the top of the charts and the 7950X3D doesn’t change much from the 7950X in this test with both CPUs sitting together out in front of everything else tested.
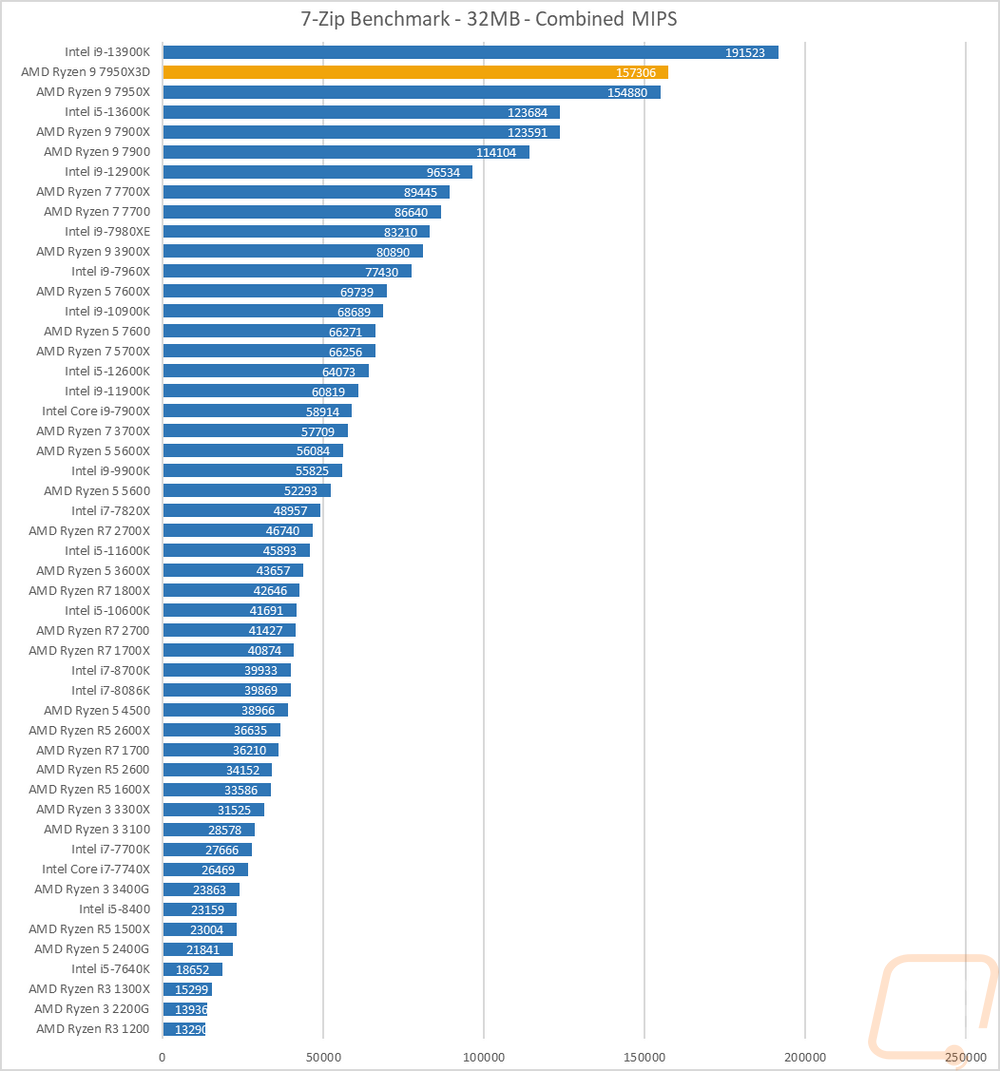
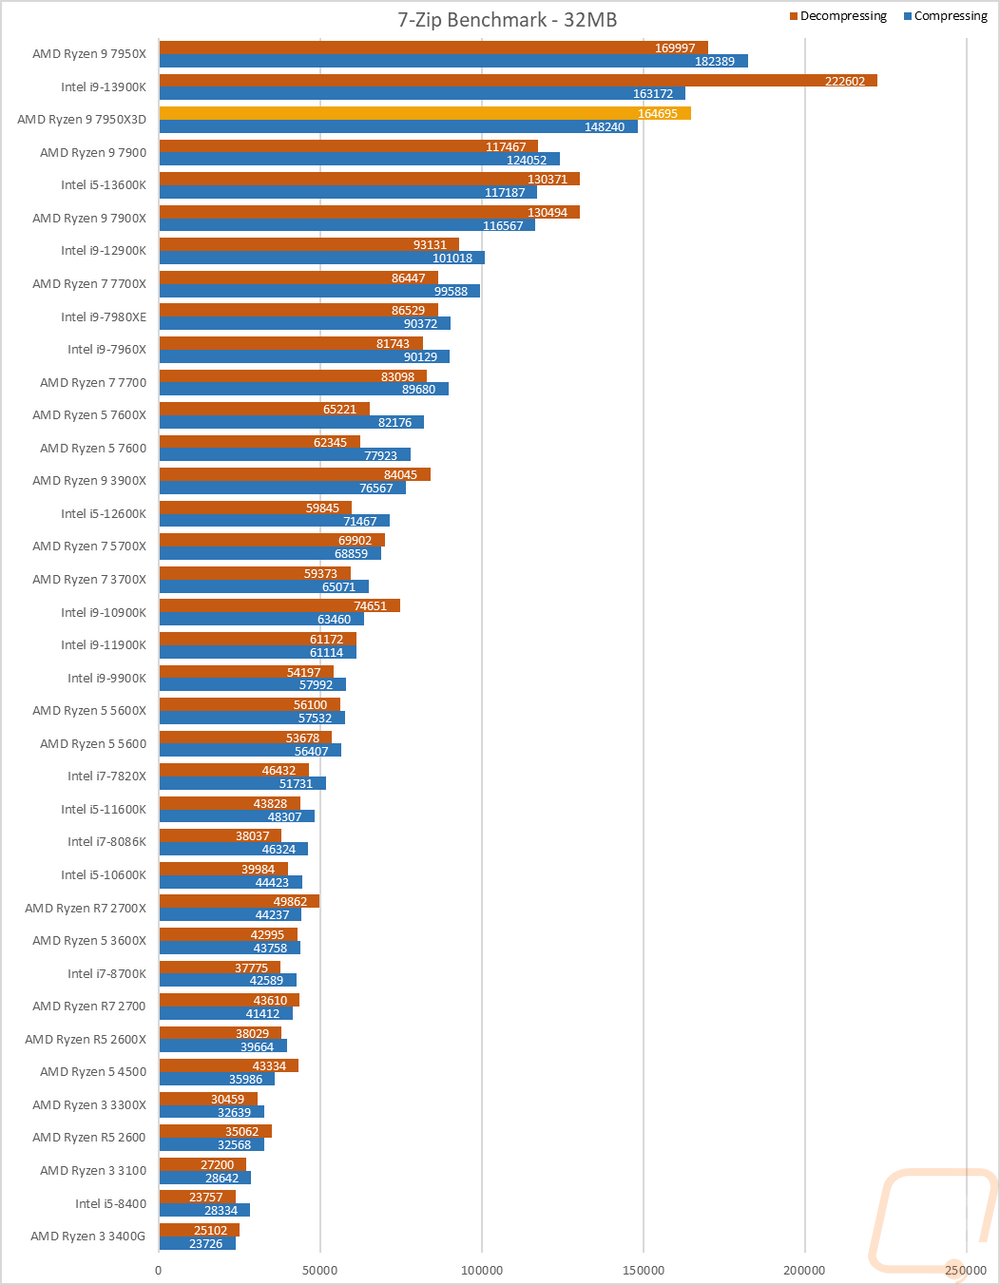
7 Zip is another open-source program, this time for compressing and decompressing all of your files. Here I have run the benchmark and we have three results. The combined MIPS is a combination of compressing and decompressing performance. Then I have it broken down between the two. The combined results have the 7950X3D showing an overall improvement in the combined MIPS results improving 1.5% over the 7950X but still well behind the 13900K. The split numbers show a different story however with both the decompressing and compressing numbers below the 7905X, especially on the compress numbers.
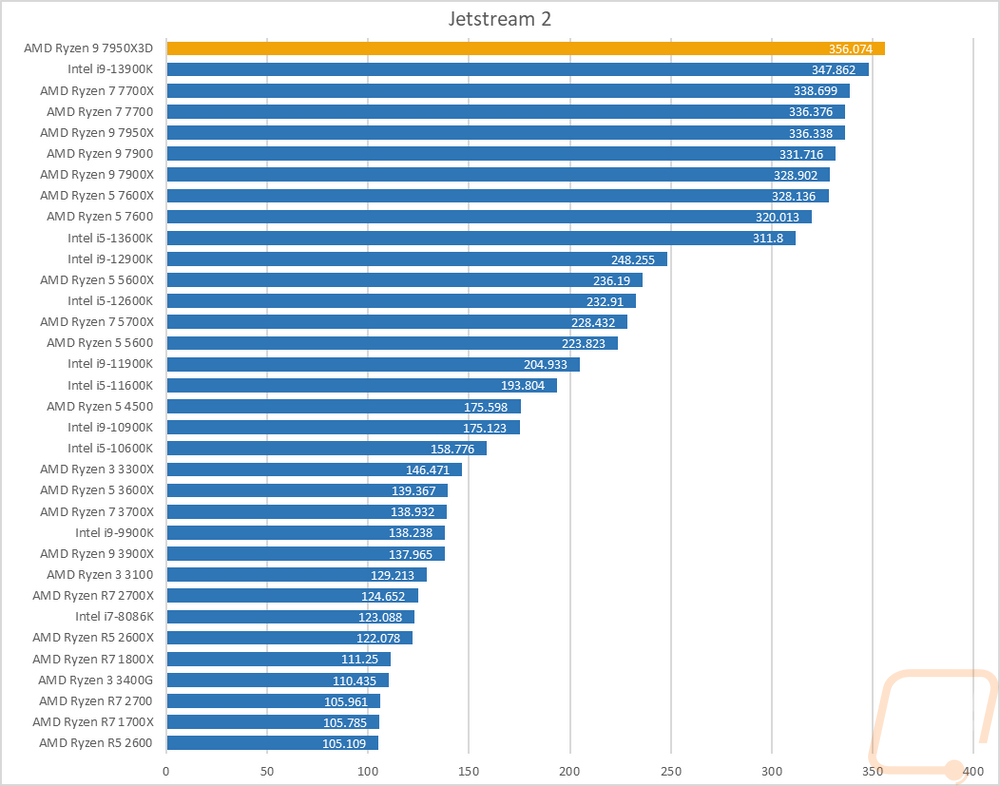
Jetstream 2 is a compilation benchmark that takes a long list of HTML5 and Java in-browser tests and runs them all three times and puts together an overall score. I love this benchmark because let's be honest, most people are using their browser more than any other game or program. Jetstream gives some interesting results sometimes though but it tends to prefer high IPC or single-core performance and there are some situations where it prefers lower core-count CPUs. This time around the Ryzen 9 7950X3D tops the chart and a 5.8% increase over the 7950X which was enough to even surpass the 13900K by a good margin.
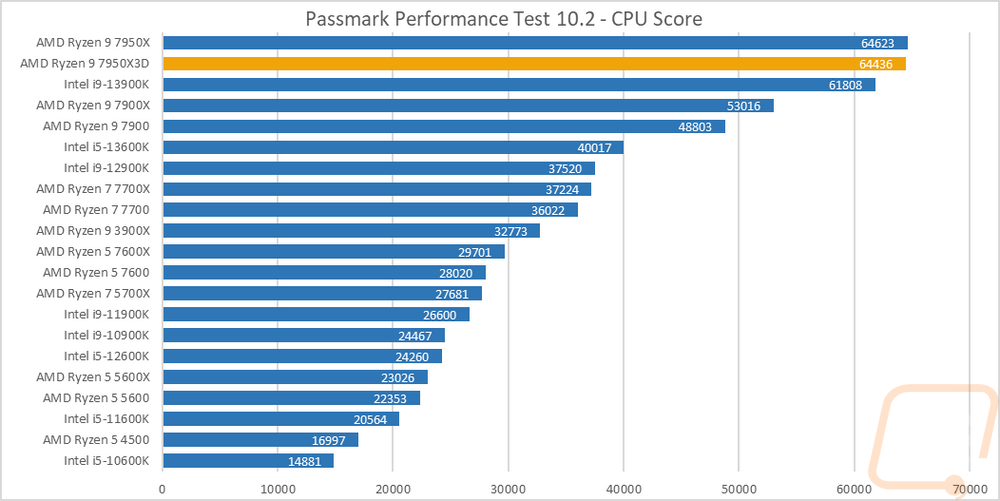
For Passmark Performance Test I used the latest version, Performance Test 10 I only look at the overall CPU score which takes a few different synthetic benchmarks and combines the results to put together an overall score. This is a test that does favor multi-threader performance over IPC and you can see that with the 7950 and the 7950X3D are eventually tied and sitting at the top of the chart out ahead of everything else from their raw core count and good IPC.
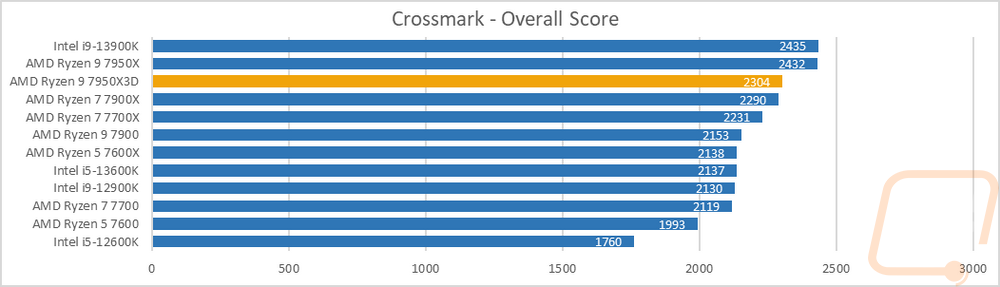
Crossmark is from BAPCo which also makes SYSmark and this is a cross-platform test where you can compare performance between phones and both windows and mac computers. This is the start of our overall PC benchmarks and Crossmark uses a mix of real-world tests to output an overall score. The Ryzen 9 7950X3D drops 5.2% compared with the 7950X which was also basically tied with the 13900K. This puts it just ahead of the 7900X.
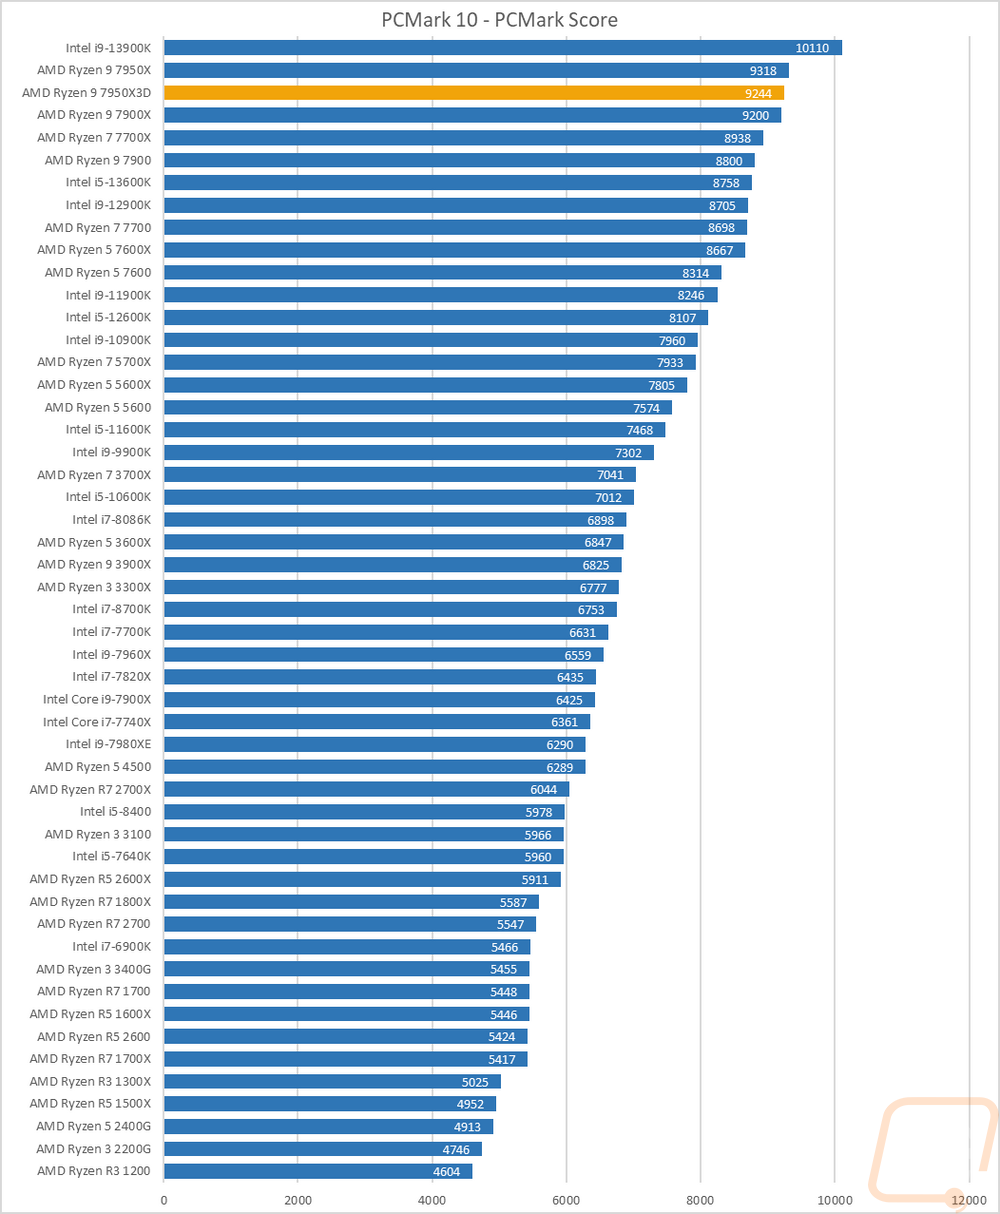
PCMark 10 is a great test because it tests things like video calls, browser performance, excel, and word performance to give an idea of real-world performance. It tends to like higher clock speeds but does take raw core count into account as well which you can see with the 7950X3D is a hair behind the 7950X with a .7% drop in performance between the two. This still keeps the 13900K well out in front and the 7900X isn’t far behind the 7950X3D.
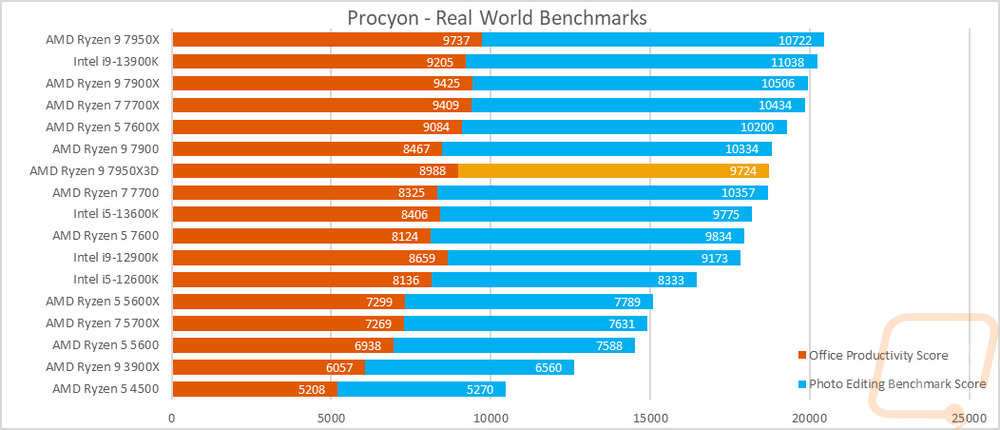
We recently added even more real-world testing with the UL Procyon Benchmarks which are as real-world as they can get using the actual programs that you would use in each test. There are two overall benchmarks, first is the Office Productivity Benchmark which uses Microsoft Office 365 to test actual performance in word, excel, PowerPoint, and outlook. The second benchmark is the Photo Editing Benchmark which is run using the latest version of Photoshop as well as Lightroom Classic to look at photo editing performance. I have both scores stacked together to get an overall look at the performance. The Ryzen 9 7950X3D results here are interesting because when combined the 7950X3D is in the middle of the chart with an 8.5% performance drop compared to the 7950X up at the top of the chart. The office productivity score however drops less at 7.6%.
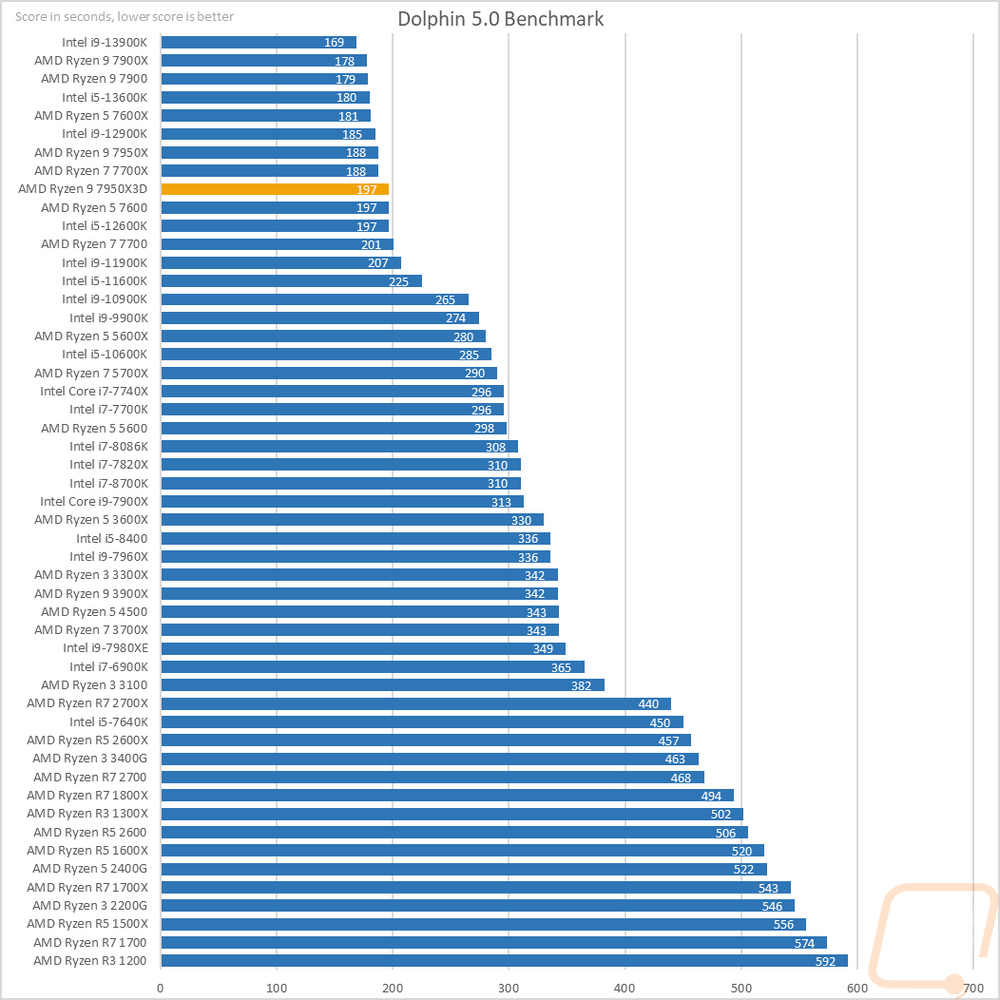
Moving the focus over towards gaming my next test is using Dolphin 5.0 Benchmark. Dolphin 5.0 is a Wii emulator and like most emulators, it doesn’t care about high core counts at all. In fact, it only runs two in total. Clock speeds are king here most of the time and the 7950X3D ties with the 7600 at 197 seconds for the test putting it 4.7% behind the original 7950X which struggled in this test as well when compared to CPUs like the 13900K and the 7900X.
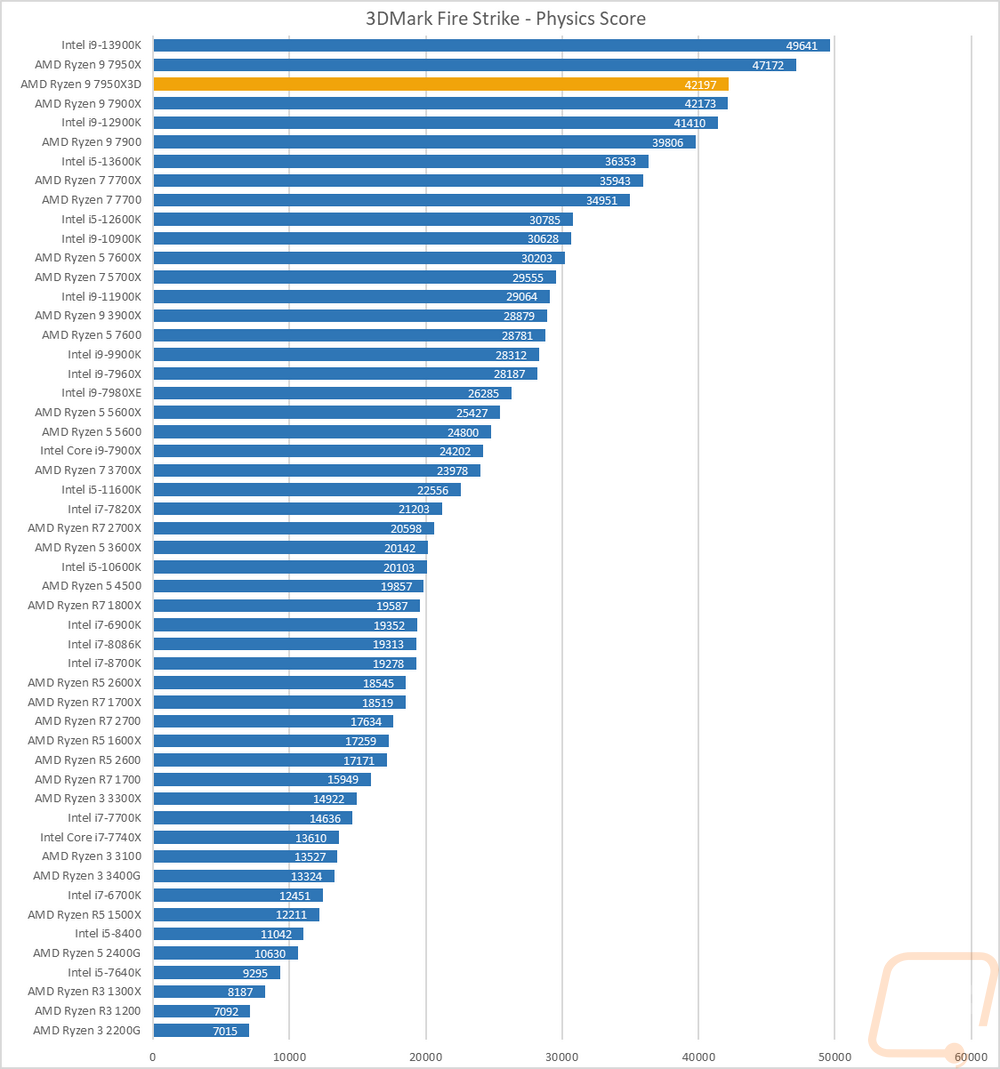
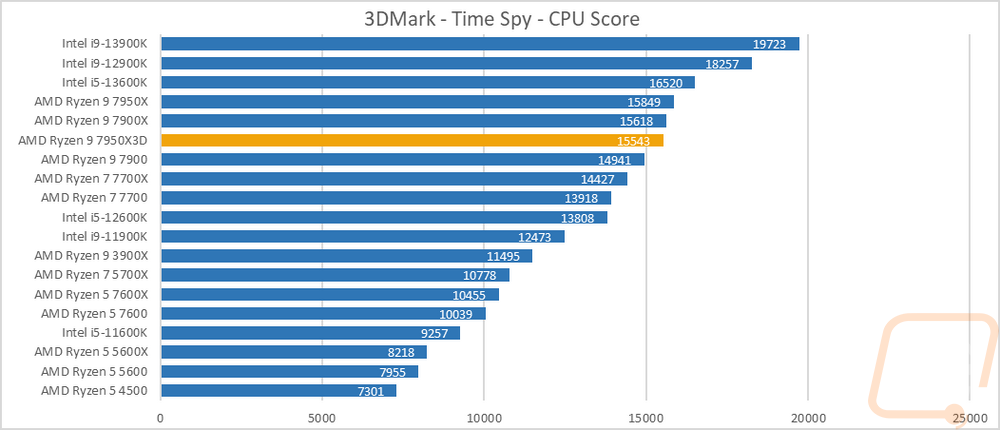
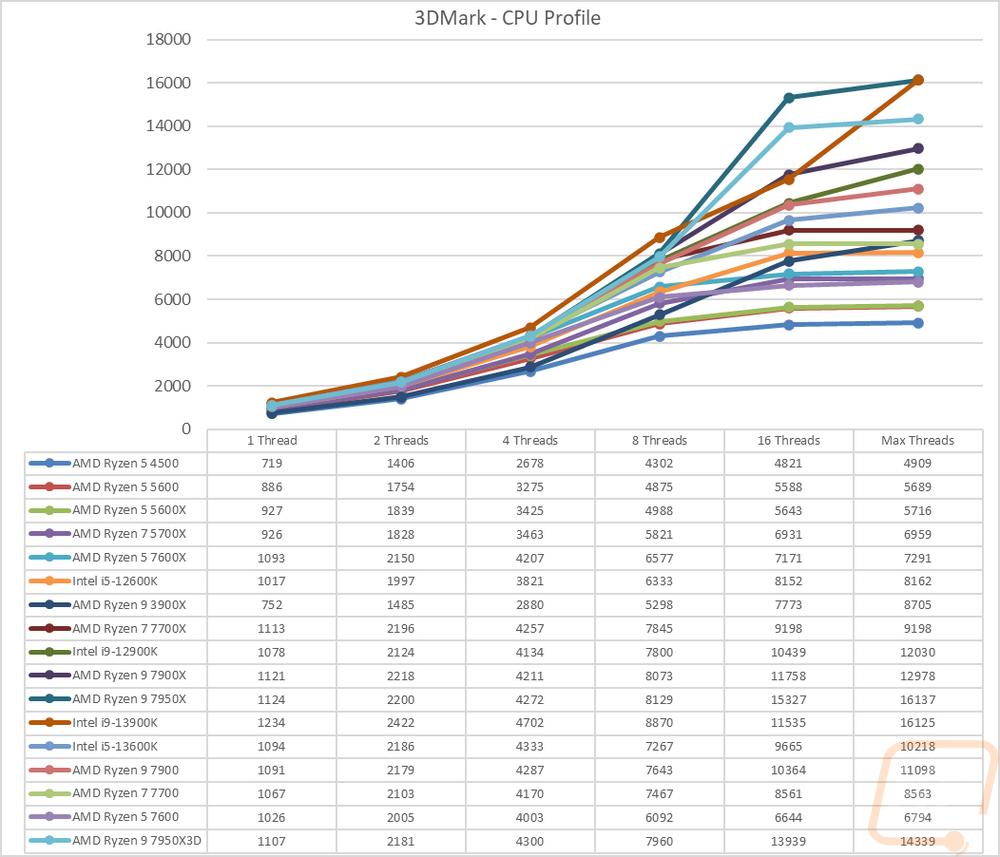
Before diving into game testing I wanted to check out synthetic performance using 3DMark. I tested with the older DX11 Fire Strike test as well as the newer DX12 Time Spy. I also added the new 3DMark CPU Profile benchmark into the mix as well which does a good job of showing the full range of thread counts that you might see being used in games as well as a max threads option that does everything above 16 threads. In the Fire Strike test, the 7950X dropped 10% in the Fire Strike compared to the 7950X putting in tied right with the 7900X. The drop was significantly smaller in Time Spy at just 1.9% but it was again right with the 7900X. Then in the CPU profile test, we see it once again 11% behind the 7950X in the max threads test, interestingly though when limited to 16 threads we see it running ahead of the 13900K.
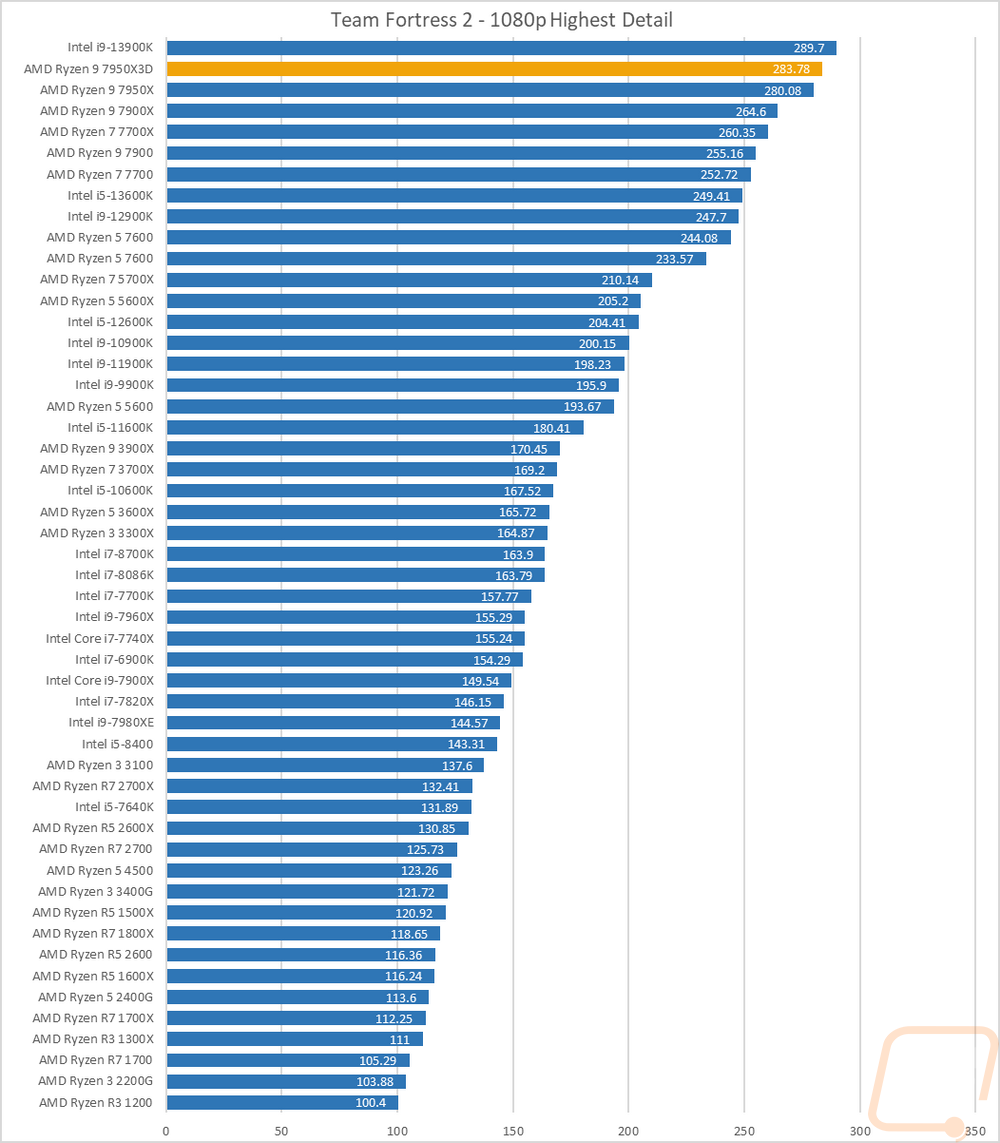
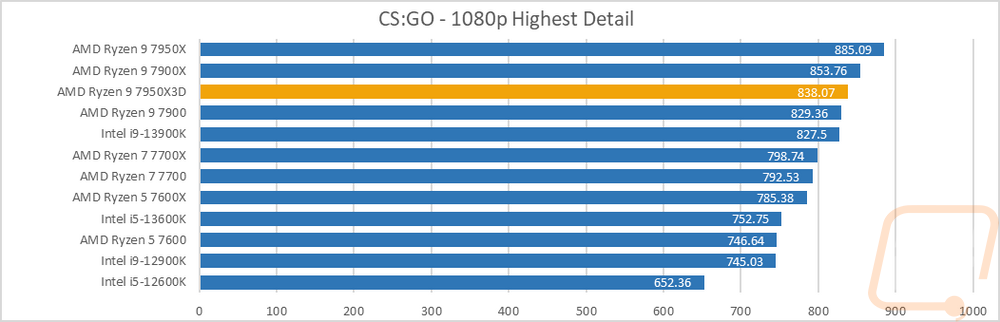
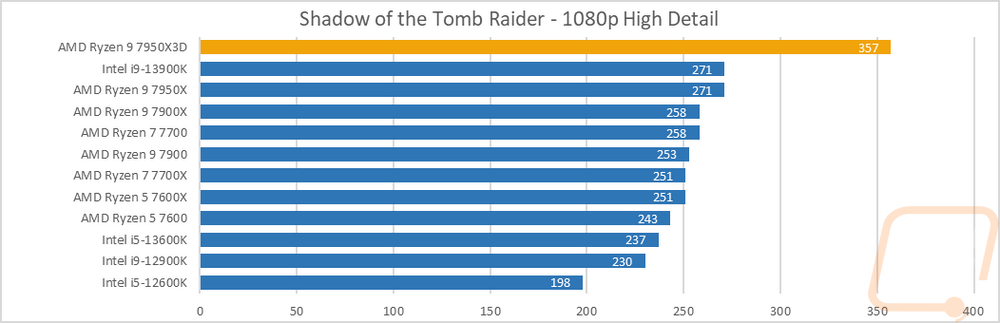
Of course, as most of you already know, where the 3d stacked cache shows itself the most is in a lot of games and I put the Ryzen 9 7950X3D as well as the rest of AMDs 7000 Series CPUs, Intel’s 13900K, 13600K, and the two 12000 Series CPUs as well all to the test in 9 different games. I used a mix of games with some being older classics and some newer games as well. Most are tested at mid-range detail settings and all were testing at 1080p which with the Nvidia RTX 4090 we know that puts everything at being CPU limited. The first two are older Valve titles with CS:GO still being one of the most played games on steam. TF2 also works out in that it has been extremely CPU limited for so long that after testing I could confirm that I could keep our older results into the mix to give us a window back farther back to the original Ryzen launch and back to Intel’s 7000 Series. In TF2 the 7950X3D improves on the 7950X’s performance by 1.3% but it still wasn’t enough to catch up to the 130900K. Looking back to the original Ryzen launch though we see the 7950X3D has more than doubled the performance of the original Ryzen flagship 1800X at 139% improvement. CS:GO interestingly the cache on the 7950X3D didn’t help with it sitting 5.3% behind the 7950X but still out in front of the 13900K.
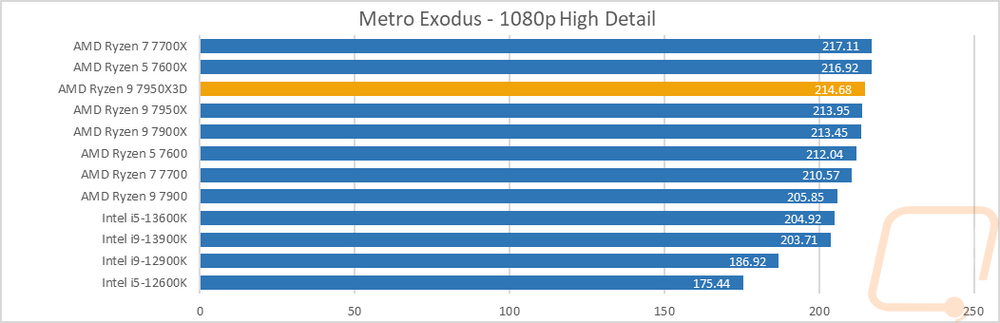
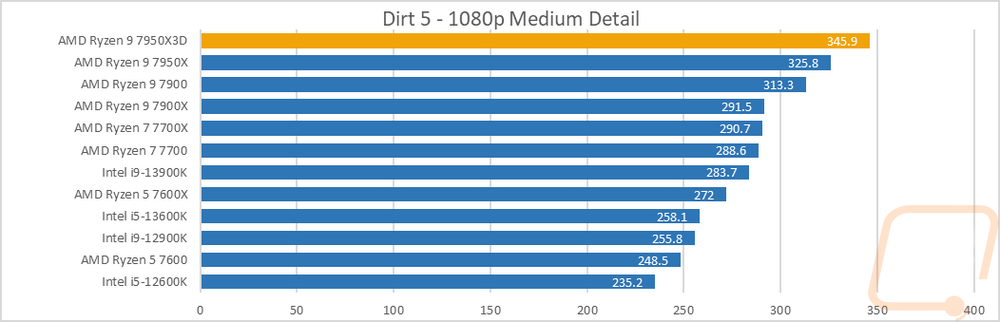
Metro Exodus was another where we didn’t see a big improvement but there was a small improvement of .3%. This is also a game where the lower core count CPUs did better with the 770X and 7600X out in front. In Dirt 5 the 7950X improved on the 7950X’s score by 6.1% as well which is a nice improvement.
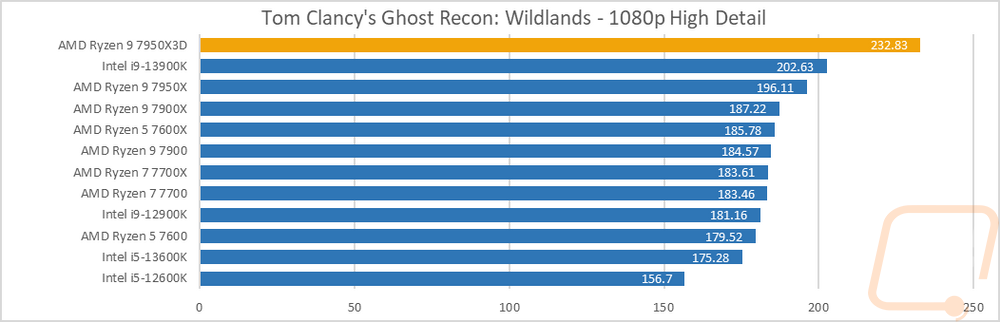
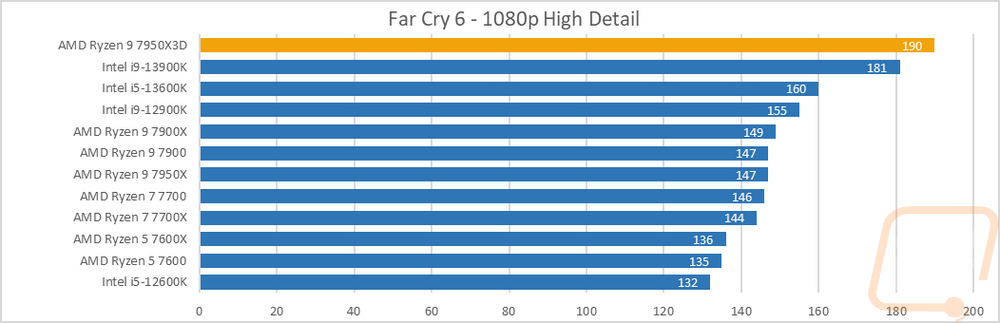
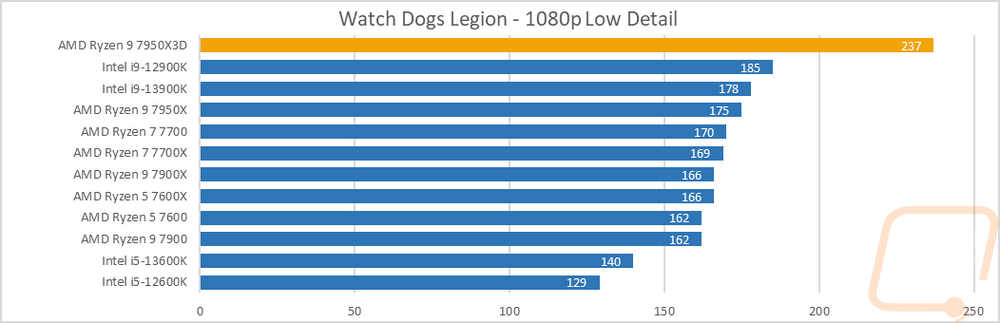
The other five games I tested all saw huge performance improvements, so much so that I spent more time than I would like to admit retesting everything over and over to confirm. Ghost Recon Wildlands for example the 7950X3D jumped 18.7% which not only pushed it past the 13900K but well beyond. Far Cry 6 was another big one at 29% moving it from behind multiple Intel CPUs up to the top of the chart. Watch Dogs Legion and Borderlands were similar as well. I should really point out though that all of these benchmarks other than TF2 and CS:GO are running at lower settings than they could be and all of the games were tested at 1080p whereas if you were running an RTX 4090 like this you would be wasting its performance by not using it at 4K. In other words, these tests were done at resolutions and detail settings that would show the performance gap between CPUs more. Gaming at detail and resolutions that match the hardware would still show a performance gap but it would be much much smaller.

The AIDA64 cache tests show an improvement all across the board compared to the 7950X and not just on the L3 cache. The same goes for how the 7950X3D handles its memory with that performing better as well which may be from AGESA refinements from the launch until now. The single and double precision performance has dropped slightly as has the AES-256 processing.
|
AIDA64 |
L1 Cache Read |
L1 Cache Write |
L1 Cache Latency |
L2 Cache Read |
L2 Cache Write |
L2 Cache Latency |
L3 Cache Read |
L3 Cache Write |
L3 Cache Latency |
|
|
GB/s |
GB/s |
ns |
GB/s |
GB/s |
ns |
GB/s |
GB/s |
ns |
|
AMD Ryzen R7 2700X |
999.43 |
502.5 |
1 |
978.03 |
495.12 |
2.8 |
414.95 |
417.71 |
8.8 |
|
AMD Ryzen R5 2600X |
768.13 |
388.05 |
1 |
729.37 |
366.01 |
2.9 |
429.09 |
323.83 |
9.1 |
|
Ryzen 5 2400G |
485.01 |
238.29 |
1 |
459.8 |
232.2 |
3.1 |
222.96 |
181.6 |
9.6 |
|
Ryzen 3 2200G |
460.55 |
227.41 |
1.1 |
352.84 |
177.56 |
3.3 |
137.3 |
171.2 |
10.2 |
|
Intel i7-8700K |
1595.6 |
803.65 |
0.9 |
640.37 |
397.14 |
2.6 |
337 |
213.67 |
11 |
|
Intel i5-8400 |
1417.2 |
710.79 |
1 |
543.81 |
352.9 |
3.1 |
270.89 |
186.82 |
13 |
|
Intel Core i9-7980XE |
3758.3 |
1896.7 |
1.1 |
1671.7 |
1069.9 |
5.6 |
229.61 |
118.4 |
21 |
|
Intel Core i9-7960X |
3532.3 |
1785.2 |
1 |
1571.6 |
1003.5 |
5.1 |
220.22 |
121.04 |
19.8 |
|
Intel Core i7-7820X |
1969.9 |
995.02 |
1 |
884.63 |
574.74 |
5.6 |
114.4 |
103.57 |
19.2 |
|
Intel Core i5-7640X |
1044.8 |
31888 |
1 |
397.26 |
247 |
2.9 |
228.31 |
163.86 |
11.1 |
|
Intel Core i9-7900X |
2418.5 |
709.16 |
1 |
1037.3 |
521.94 |
5.2 |
124.16 |
106.78 |
21.2 |
|
Intel Core i7-7740X |
1102.7 |
561.25 |
0.9 |
424.55 |
304.3 |
2.7 |
287.01 |
186.67 |
21.2 |
|
Intel i7-6900K |
1963.9 |
999.59 |
1 |
710.28 |
310.34 |
4.1 |
243.96 |
195.41 |
14.6 |
|
Intel i7-7700K |
1114.6 |
560.82 |
0.9 |
415.45 |
285.97 |
2.7 |
234.5 |
188.7 |
10.4 |
|
Intel i7-5960X |
1748.5 |
874.6 |
1.2 |
623.08 |
272.77 |
3.5 |
260.72 |
184.92 |
15.3 |
|
AMD Ryzen R7 1800X |
917.46 |
460.16 |
1.1 |
831.95 |
446.37 |
4.7 |
388.18 |
386.01 |
12.4 |
|
AMD Ryzen R7 1700X |
867.89 |
435.33 |
1.2 |
809.29 |
419.38 |
5 |
369.75 |
350.31 |
12.9 |
|
AMD Ryzen R7 1700 |
793.9 |
398.12 |
1.3 |
742.92 |
389.73 |
5.4 |
334.36 |
332.12 |
14.2 |
|
AMD Ryzen R5 1600X |
689.47 |
345.95 |
1.1 |
630.99 |
334.93 |
4.7 |
386.48 |
326.86 |
12.3 |
|
AMD Ryzen R5 1500X |
446.84 |
224.01 |
1.1 |
306.82 |
211.58 |
11.8 |
306.82 |
211.58 |
11.8 |
|
AMD Ryzen R5 2600 |
685.38 |
344.05 |
1 |
669.28 |
333.5 |
3.1 |
381.16 |
320.56 |
9.8 |
|
AMD Ryzen R7 2700X |
849.91 |
426.09 |
1 |
837.76 |
418.75 |
3 |
357.51 |
356.71 |
9.4 |
|
Intel i7-8086K |
1596.4 |
803.56 |
0.9 |
623.36 |
423.53 |
2.6 |
380.04 |
243.73 |
10.9 |
|
Intel i9-9900K |
2375.6 |
1195.4 |
0.8 |
907.65 |
626.34 |
2.4 |
302.01 |
221.1 |
11 |
|
AMD Ryzen 9 3900X |
3098.6 |
1551.4 |
0.9 |
1545.3 |
1416.8 |
2.8 |
1014.4 |
836.39 |
11.5 |
|
AMD Ryzen 7 3700X |
2133.2 |
1072.9 |
0.9 |
1069.1 |
993.49 |
2.8 |
611.53 |
573.21 |
10.2 |
|
AMD Ryzen 5 3600X |
1547.4 |
779.24 |
1 |
777.62 |
745.3 |
2.8 |
584.93 |
538.45 |
10.4 |
|
AMD Ryzen 3 3400G |
508.97 |
253.87 |
1 |
490.26 |
247.04 |
3 |
233.57 |
193.62 |
9.3 |
|
AMD Ryzen 3 3300X |
1080.5 |
541.5 |
0.9 |
541.84 |
530.5 |
2.7 |
322.13 |
321.33 |
11.1 |
|
AMD Ryzen 3 3100 |
965.85 |
484.67 |
1 |
485.55 |
460.71 |
3.1 |
374.11 |
343.53 |
11.8 |
|
Intel i5-10600K |
1676.6 |
840.87 |
0.8 |
662.98 |
452.67 |
2.5 |
361.35 |
238.47 |
10.5 |
|
Intel i9-10900K |
3162.1 |
1586.7 |
0.8 |
1201.8 |
759.97 |
2.4 |
407.66 |
245.94 |
11.4 |
|
AMD Ryzen 5 5600X |
1721.4 |
869.69 |
0.9 |
851.89 |
831.97 |
2.6 |
276.24 |
298.84 |
11 |
|
Intel i9-11900K |
4542.8 |
2299.3 |
1 |
1413.2 |
691.62 |
2.5 |
330.32 |
213.28 |
11.4 |
|
Intel i5-11600K |
3412.3 |
1724.9 |
1 |
960.91 |
526.76 |
2.7 |
319.1 |
198.57 |
11.4 |
|
Intel i9-12900K |
2310 |
1438.7 |
1 |
1233.5 |
562.72 |
2.9 |
678.84 |
418.11 |
19.8 |
|
Intel i5-12600K |
1461.1 |
971.78 |
1.1 |
846.4 |
360.51 |
3.2 |
598.86 |
292.09 |
21.4 |
|
AMD Ryzen 5 4500 |
1561.9 |
784.1 |
1 |
785.34 |
751.61 |
2.9 |
350.05 |
571.19 |
10.5 |
|
AMD Ryzen 5 5600 |
1646.6 |
831.24 |
0.9 |
832.43 |
767.22 |
2.7 |
445.8 |
437.73 |
11.9 |
|
AMD Ryzen 7 5700X |
2267.8 |
1157.8 |
0.9 |
1147.6 |
1026.1 |
2.6 |
501.53 |
526.11 |
11.5 |
|
AMD Ryzen 7 7700X |
2722.9 |
1381 |
0.7 |
1361.1 |
1305.1 |
2.7 |
887.95 |
901.2 |
10.1 |
|
AMD Ryzen 5 7600X |
1996.3 |
1019.3 |
0.7 |
1020.9 |
999.93 |
2.6 |
847.43 |
847.61 |
10.5 |
|
AMD Ryzen 9 7950X |
5252.2 |
2685 |
0.7 |
2615.6 |
2588.4 |
2.6 |
1293.7 |
1357.3 |
9.9 |
|
AMD Ryzen 9 7900X |
4042.4 |
2051.4 |
0.7 |
2008.5 |
1956.3 |
2.5 |
1278.6 |
1394.1 |
9.8 |
|
Intel i9-13900K |
2005.7 |
872.39 |
0.9 |
2280.2 |
851.63 |
3.7 |
1729.2 |
619.38 |
18.3 |
|
Intel i5-13600K |
3218.4 |
1472.5 |
1.1 |
1156 |
479.87 |
4.5 |
907.63 |
406.76 |
14.9 |
|
AMD Ryzen 9 7900 |
3839.2 |
2023.6 |
0.7 |
1925.5 |
1865.1 |
2.7 |
1146 |
1046.4 |
10.3 |
|
AMD Ryzen 7 7700 |
2630.8 |
1333.7 |
0.8 |
1336.2 |
1298.2 |
2.9 |
826.97 |
879.08 |
10.4 |
|
AMD Ryzen 5 7600 |
1898 |
963.23 |
0.8 |
964.63 |
946.49 |
2.9 |
698.77 |
690.84 |
10.8 |
|
AMD Ryzen 9 7950X3D |
4734.9 |
2518.4 |
0.8 |
2558.7 |
2422.3 |
2.7 |
1314.4 |
1376.8 |
12.5 |
|
AIDA64 |
Memory Read |
Memory Write |
Memory Latency |
Single-Precision FLOPS |
Double Precision FLOPS |
AES-256 |
24-bit Integer IOPS |
32-bit Integer IOPS |
64-bit Integer IOPS |
|
|
MB/s |
MB/s |
ns |
GFLOPS |
GFLOPS |
MB/s |
GIOPS |
GIOPS |
GIOPS |
|
AMD Ryzen R7 2700X |
50214 |
48578 |
65 |
507.9 |
253.9 |
70514 |
127.7 |
127.7 |
64.22 |
|
AMD Ryzen R5 2600X |
50273 |
48346 |
65.5 |
383.2 |
191.4 |
51932 |
95.82 |
95.82 |
48.15 |
|
Ryzen 5 2400G |
45967 |
47850 |
66.6 |
235.9 |
117.8 |
32388 |
58.94 |
58.98 |
29.67 |
|
Ryzen 3 2200G |
35567 |
36240 |
118.4 |
225.8 |
112.6 |
27603 |
56.32 |
56.32 |
28.3 |
|
Intel i7-8700K |
38421 |
40175 |
57.9 |
825 |
412.5 |
29406 |
370 |
370 |
51.55 |
|
Intel i5-8400 |
38096 |
40549 |
59.8 |
728.8 |
364.5 |
25192 |
323.5 |
323.5 |
45.55 |
|
Intel Core i9-7980XE |
77004 |
68888 |
73.4 |
1831 |
915.5 |
69377 |
821.2 |
821.3 |
121.6 |
|
Intel Core i9-7960X |
79416 |
71554 |
74.9 |
1681 |
840.6 |
65409 |
754 |
753.9 |
114.7 |
|
Intel Core i7-7820X |
76049 |
73759 |
71.6 |
944.9 |
472.5 |
36420 |
423.7 |
423.7 |
63.85 |
|
Intel Core i5-7640X |
30786 |
31888 |
68.5 |
536.5 |
268.2 |
18547 |
238.1 |
138.1 |
33.53 |
|
Intel Core i9-7900X |
76856 |
72856 |
72.8 |
1148 |
574.5 |
45506 |
515.1 |
515 |
79.76 |
|
Intel Core i7-7740X |
38455 |
40596 |
53.2 |
575.4 |
287.8 |
20503 |
258.1 |
258 |
35.97 |
|
Intel i7-6900K |
66786 |
68130 |
61.9 |
1023 |
511.7 |
36340 |
255.9 |
255.9 |
63.96 |
|
Intel i7-7700K |
38498 |
40448 |
52.7 |
575.7 |
287.9 |
20519 |
258 |
258 |
35.98 |
|
Intel i7-5960X |
66108 |
49545 |
62.8 |
895.5 |
447.7 |
31783 |
223.9 |
223.9 |
55.97 |
|
AMD Ryzen R7 1800X |
44031 |
43425 |
81.8 |
472.4 |
236.2 |
64016 |
118.1 |
118.1 |
59.03 |
|
AMD Ryzen R7 1700X |
44493 |
43749 |
78.3 |
446.8 |
223.4 |
61730 |
111.7 |
111.7 |
55.84 |
|
AMD Ryzen R7 1700 |
45343 |
43777 |
82.6 |
408.5 |
204.3 |
56811 |
102.1 |
102.1 |
51.05 |
|
AMD Ryzen R5 1600X |
44452 |
43918 |
83.7 |
354.9 |
177.5 |
49340 |
88.74 |
88.73 |
44.34 |
|
AMD Ryzen R5 1500X |
44289 |
43746 |
83.1 |
229.8 |
114.8 |
31983 |
57.43 |
57.45 |
28.72 |
|
AMD Ryzen R5 2600 |
50385 |
48499 |
66.5 |
351 |
175.4 |
48939 |
88.03 |
88.02 |
44.01 |
|
AMD Ryzen R7 2700 |
50088 |
48343 |
65.9 |
434.3 |
217.2 |
60336 |
108.6 |
108.6 |
54.68 |
|
Intel i7-8086K |
39069 |
40675 |
56.2 |
824.9 |
412.5 |
29397 |
369.9 |
369.9 |
51.55 |
|
Intel i9-9900K |
39682 |
41015 |
51.1 |
1226 |
613 |
45542 |
550 |
549.8 |
79.79 |
|
AMD Ryzen 9 3900X |
53981 |
52271 |
70.7 |
1546 |
772.1 |
106943 |
385.7 |
385.7 |
96.57 |
|
AMD Ryzen 7 3700X |
51498 |
28739 |
67.3 |
1078 |
537.8 |
74474 |
271 |
271.2 |
67.77 |
|
AMD Ryzen 5 3600X |
50769 |
28736 |
68.9 |
799.5 |
400 |
55456 |
198.6 |
198.6 |
49.64 |
|
AMD Ryzen 3 3400G |
49936 |
53502 |
67.1 |
257.2 |
128.5 |
35736 |
64.16 |
64.16 |
32.25 |
|
AMD Ryzen 3 3300X |
51435 |
28743 |
66.4 |
551.6 |
276.1 |
38176 |
138.7 |
138.7 |
34.65 |
|
AMD Ryzen 3 3100 |
50246 |
28734 |
71.1 |
497.6 |
248.7 |
34946 |
124.4 |
124.4 |
31.09 |
|
Intel i5-10600K |
43340 |
43430 |
48.2 |
863.8 |
431.9 |
30782 |
387.2 |
386.9 |
53.99 |
|
Intel i9-10900K |
44972 |
43808 |
50.5 |
1632 |
815.7 |
58163 |
731.3 |
731.2 |
102 |
|
AMD Ryzen 5 5600X |
50972 |
28772 |
59.2 |
891.9 |
445.8 |
61623 |
709.6 |
709.7 |
55.72 |
|
Intel i9-11900K |
44919 |
43343 |
51.8 |
1068 |
534.2 |
164966 |
547 |
547 |
182.7 |
|
Intel i5-11600K |
43953 |
43468 |
55.6 |
838.7 |
419.4 |
123767 |
429.3 |
429.3 |
143.4 |
|
Intel i9-12900K |
71418 |
72395 |
82 |
695.7 |
247.9 |
140499 |
400.6 |
400.6 |
166.2 |
|
Intel i5-12600K |
65416 |
71336 |
87.8 |
432.5 |
216.2 |
86470 |
252.7 |
252.7 |
96.22 |
|
AMD Ryzen 5 4500 |
52683 |
53191 |
82.8 |
806 |
402.6 |
56578 |
201.5 |
201.3 |
50.35 |
|
AMD Ryzen 5 5600 |
48444 |
28753 |
70.9 |
853.2 |
426.2 |
107839 |
675.8 |
679.6 |
53.38 |
|
AMD Ryzen 7 5700X |
47858 |
28760 |
68.2 |
1158 |
577.9 |
137459 |
919.1 |
912.9 |
74.38 |
|
AMD Ryzen 7 7700X |
58755 |
80120 |
70 |
1392 |
694.6 |
192730 |
1205 |
1205 |
602.4 |
|
AMD Ryzen 5 7600X |
54720 |
80771 |
69.5 |
1046 |
523.1 |
147661 |
912.5 |
912.5 |
456.4 |
|
AMD Ryzen 9 7950X |
67342 |
76712 |
69 |
2735 |
1364 |
379510 |
2370 |
2370 |
1184 |
|
AMD Ryzen 9 7900X |
68064 |
78123 |
67.7 |
2062 |
1029 |
288134 |
1792 |
1789 |
895.4 |
|
Intel i9-13900K |
76006 |
68902 |
86.1 |
2238 |
1116 |
157028 |
831.4 |
831.4 |
270.6 |
|
Intel i5-13600K |
64721 |
62311 |
97.2 |
1294 |
647 |
86637 |
509.5 |
509.4 |
136.4 |
|
AMD Ryzen 9 7900 |
73968 |
73494 |
69.4 |
2007 |
998.7 |
267499 |
1710 |
1709 |
855.9 |
|
AMD Ryzen 7 7700 |
58694 |
79929 |
68.9 |
1369 |
684.7 |
185084 |
1192 |
1192 |
594.3 |
|
AMD Ryzen 5 7600 |
59454 |
81467 |
69.6 |
988.6 |
494.3 |
140625 |
861.9 |
861.2 |
431.2 |
|
AMD Ryzen 9 7950X3D |
77677 |
80314 |
68.1 |
2619 |
1311 |
178269 |
2239 |
2239 |
1120 |
Onboard Video Performance
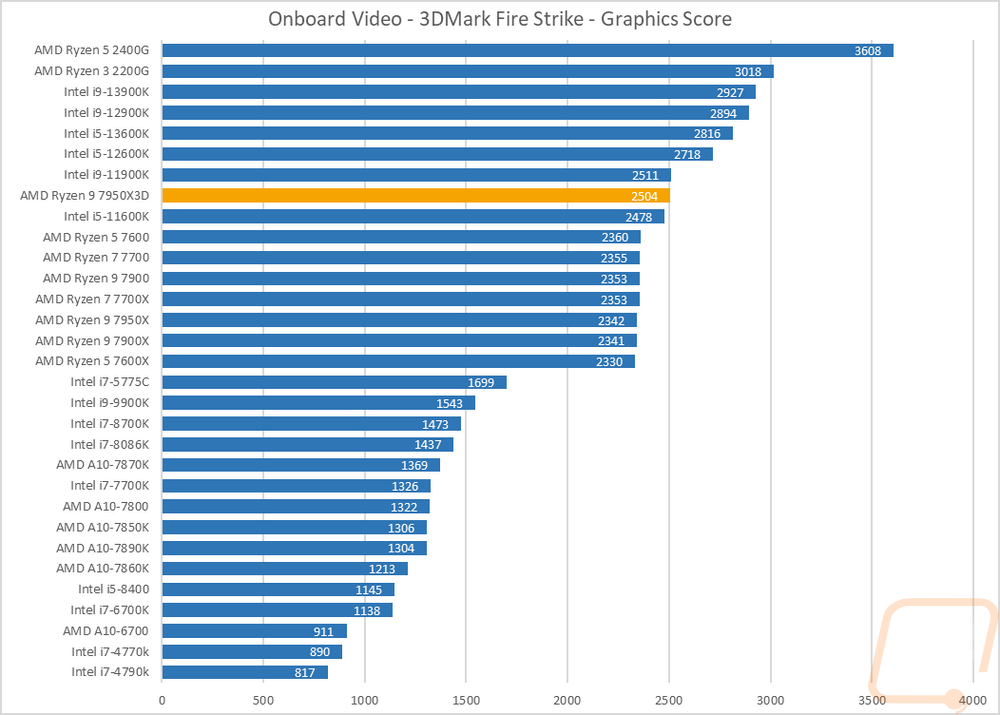
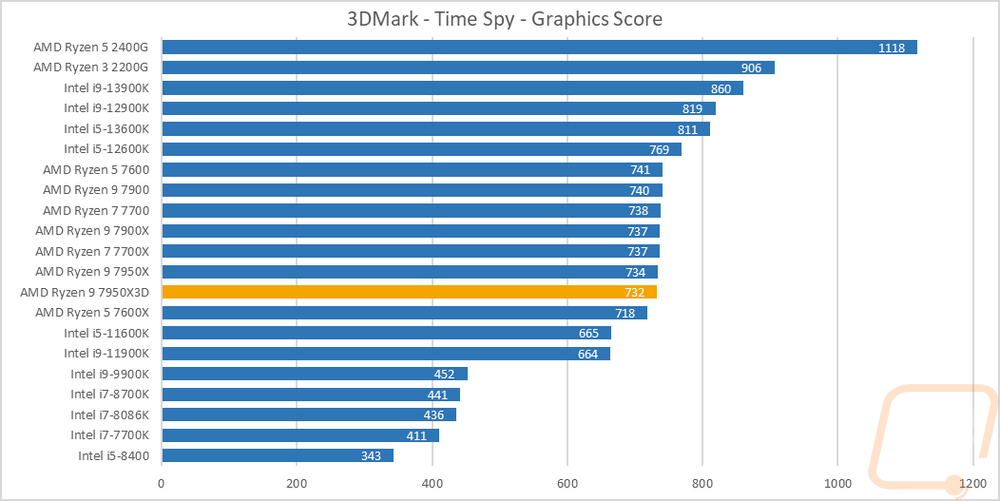
Onboard performance isn’t something that you think about when it comes to high-end CPUs because I think the expectation is that you will be adding a dedicated GPU but there are situations where a dedicated GPU isn’t needed or you may need to run the integrated graphics while waiting on your video card to come in or be replaced. So I do still want to check out the performance of all three of the non-X CPUs when it comes to integrated GPU performance. For that, I have run a few basic tests with a mix of older and newer games and benchmarks. Integrated GPUs aren’t anywhere near the performance of even the lowest-end GPUs but it is still interesting to see what they can do. To start that I went with the always consistent 3DMark with both the older Fire Strike benchmark and the newer Time Spy which is DX12. I only used the graphics score, not the total score to take the CPU performance out of the equation as much as possible. In both tests, we saw interesting results with the unique 7950X3D. In Fire Strike the stacked L3 cache did help and we see it performing better than all of the other 7000 Series CPUs which are all together with nearly the same score. It wasn’t enough to put it up in the range of the latest Intel CPUs or AMDs older APUs. In the Time Spy test, however, the 7950X3D was in the mix with the other 7000 Series CPUs but down near the bottom of the pack.
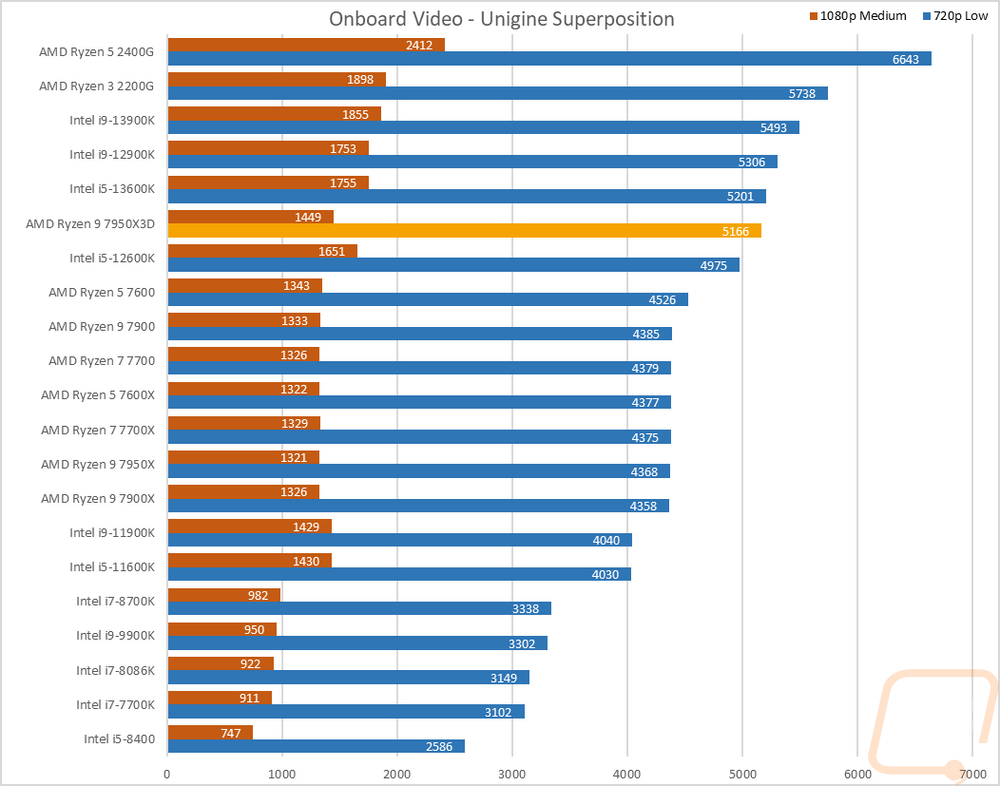
In Unigine Superposition I ran the 1080p medium detail and 720p low detail tests and the results here weren’t much different than the previous tests. The 7950X3D did well in the 720p test running well ahead of the other 7000 series CPUs and with the 13600K. Its 1080p performance on the other hand is behind compared to the 12600K and 13600K it sits between but that is still faster than the other new AMD CPUs.
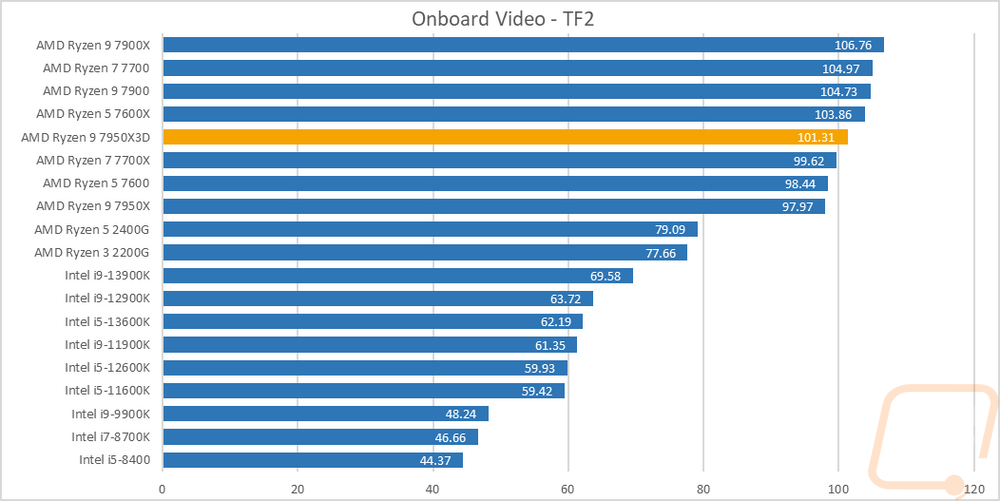
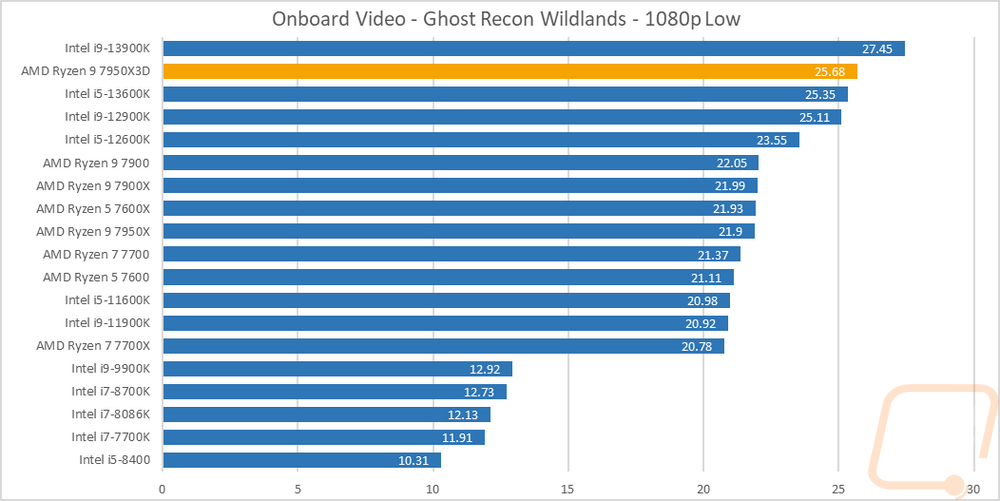
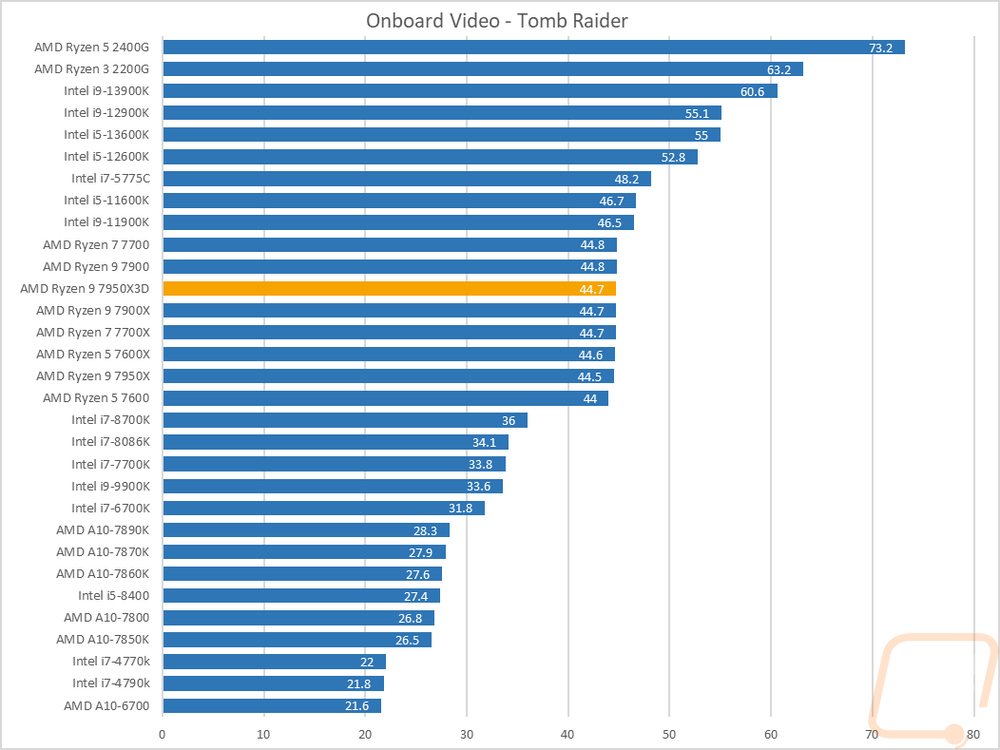
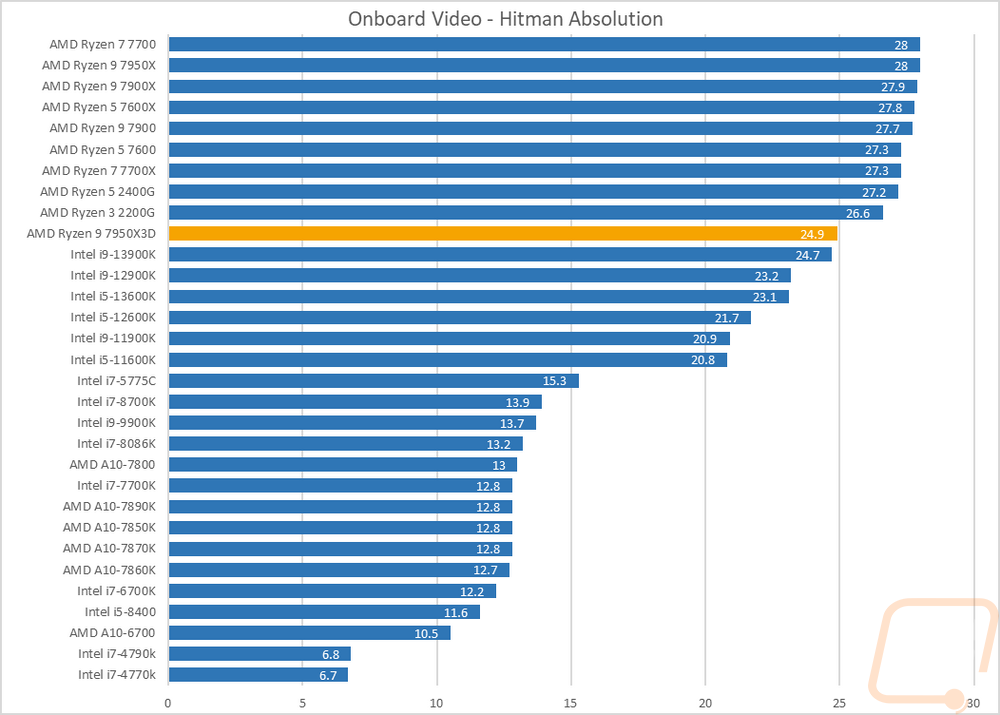
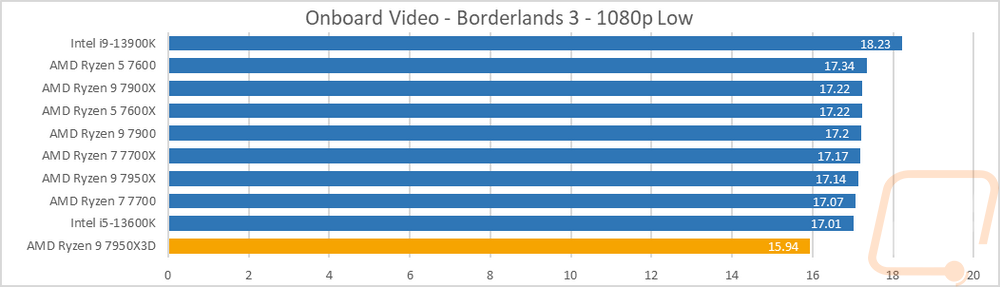
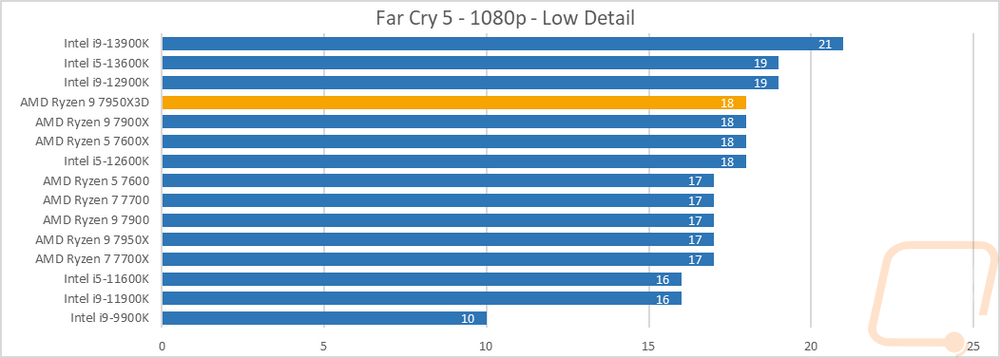
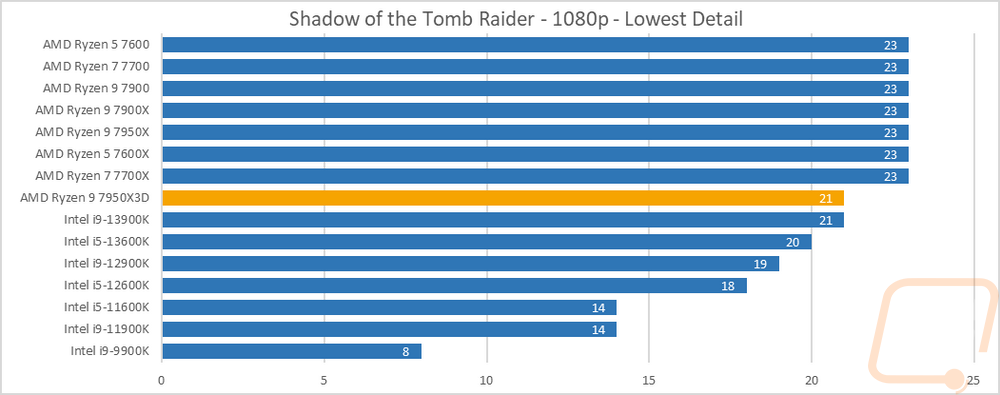
Then from there on, I jumped into game tests. Some of our tests are older games but I did also add in a few newer games as well to get an idea of newer games when tested at 1080p and low or medium settings. In Far Cry 5 and Tomb Raider, the 7950X3D is right in line with the other 7000 series CPUs which are all at nearly the same FPS. But there were a few other games where the other 7000 series CPUs also did this but the 7950X3D didn’t fall in line. Borderlands 3 for example is noticeably slower than the others and the same thing happens in Hitman Absolution. It also happens in Shadow of the Tomb Raider as well. Then with TF2 and Ghost Recon Wildlands, the results are tied more to the CPU side of things with the faster CPUs doing better there but in TF2 the 7950X3D is lower than it was in my CPU testing.
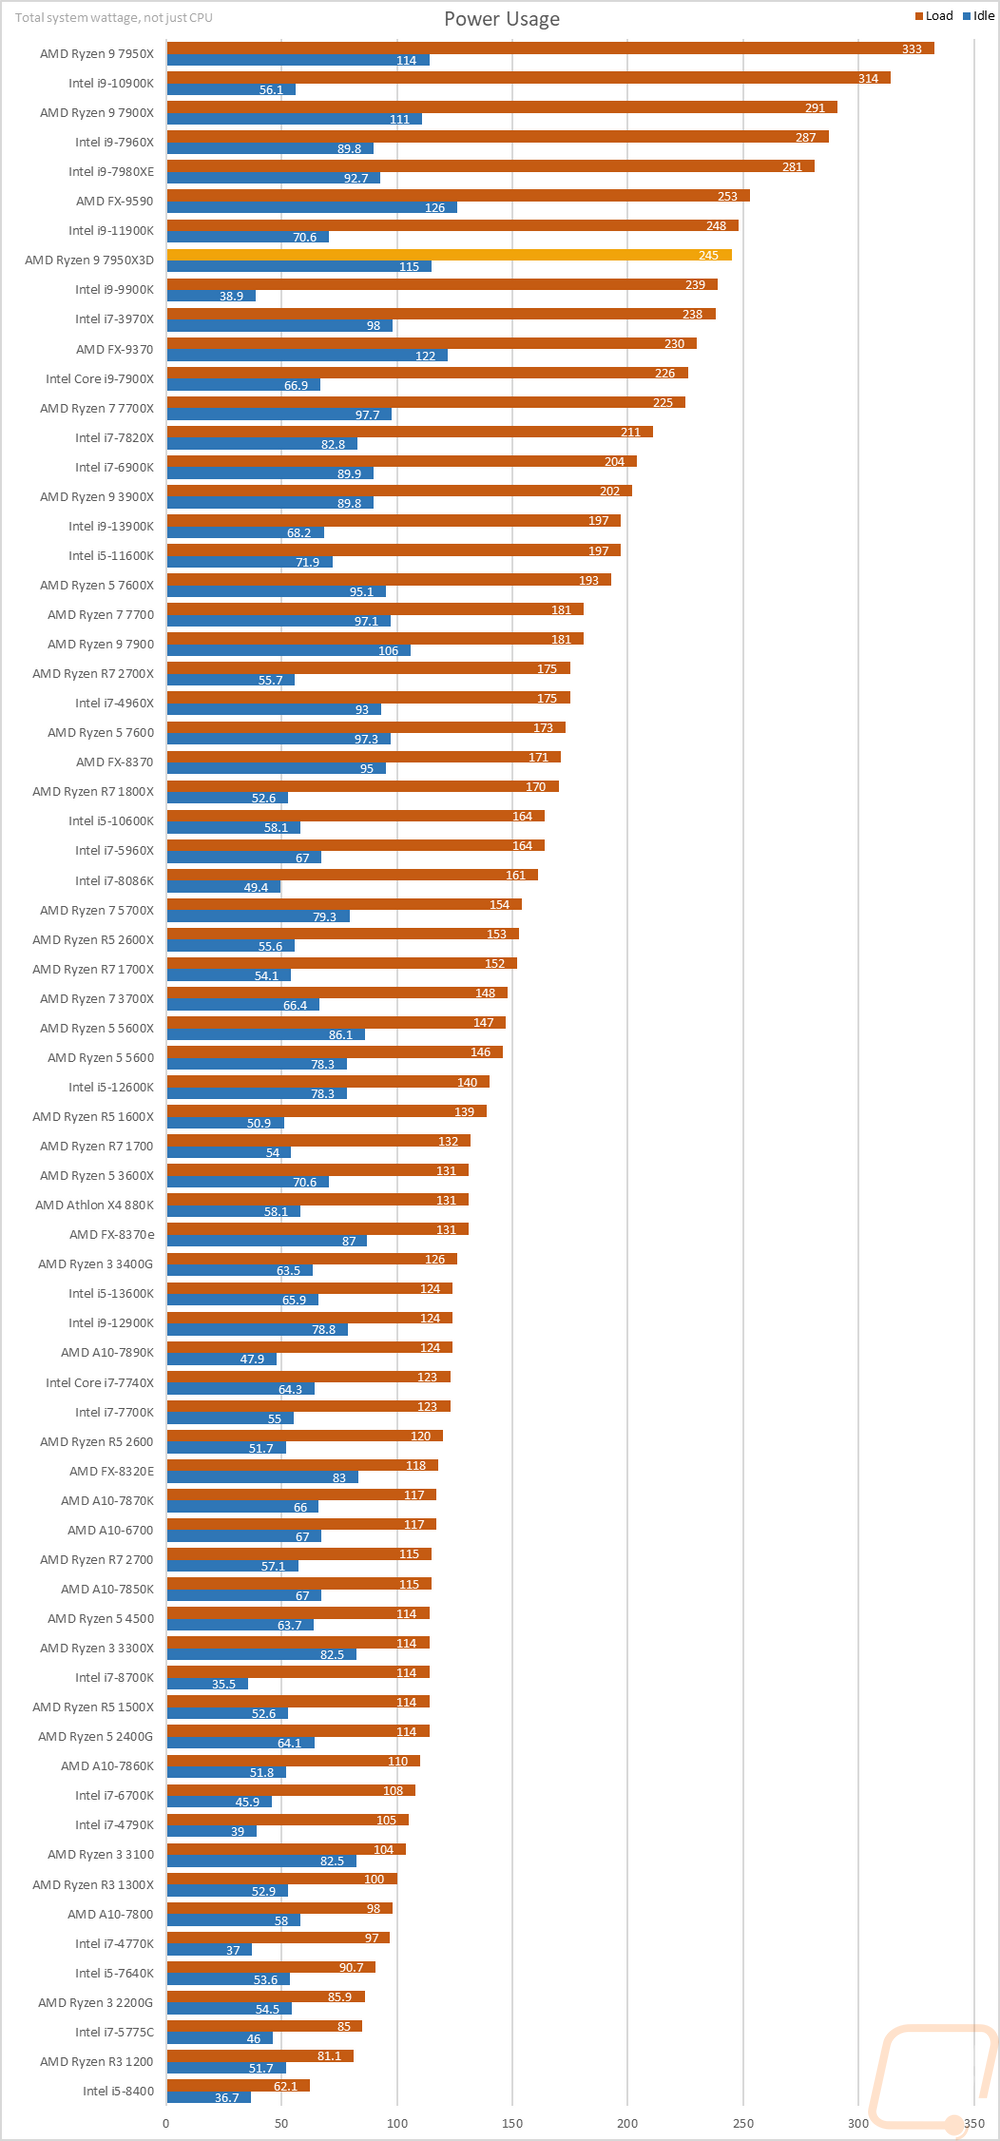
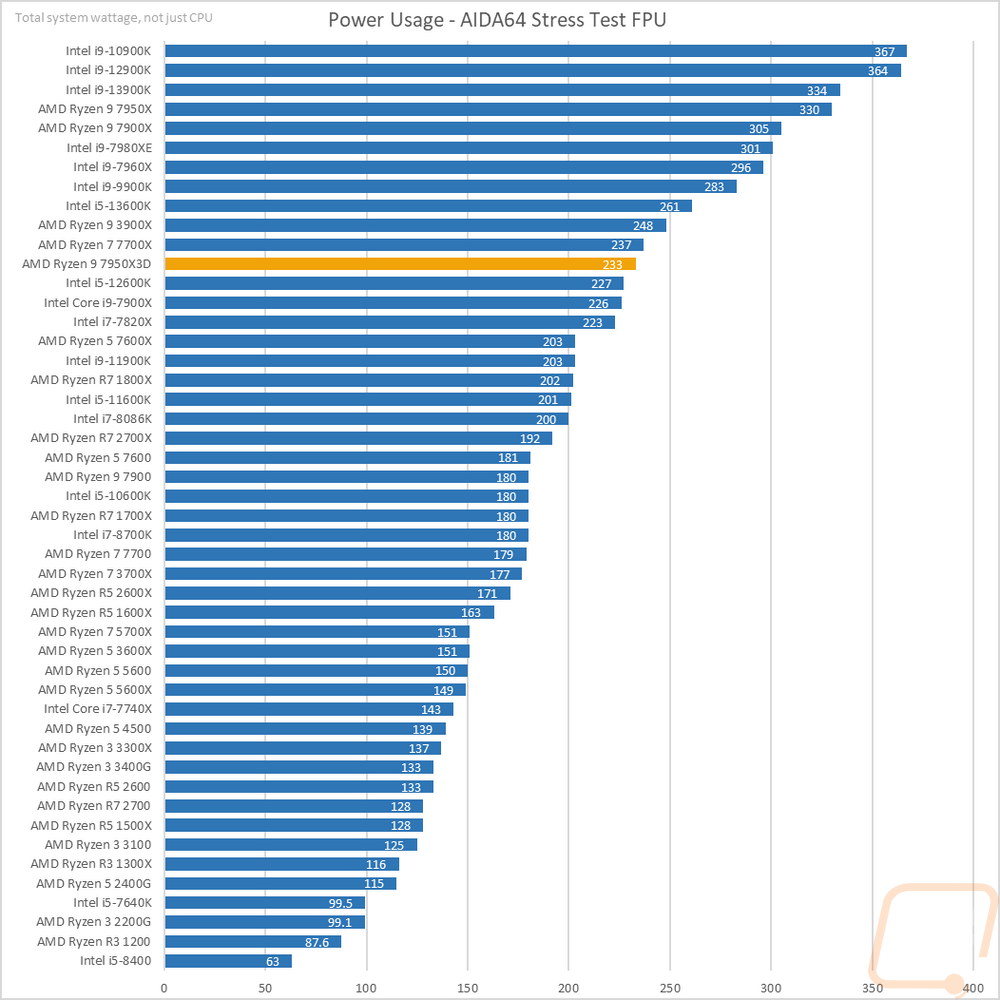
Power Usage and Temperatures
For some people, performance is the only thing important, but for others, power usage and temperatures also play a role so we do take a look at both of those as well. This is especially important in SFF or even just smaller mid-sized builds and it affects the components you need to get for your system as well as your PSU and cooler. To take a look at power usage I ran three different tests. I noted the idle power draw of our entire system then I took a look at the load wattage of the system using two different workloads. One was wPrime and the second was AIDA64 using their FPU workload which is extremely demanding. At idle the testbench with the 7950X3D pulled 115 watts which was similar to what I saw with the other 7000 Series CPUs with its high idle power usage. With the lower 120-watt TDP however it is notably better when put under load than the other 7000X CPUs. With wPrime, the system pulled 245 watts which was still 48 watts more than the 13900K but 88 watts lower than the Ryzen 9 7950X. With AIDA64’s FPU stress test as the workload the system with the 7950X3D inside pulled 233 watts. The 13900K here pulled 101 watts more in this situation and this was 72 less than the base 7950X as well.
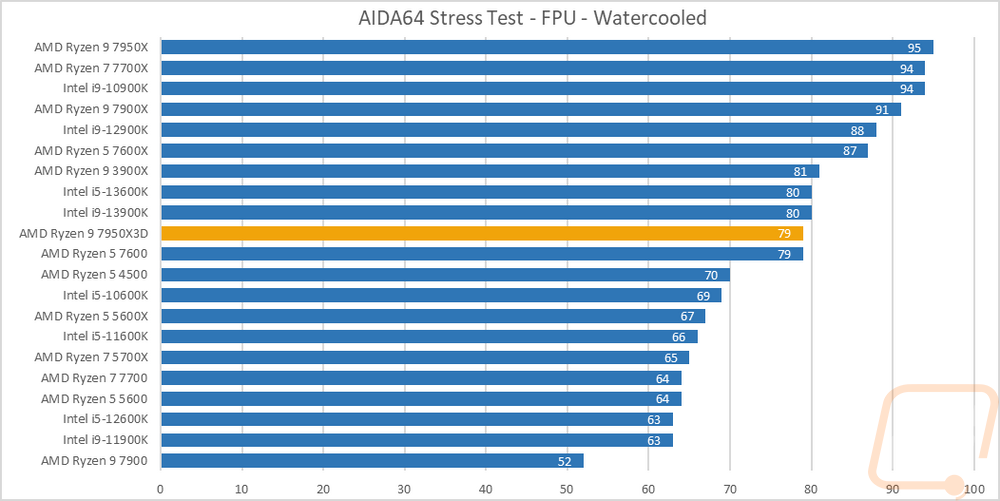
With the initial 7000X Series Ryzen CPUs we saw that all of the CPUs in addition to having a higher power draw also would ramp their clock speeds up and keep the CPU running at 90c and higher no matter the cooler you were running. The 7950X3D does that same thing, but AMD has toned things down with the TJMax at 89c from 95c on the other X CPUs. With the wattage being 50 watts lower as well the 7950X3D ends up performing similarly to the Non-X Ryzen 7000 Series CPUs with it peaking at 79c in my testing which puts it in the middle of our chart and right with the 13900K which runs 1 degree warmer.
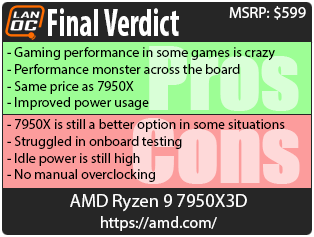
Overall and Final Verdict
Back in September when I took a look at the new 7000 Series Zen 4 CPUs I was extremely impressed with their performance, especially in games which is an area that Ryzen has struggled at times. The Ryzen 9 7950X with its 16 cores and 32 threads and with a boost clock of 5.47 GHz was and still is a monster. With the addition of AMDs 3D V-Cache stacked cache for half of the Ryzen 9 7950X3D and its crazy total cache of 144MB their latest addition has that same feeling. This is the type of performance that not long ago seemed impossible. The 7950X3D is an interesting case though because this isn’t a new flagship, it sits next to the original 7950X at the same price and with two different focuses even though they share a lot. In a lot of the synthetic benchmarks the 7950X3D with its asymmetrical chiplet design, lower base clock speed, and lower TDP isn’t always the fastest option. In fact, if standard raw processing power is what you need, in most cases the 7950X will still be the better pick. Its setup however improves in other areas, especially in gaming. Even when compared to the i9-13900K in our game benchmarks it was 12% faster on average. Its performance in some tests stands out completely on its own and had me in my testing redoing testing for days trying to make sure because it's rare to see that kind of standout performance, especially when in other benchmarks it is running closer to the 7900X.
The new lower TDP helps calm down the crazy power and thermals that I saw from the original launch as well which in itself is a welcomed improvement. Interestingly the new setup struggled more in the onboard video testing, not that I think anyone will need to worry about that short of using the onboard to initially set things up or in between a GPU upgrade in the future. The power draw was improved but I did still see the higher than normal idle wattages that I’ve seen on all of the 7000 Series Ryzen CPUs. You also don’t have full overclocking as an option, AMD has that locked down with the exception of a few one-click options that they offer. But you can still get into other BIOS options for power and everything else so all is not lost.
If you are looking for a monster when it comes to processing power but still also want to use your PC for gaming when you aren’t working the Ryzen 9 7950X3D fits the bill perfectly. It isn’t cheap with an MSRP of $599 and a motherboard to match it is also going to be expensive. But considering the pricing of the highest-end video cards these days it isn’t going to be the most expensive part of your build and when combined with a high-end GPU like in our testing, its performance will be crazy.

Live Pricing: HERE


