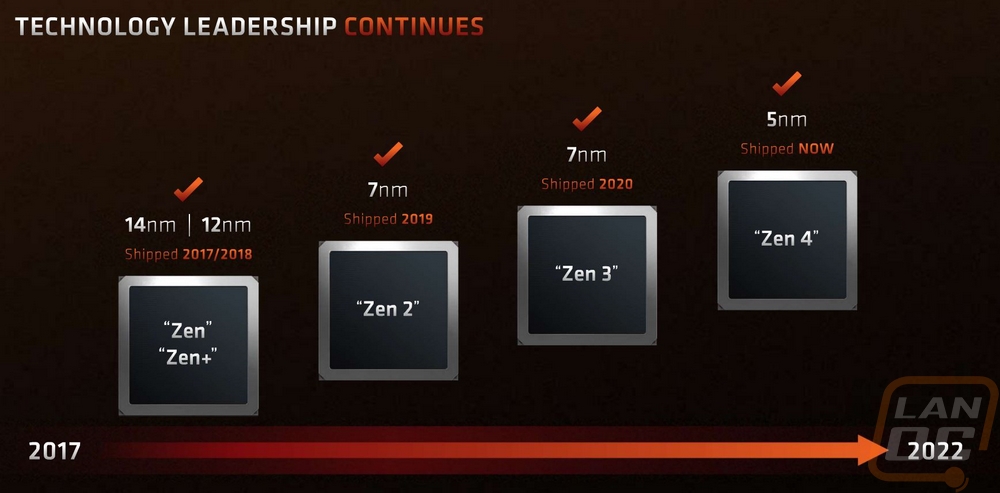
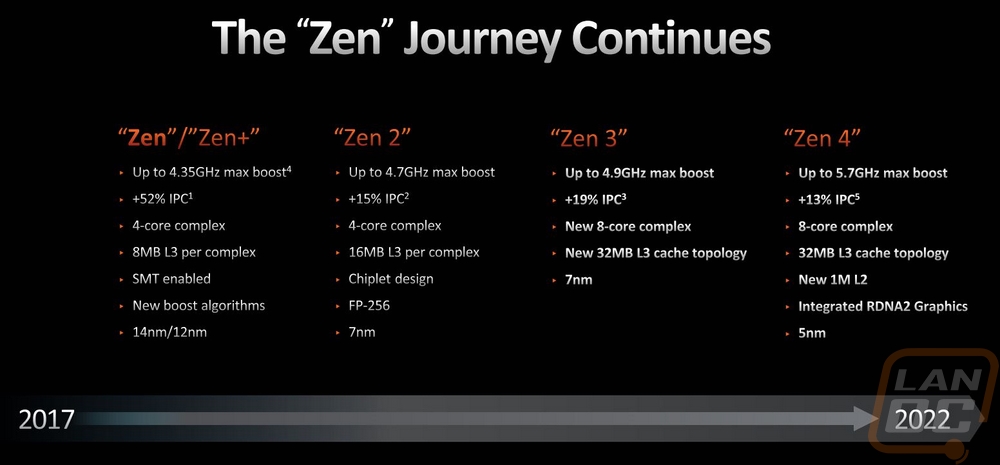
On March 2 2017 we published our first of many Ryzen reviews and AMDs long awaited CPU refresh and new at the time AM4 socket turned the CPU world on its head quickly accelerating what was a very stale CPU market. Just the last two years alone have felt like 10 years making the 5 and a half years from that launch to now feel like it has been 20 years. So much has changed with one exception, AMD has still been using that same AM4 socket. Well, tomorrow Zen 4 will be available for sale, and along with it the new AM5 socket as well and today I’m taking a look at the new Ryzen 5 7600X and the Ryzen 7 7700X CPUs to see what they are all about. So let’s dive in and check them out!
Product Name: AMD Ryzen 5 7600X and Ryzen 7 7700X
Review Sample Provided by: AMD
Written by: Wes Compton
Amazon Affiliate Link: Ryzen 5 7600X and Ryzen 7 7700X
Ryzen 7000 Series
While we have just the Ryzen 5 7600X and the Ryzen 7 7700X on the bench today for testing the new Ryzen launch does include more than just those two CPUs. In fact, they are the bottom two being launched today. AMD’s new 7000 series of CPUs is launching with four CPUs total, two Ryzen 9 CPUs with the 7950X and the 7900X and then the Ryzen 7 7700 X and Ryzen 5 7600X. The 7000 series is the introduction of the Zen 4 architecture and with that the new AM5 socket as well.
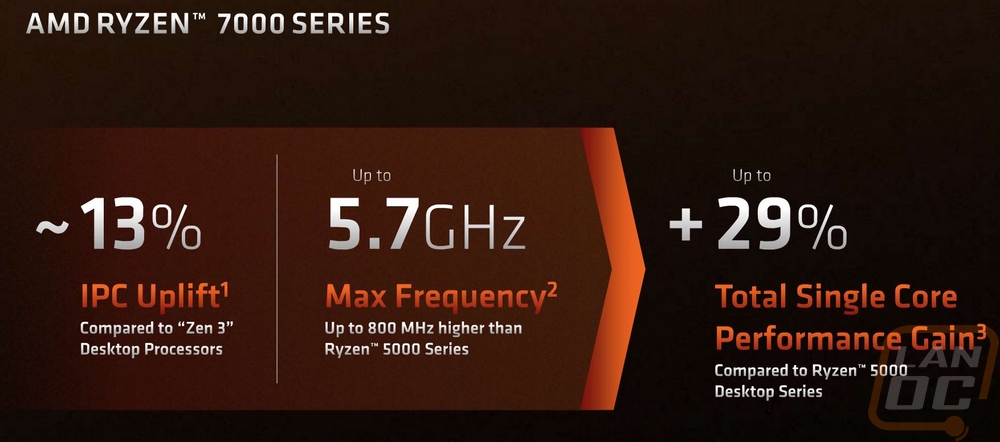
Zen 4 is an exciting launch because of its focus from the start on improving gaming and creation performance and some of you may remember the gaming performance struggles back with the original launch of Ryzen that AMD has slowly made improvements on. AMD's announcement talked about the 13% improvement in IPC compared to Zen 3 CPUs and to go with that huge clock speed improvements with up to 5.7 GHz max frequency being possible and all of that together giving up to a 29% improvement in single-core performance compared to Ryzen 5000 series CPUs.
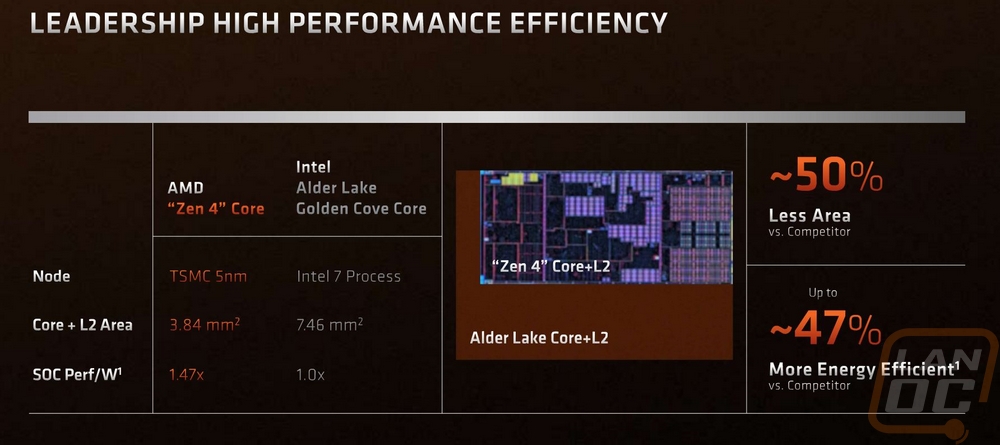
The new 7000 CPUs are all built on a 5nm process which AMD poked a few jabs at Intel in their presentation about Intel’s slower move to smaller processes and they also presented a comparison of a Zen 4 core + L2 cache compared to an Intel Adler Lake Core+L2 in die size. The big thing with this is that smaller die sizes can be more power efficient and also can potentially mean lower manufacturing costs as well which means Zen 4 should be able to be competitive in pricing. Zen 4 is also integrating RDNA2 graphics in all CPUs, not just a few lower-end CPUs. I know a lot of people may not use integrated graphics in higher-end builds but it is great to have the option even if temporary. This is especially good for situations where someone needs a fast CPU but doesn’t need a dedicated GPU.
With all of that information, we can now take a look at all four of the new Ryzen 7000 Series CPUs. The four CPUs split up into two different categories with both the Ryzen 9 7950X and Ryzen 9 7900X having a 170-watt TDP, 230-watt max socket power, and the 225A/160A EDC and TDC whereas the Ryzen 7 7700X and Ryzen 5 7600X have a lower TDP of 105 watts which is also the max socket power and the EDC and TDC are 170A/110A. This puts the two Ryzen 9 CPUs in the liquid cooling recommended category where the 7700X and 7600X both can run with a tower cooler. Each CPU does of course have its own core count and clock speeds. The 7950X which is the top dog is a 16-core CPU with a max boost of 5.7 GHz, the 7900X has 12 cores and a max boost of 5.6 GHz. The base clock speed however is higher on the 7900X at 4.7Ghz whereas the 7950X is 4.5 GHz. The 7700X has 8 cores and a max boost of 5.4 GHz and the 7600X has 6 cores and a max boost of 5.3 GHz. These also have the same base clock situation with the 7700X at 4.5 GHz and the 7600X at 4.7 GHz. All of the CPUs have 1MB of L2 cache for each core and they also all have the same die size and transistor count.
|
Specifications |
Ryzen 9 7950X |
Ryzen 9 7900X |
Ryzen 7 7700X |
Ryzen 5 7600X |
|
Core/Threads |
16/32 |
12/24 |
8/16 |
6/12 |
|
Max Boost |
5.7 GHz |
5.6 GHz |
5.4 GHz |
5.3 GHz |
|
Base Clock |
4.5 GHz |
4.7 GHz |
4.5 GHz |
4.7 GHz |
|
L2 Cache |
16x1MB |
12x1MB |
8x1MB |
6x1MB |
|
L3 Cache |
64MB |
32MB |
||
|
TDP |
170W |
105W |
||
|
Max Socket Power (PPT) |
230W |
105W |
||
|
Max Current (EDC) |
225A |
170A |
||
|
Max Curren, Thermally Limited (TDC) |
160A |
110A |
||
|
TjMax |
95C |
|||
|
Stock/Auto Voltage Range (Active Core) |
0.650 – 1.475V |
|||
|
Typical Loaded Temperatures |
70-90C |
|||
|
Boost Algorithm |
Precision Boost 2 |
|||
|
Recommended Cooler |
240-280 Liquid (or equivalent) |
Mid-Frame Tower Cooler (or equivalent) |
||
|
Max Memory Speed (Non-OC) |
DDR5-5200 (2x16GB) |
|||
|
ECC Support |
Enabled in-silicon, support varies by motherboard |
|||
|
CCD Die Size |
70mm ² |
|||
|
CCD Transistor Count |
6.5 billion |
|||
|
IOD Die Size |
122mm ² |
|||
|
IOD Transistor Count |
3.4 billion |
|||
|
MSRP |
$699 |
$549 |
$399 |
$299 |
For pricing, the 7950X is the highest at $699 which is $100 less than the launch price of the Ryzen 9 5950X that it replaces. The 7900X is $549 which is the same as the 5900X. The 7700X is $399 which is $100 more than the 5700X and the 7600X is $299 which is the same as the 5600X at launch. As far as core count they all match their previous generation. But when it comes to clock speeds there are significant changes as you can see in the table below. The same goes for the TDPs which for comparison the 7600X now has the same TDP that the previous flagship 5950X had!
|
|
Launch Price |
Core Count |
Max Boost Clock |
Base Clock |
TDP |
|
Ryzen 9 7950X |
$699 |
16 |
5.7 GHz |
4.5 GHz |
170W |
|
Ryzen 9 5950X |
$799 |
16 |
4.9 GHz |
3.4 GHz |
105W |
|
Ryzen 9 7900X |
$549 |
12 |
5.6 GHz |
4.7 GHz |
170W |
|
Ryzen 9 5900X |
$549 |
12 |
4.8 GHz |
3.7 GHz |
105W |
|
Ryzen 7 7700X |
$399 |
8 |
5.4 GHz |
4.5 GHz |
105W |
|
Ryzen 7 5700X |
$299 |
8 |
4.6 GHz |
3.4 GHz |
65W |
|
Ryzen 5 7600X |
$299 |
6 |
5.3 GHz |
4.7 GHz |
105W |
|
Ryzen 5 5600X |
$299 |
6 |
4.6 GHz |
3.7 GHz |
65W |
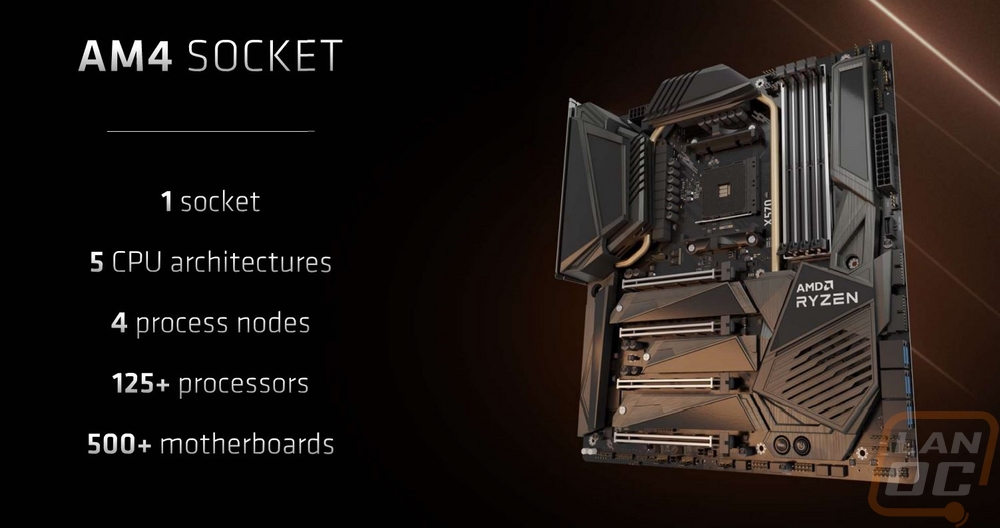
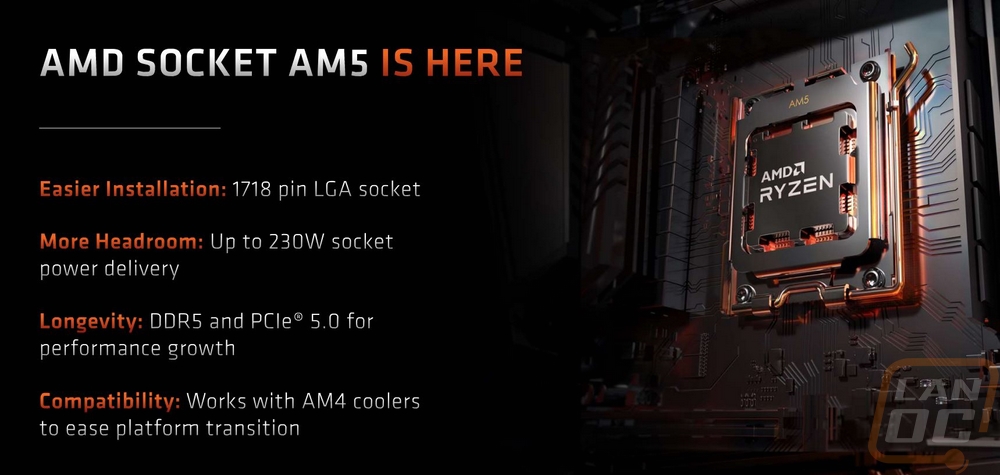
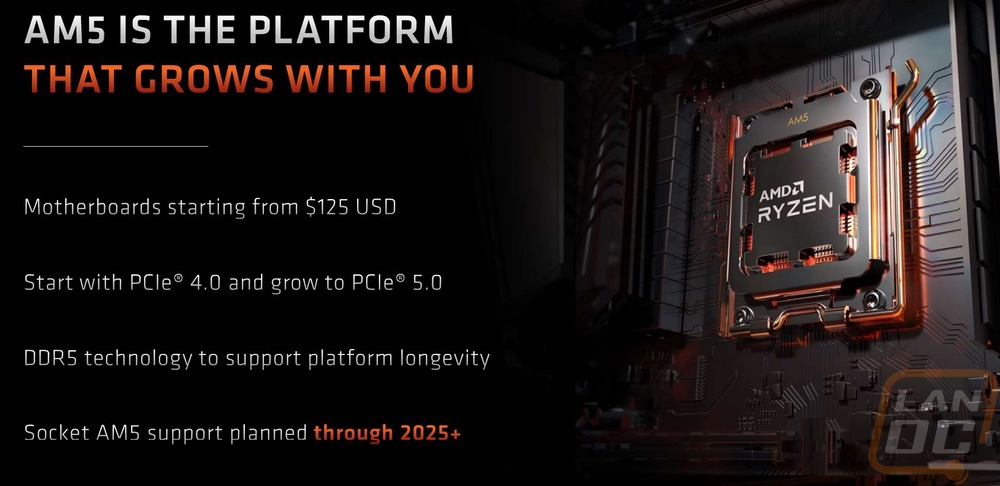
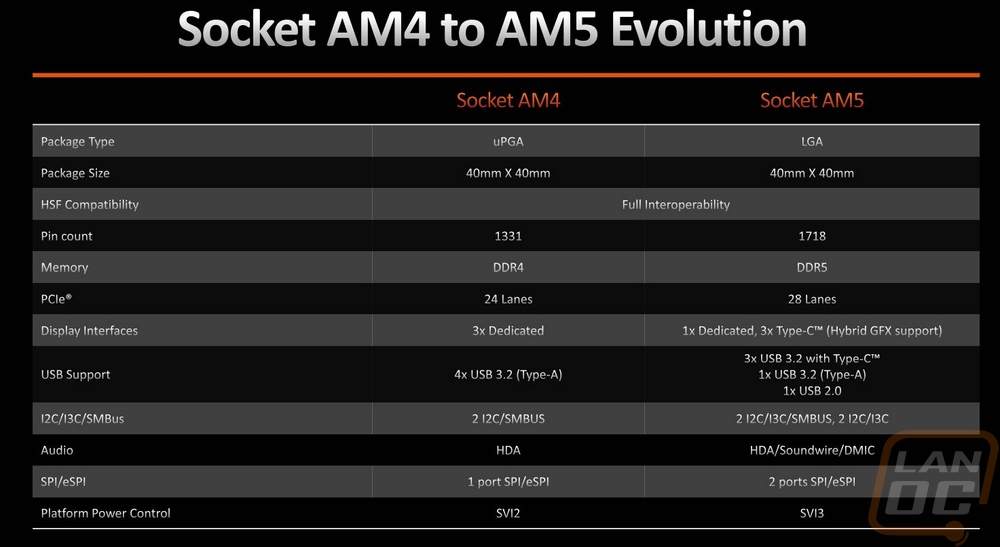
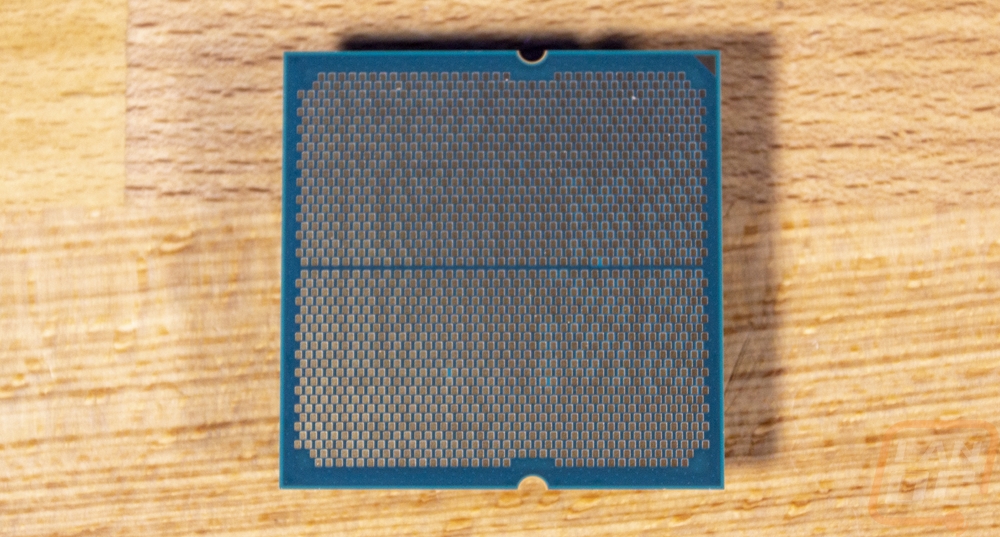
To go with the new CPUs this is the introduction of the new AM5 socket which in itself is huge news, AM4 launched with the original Ryzen launch. As the picture below points out, AM4 covered 5 CPU architectures and over 125 processors. The new AM5 socket's biggest change is to the new 1718 pin LGA socket which moves the pins to the motherboard and locks the CPU in place with the full metal hold down, no more CPUs pulling out with your cooler. The new socket is capable of up to 230 watts of power delivery and has support for DDR5 and PCIe 5.0. The new socket also has the same clip mounting setup that AMD CPUs have used for years which means a lot of coolers will still work, with the LGA backplate there will be cooler designs that used a new backplate that will need changed but overall it is great to go to a new socket, especially one that is this big of a change and have cooler compatibility. The overall package size is the same 40mm x 40mm size but the new socket means 28 PCIe lanes vs 24 on AM4.
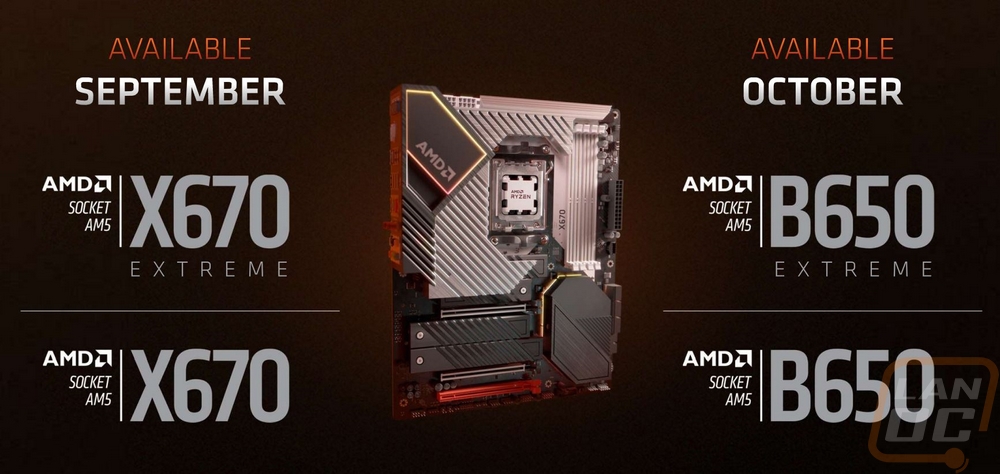
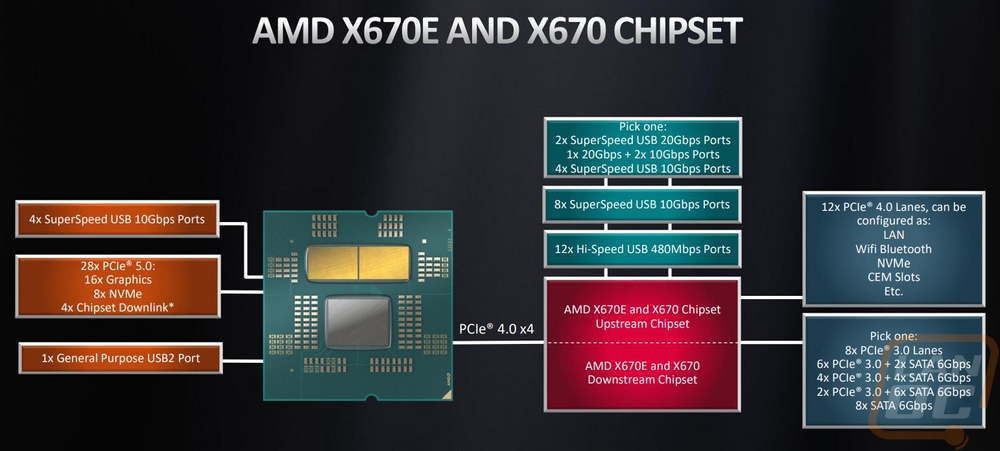
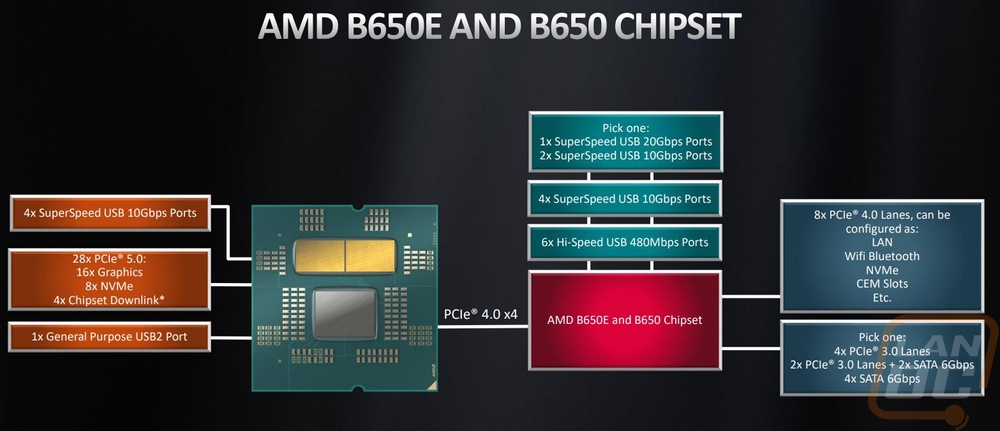
At this launch, AMD has the X670 chipset and the X670 Extreme which both share the same base chipset only the extreme designation means the board has support for PCIe Gen 5 storage and GPU whereas a standard X670 board will have PCIe Gen 5 for the storage but 4 for the GPU. In October they are also bringing out the B650 Extreme and B650 chipsets as well. All four chipsets will have the same 4x superspeed USB ports directly to the CPU, 28 PCIe lanes, 1 USB 2.0 port, 8x NVMe, and 16x for the graphics which are all on the CPU side. B650 cuts the high-speed and super-speed USB port counts in half and drops a lot of the high-end USB options as well. B650 gets 8 PCIe lanes vs 12 on X670 for things like LAN, Wifi, NVMe, etc, and goes from 8 to 4 for PCIe 3.0 lanes as well.
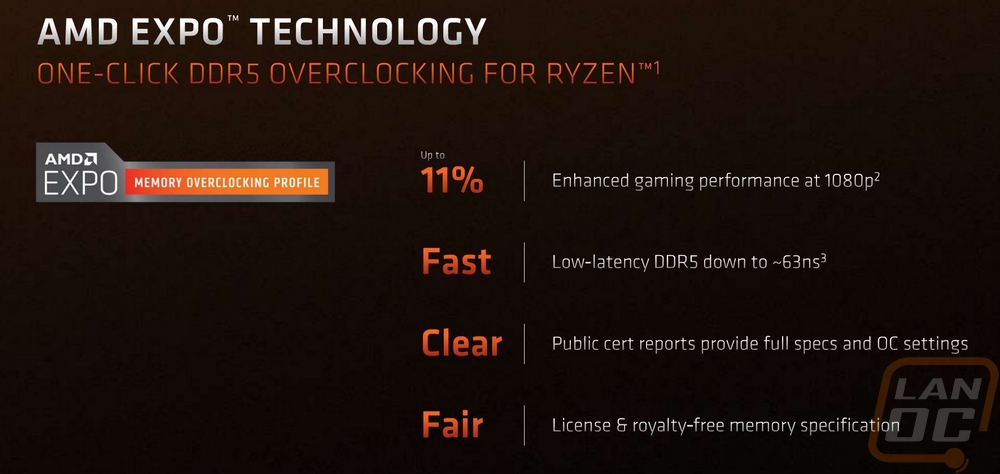
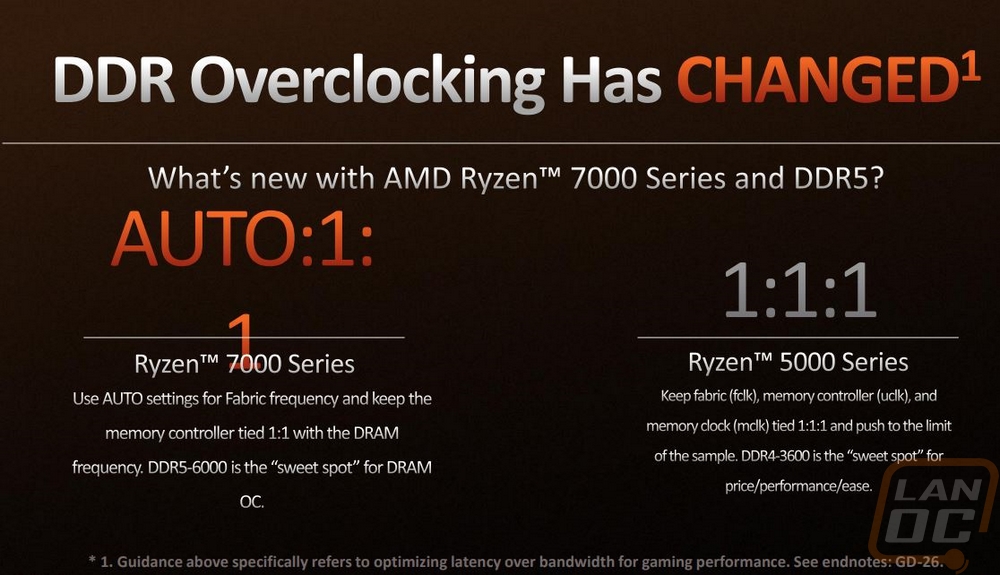
With the move to DDR5, AMD has also introduced AMD Expo which is memory overclocking profiles. The big thing here is that AMD has introduced this as a license and royalty-free specification which means we should see great adaption in memory in the future. They have set auto overclocking settings for the memory to keep a 1 to 1 ratio between the controller and dram frequency and with that, the new sweet spot for a memory overclocks is 6000 MHz.
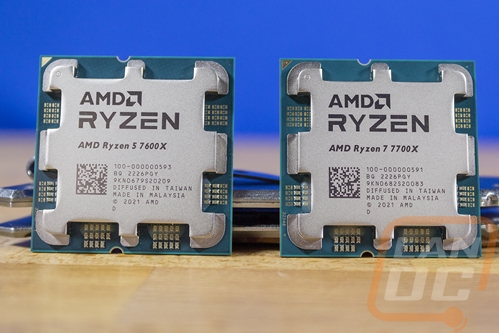
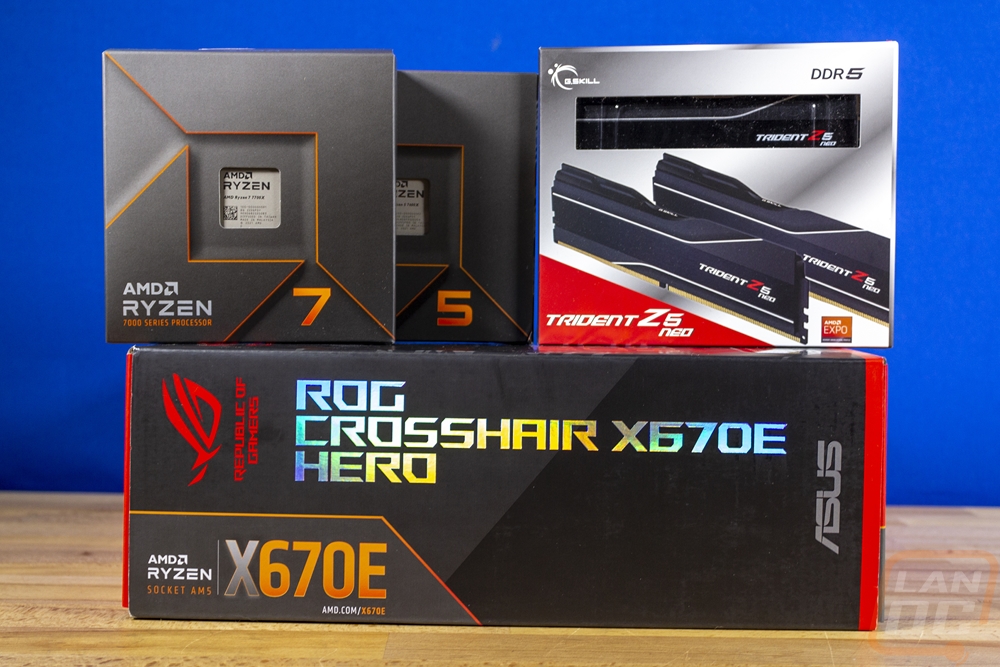
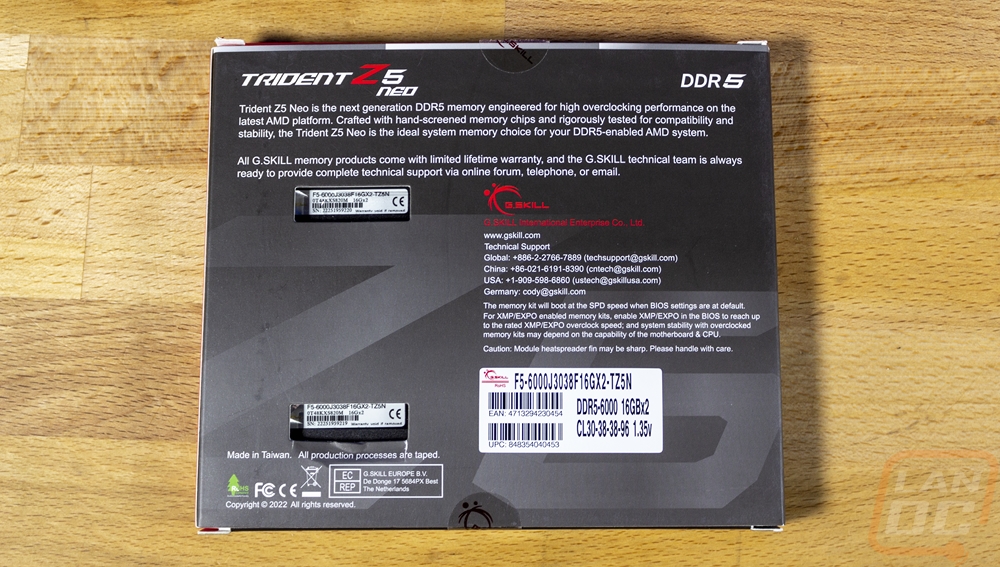
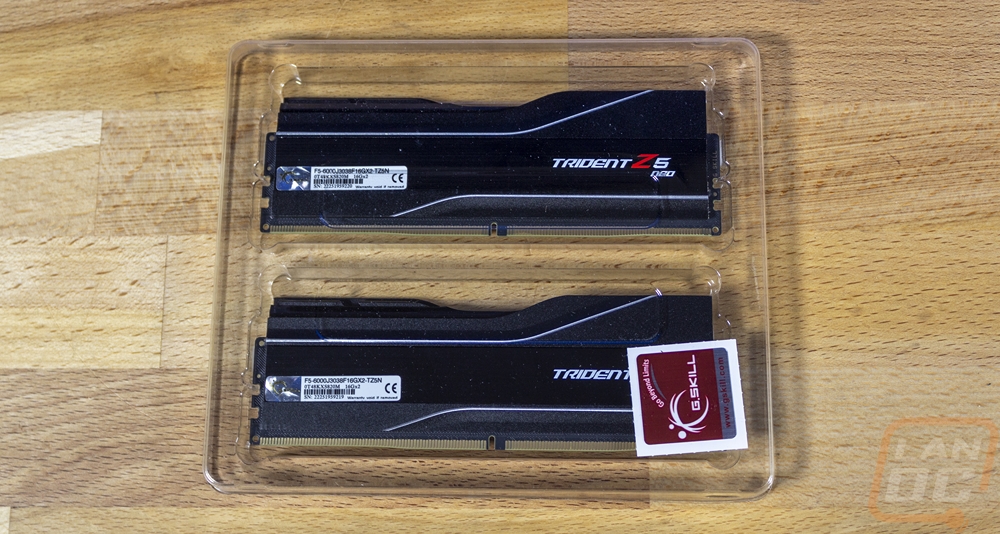
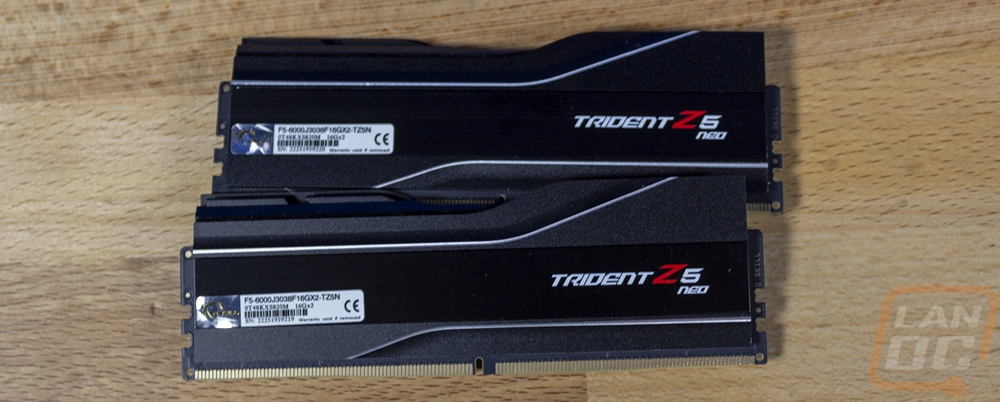
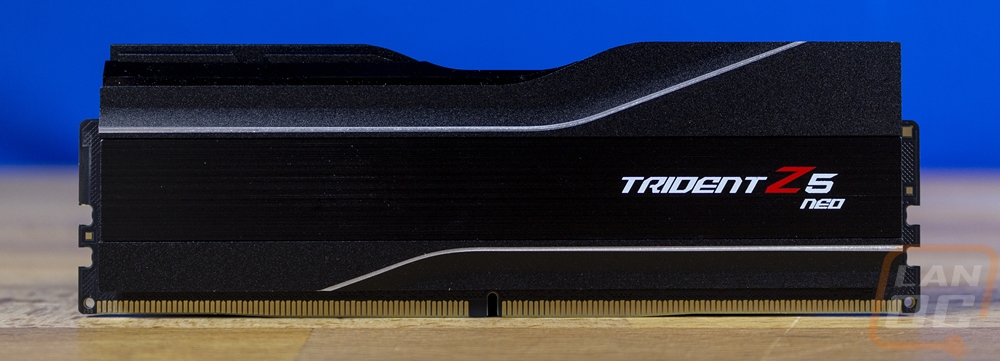
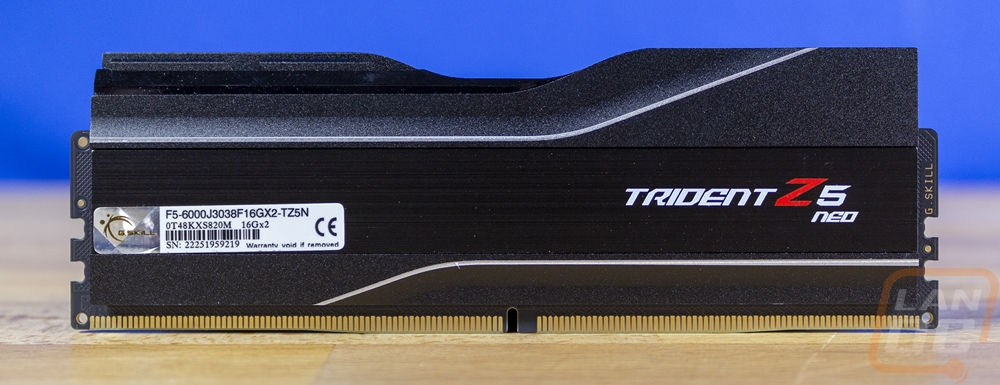
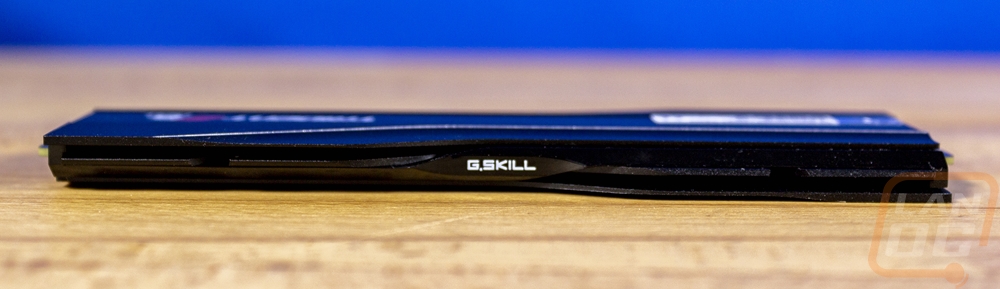
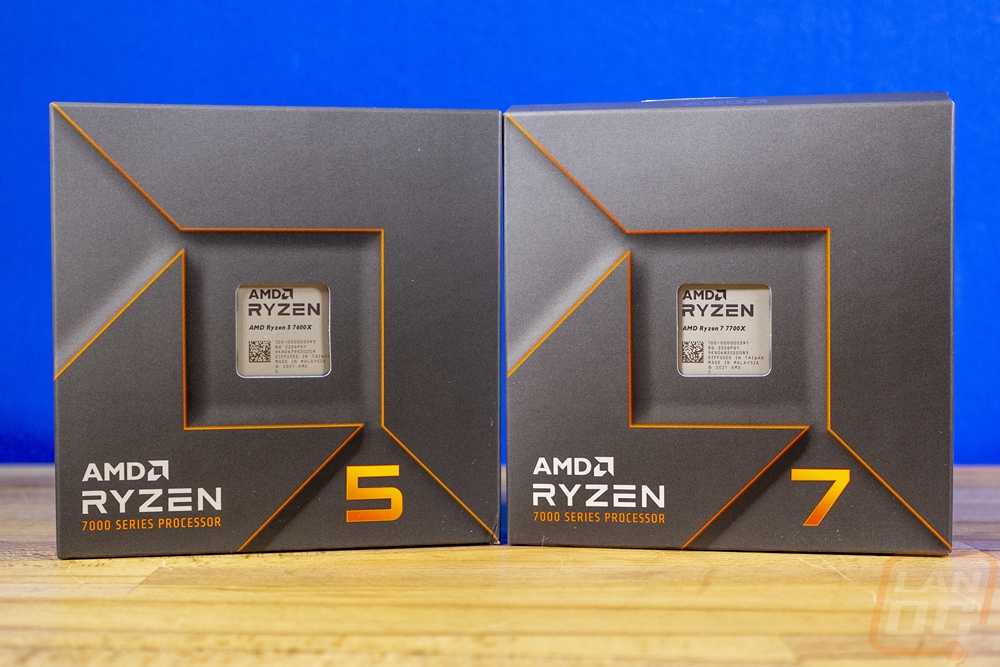
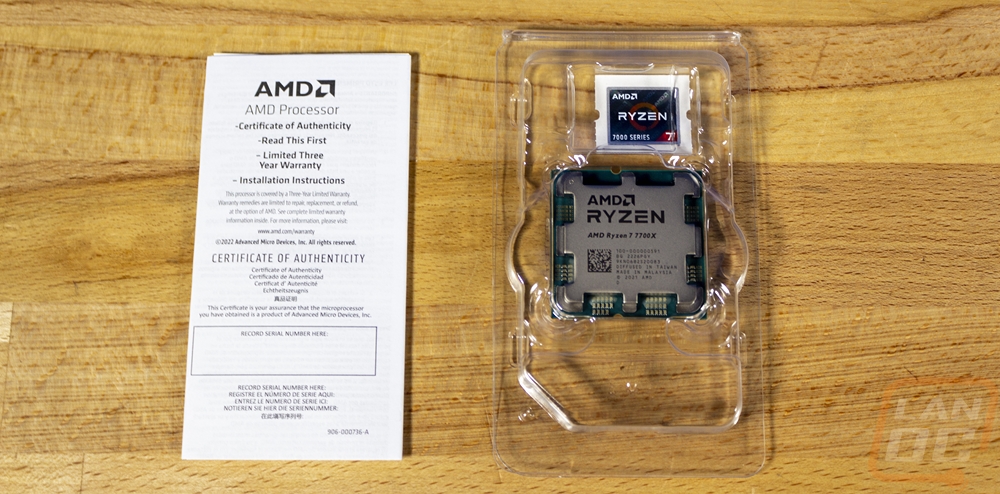
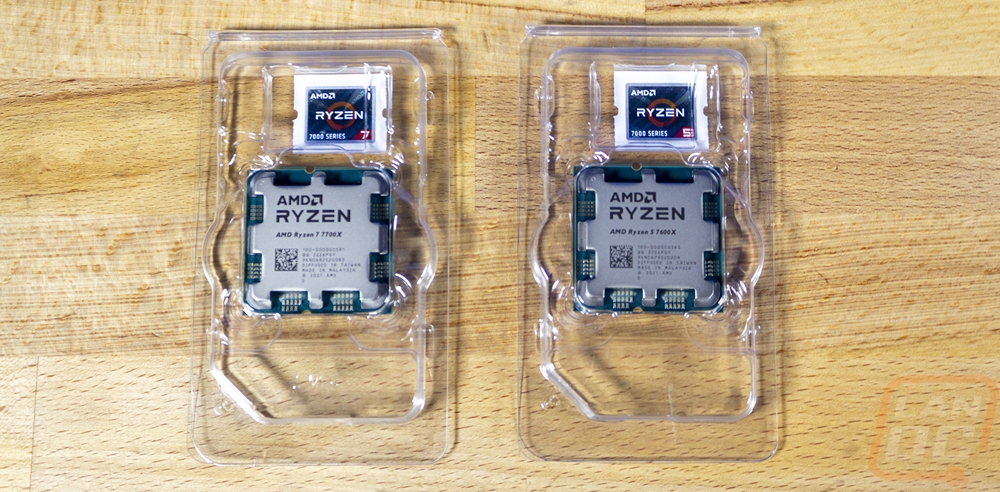
I also wanted to quickly show the review kit that AMD sent over. Unlike some past launches, the 7000 Series kit didn’t have a special box. But the kit came with the Ryzen 5 7600X and the Ryzen 7 7700X in their compact boxes that show the CPU through a window in the center of the front. They also included an Asus ROG Crosshair X670E Hero motherboard that I will be reviewing as well and the G.Skill Trident Z5 Neo memory which supports AMD Expo and runs at the 6000 MHz sweet spot with CL30-38-38-96 timings.

I love the look of the new AMD boxes and because they don’t include a cooler the new boxes are a lot more compact as well. They have the same grey and orange theme that all Ryzen CPUs have had and highlight the 5/7/9 that the CPU is in on the front. Then you can see the CPU model on the CPU itself through the window to confirm everything. Inside you have a certificate of authenticity paper which also has the installation instructions and warranty information. Then the CPU itself comes in a similar clamshell to past AMD CPUs only with it changed to support the new LGA socket type.
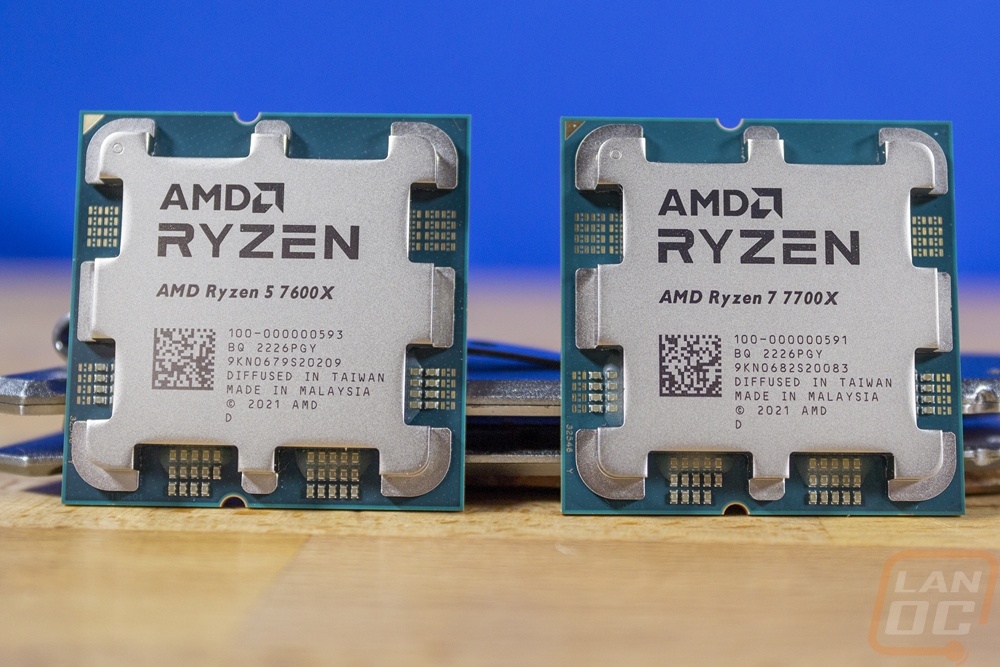
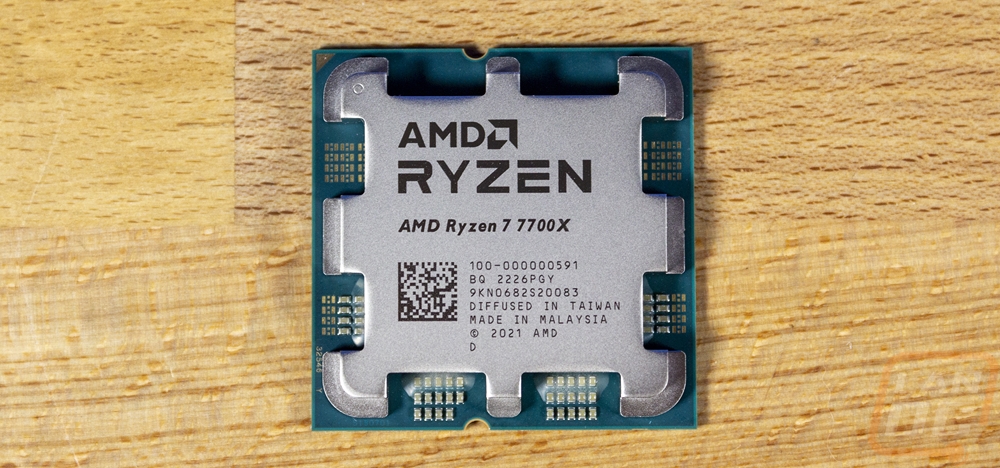
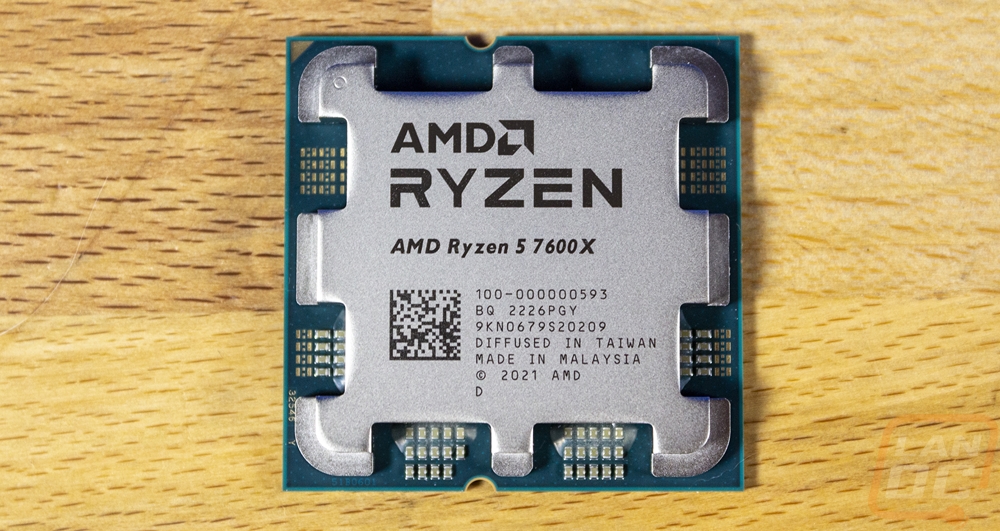
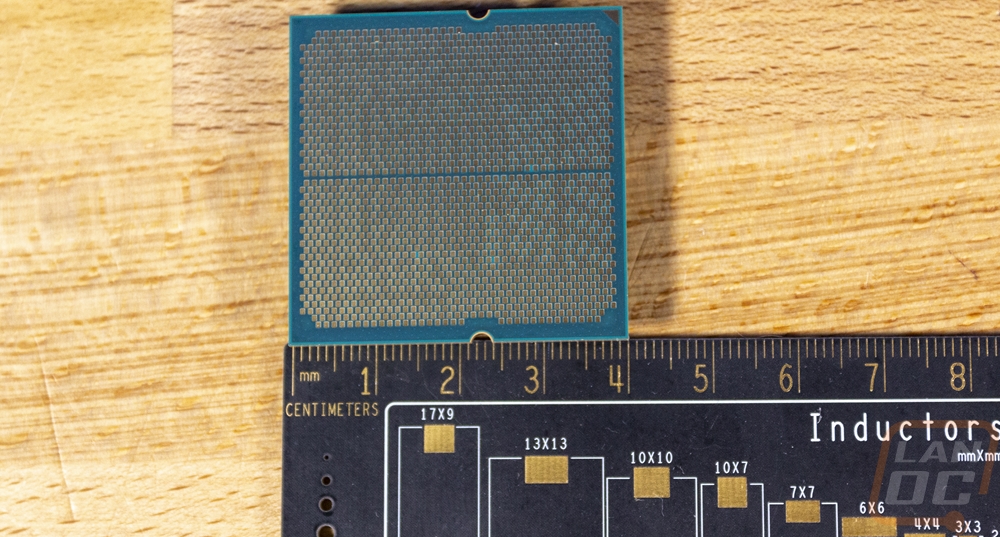
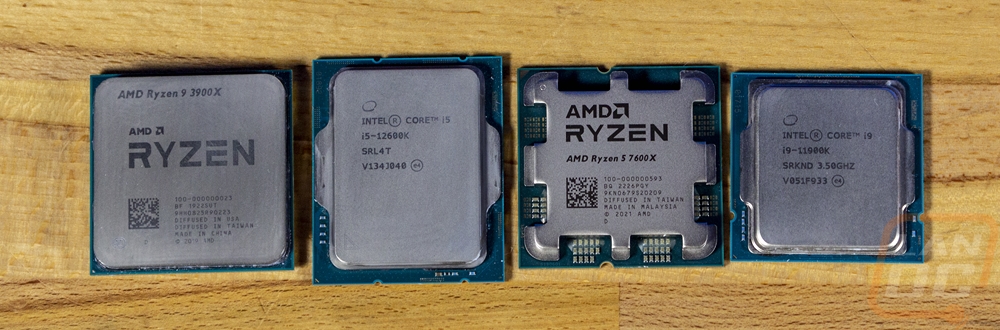
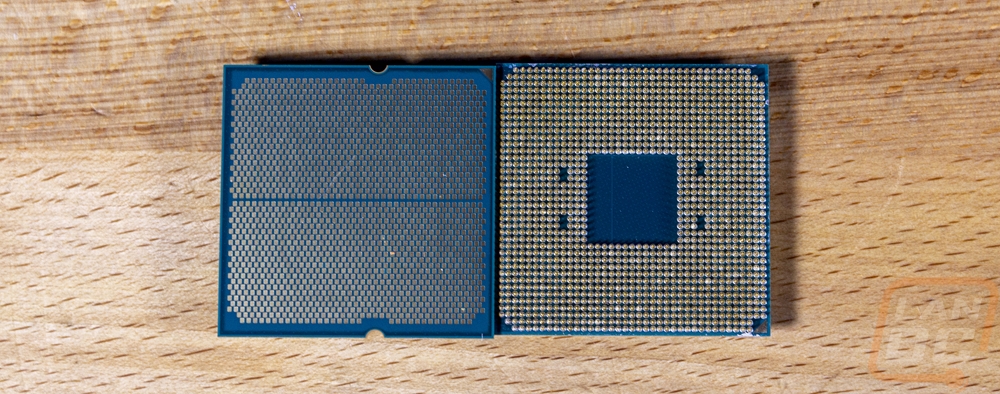
The new CPUs are the same 40mm x 40mm size but being LGA they look a lot more like an Intel CPU at first glance. The heatspreader on top though has an X-like shape which is unique and the heatspreader is much thicker than on an Intel CPU. Even with a little less heatspreader space, AMD is still etching the full AMD Ryzen logo along with the model number and other information. I’ve also included a comparison between the new CPU, an old Ryzen CPU, and both the LGA1700 and LGA1200 socket CPUs from Intel for size comparison.
Test Rig and Procedures
Test System
Motherboard: ASUS ROG Crosshair X670E Hero - Live Pricing
Cooling: Corsair iCUE H100i ELITE LCD Liquid CPU Cooler - Live Pricing
Noctua NT-H1 Thermal Paste - Live Pricing
Memory: G.Skill Trident Z5 Neo DDR5 16GBx2 6000MHz - Live Pricing
Storage: Corsair 2TB MP600 PCIe Gen 4 SSD - Live Pricing
Video Card: Nvidia RTX 3070 FE - Live Pricing
Power Supply: Corsair AX1200 - Live Pricing
Case: Primochill Wetbench - Live Pricing
OS: Windows 11 Pro 64-bit - Live Pricing
|
CPU Testing Procedures |
|
|
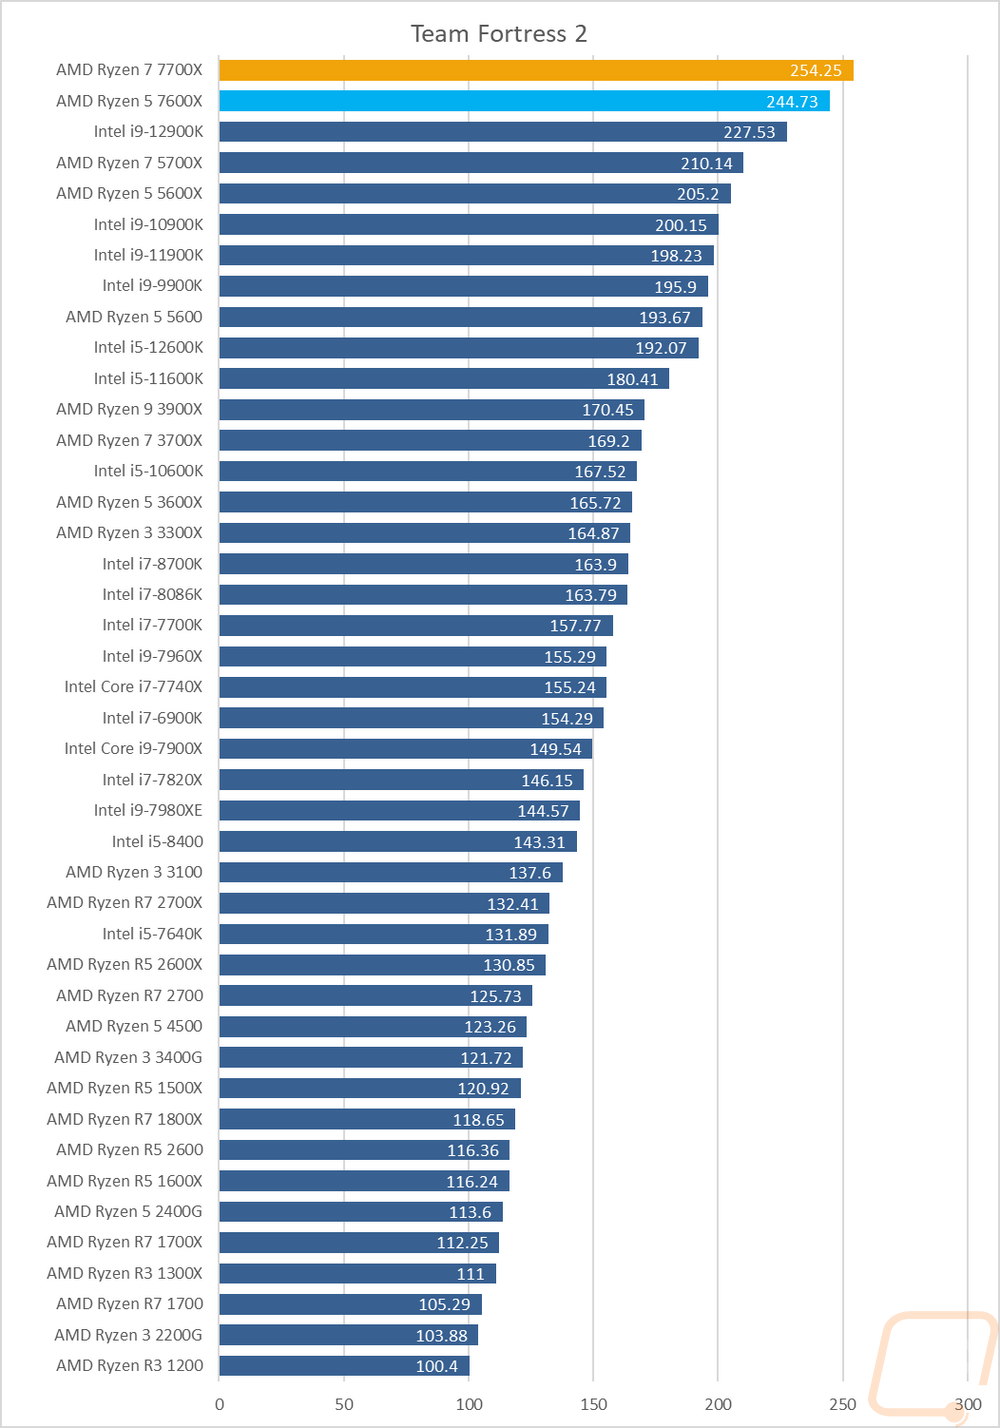
Team Fortress 2 |
|
|
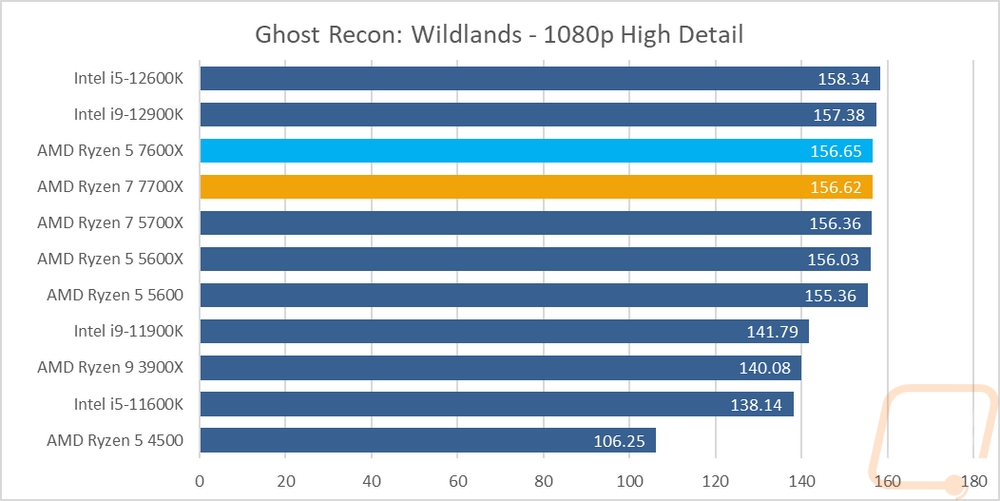
Tom Clancy's Ghost Recon: Wildlands |
Built-in Benchmark, 1080p, High detail setting |
|
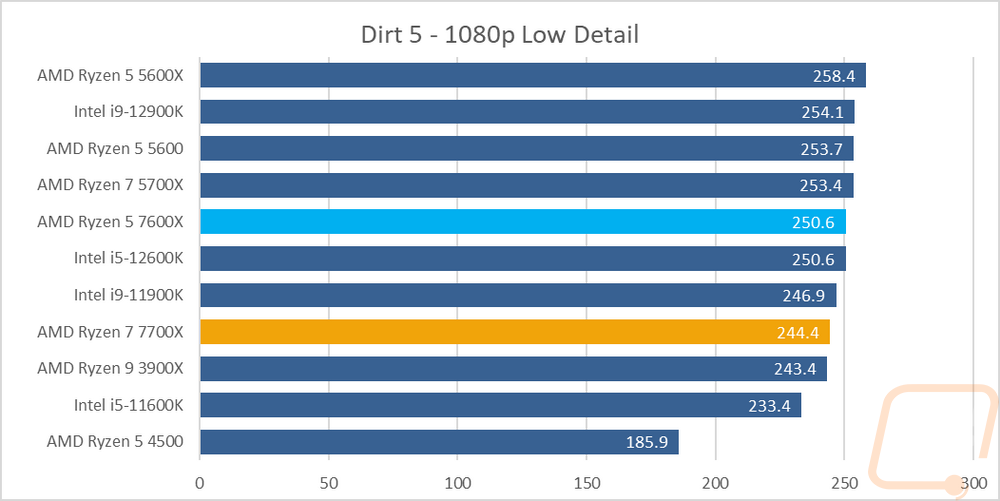
Dirt 5 |
Built-in benchmark, running at 1080p on all three resolution settings, V-Sync is turned off, dynamic resolution is turned off, and on the low detail setting |
|
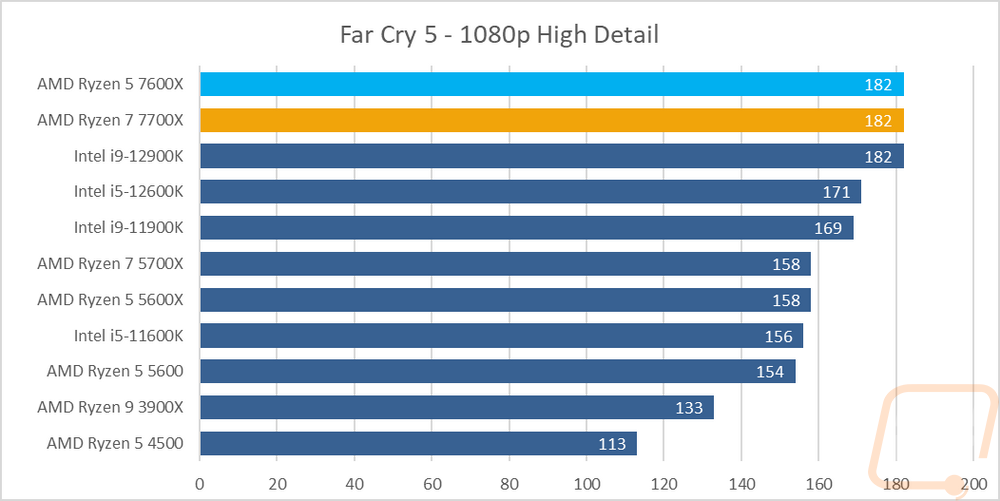
Far Cry 5 |
1080p with High Detail setting using built-in benchmark |
|
Shadow of the Tomb Raider |
Built in benchmark, gtx 1080Ti, 1080p, high detail setting, RTX/DLSS Off |
|
Metro Exodus |
Default benchmark low setting |
|
Watch Dogs Legion |
1080p, dx12, medium detail |
|
Borderlands 3 |
Built-in benchmark. fullscreen, 1080p, medium quality, dx11 |
|
Far Cry 6 |
1080p with High Detail setting using built-in benchmark |
|
Dolphin 5.0 Benchmark |
|
|
3DMark |
Fire Strike - Physics Score – Performance benchmark, Time Spy - CPU Score, and CPU Profile test |
|
7-Zip |
Built-in benchmark set to 32MB, run 4 or more passes. Combined MIPS, Compressing, and Decompressing scores all used. Just the Current result, not the resulting |
|
Jetstream |
|
|
wPrime |
1024M |
|
Cinebench R15 |
CPU and CPU (Single Core results) |
|
Cinebench R20 |
CPU and CPU (Single Core results) |
|
Cinebench R23 |
CPU and CPU (Single Core results) |
|
CPUz |
CPUz's built-in benchmark, both single and multi-core scores |
|
Passmark 9 |
CPU Mark Score |
|
Passmark 10 |
CPU Mark Score |
|
PCMark 10 |
Normal test ran, not the express or extended |
|
Procyon |
Office productivity benchmark is done with the current Microsoft Office 365, Photo Editing Benchmark is done with Adobe Photoshop and Lightroom Classic. Video Editing Benchmark uses Adobe Premiere Pro. All adobe products are running on the latest version at the time of testing |
|
V-Ray |
CPU Benchmark time used as the score |
|
POV-Ray |
Using built-in benchmark. Settings are all set to the "Standard Benchmark Switches" listed on https://www.povray.org/download/benchmark.php |
|
Handbrake |
Tested using 2d 4k 60 FPS version, resized using the Fast 1080p30 preset, average FPS used. Here is the file download location https://bbb3d.renderfarming.net/download.html |
|
Blender |
Using new official benchmark using 3.1.0 |
|
AIDA64 |
Memory, Cache, and FLOPS testing done with built-in GPGPU and Memory benchmarks |
|
Temps |
Aida64 FPU stability test to load and to record temperature readings |
|
Power Usage |
Idle and load testing using a Kill-A-Watt and wPrime to put the CPU under load and again with the AIDA64 FPU CPU workload |
|
Onboard Testing Procedures |
|
|
Borderlands 3 |
In-Game benchmark, 1080p, Low detail preset |
|
Tomb Raider |
Adrenaline Action Benchmark Tool on the “Medium” quality setting at 1080p |
|
Hitman: Absolution |
Adrenaline Action Benchmark Tool on the “Medium” quality setting at 1080p |
|
Far Cry 5 |
1080p, Lowest Detail setting, In game benchmark |
|
Shadow of the Tomb Raider |
1080p, Low Detail setting, In game benchmark, RTX/DLSS off |
|
Team Fortress 2 |
1080p – high, very high, high, reflect world, high, enabled, 8x msaa, x16, multicore on. https://bit.ly/2vOebin |
|
Unigine Superposition |
720p Low and 1080p Medium settings |
|
Cinebench R15 |
OpenGL benchmark |
|
3DMark Fire Strike |
Performance setting – GPU Score |
|
3DMark Time Spy |
GPU Score |
|
Tom Clancy's Ghost Recon: Wildlands |
Built-in Benchmark, 1080p, Low detail setting |
CPU Performance
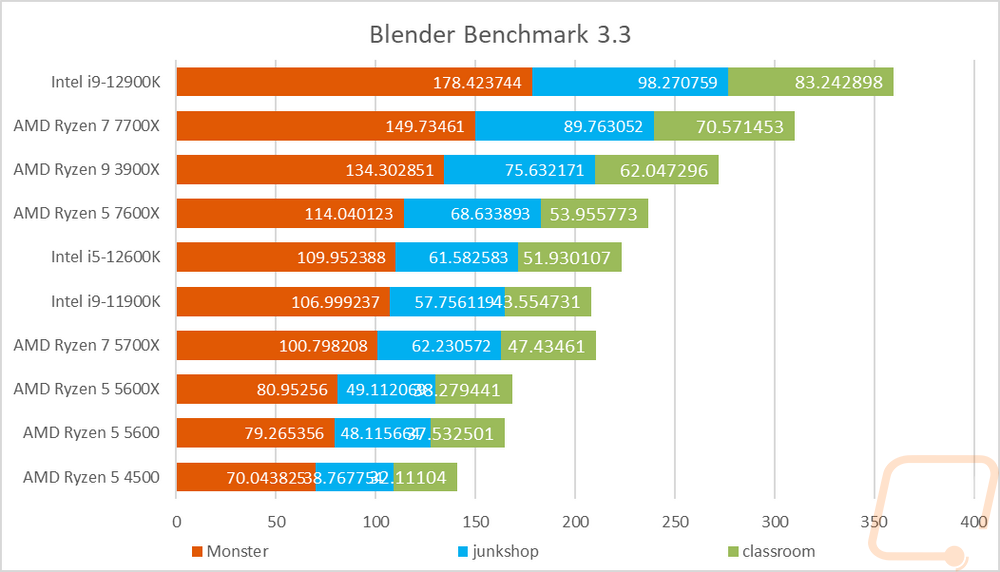
To start testing off I went with a rendering-focused benchmark with the always popular Blender. This benchmark was recently updated so our result list is smaller here. I have all three tests stacked together so we can see an overall of them altogether. Blender loves the higher core counts so the older 3900X did well here. The 12900K still tops this chart but the 7700X is surprisingly next up in this short list with its 8 cores and high clock speeds. The 7600X outperforms the 12600K and the prior Intel flagship i9-11900K as well.
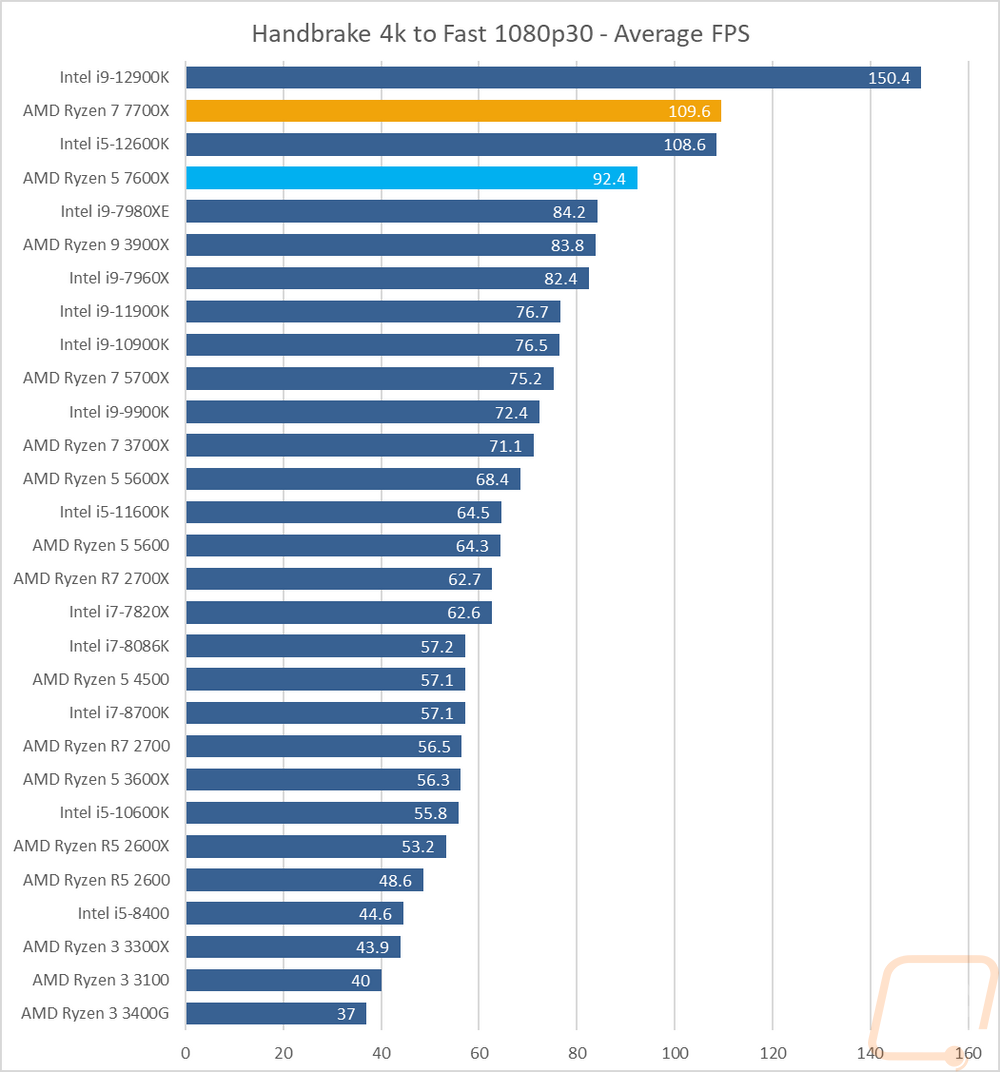
Continuing with the video encoding theme I also have Handbrake which is an open-source transcoder. For this test I am taking a 4k video down to 1080p 30 FPS, the results are the average FPS of that task. The 7700X did well at 109.6 FPS and the 7600X did 92.4 FPS. That was enough to put the 7700X just a hair ahead of the 12600K but the 12900K is way out in front on this test.
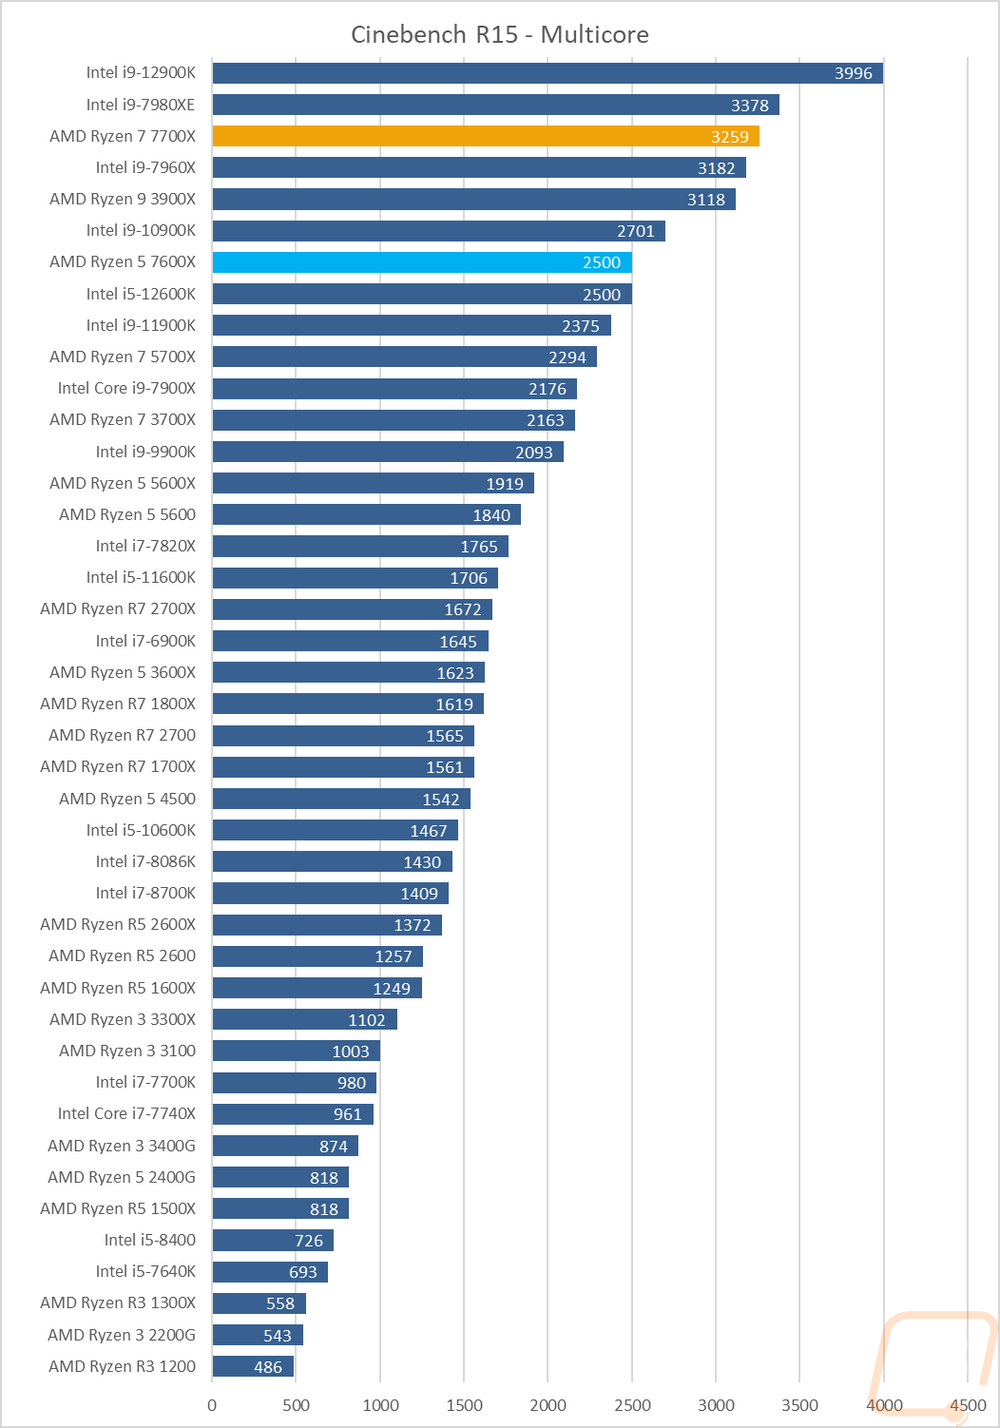
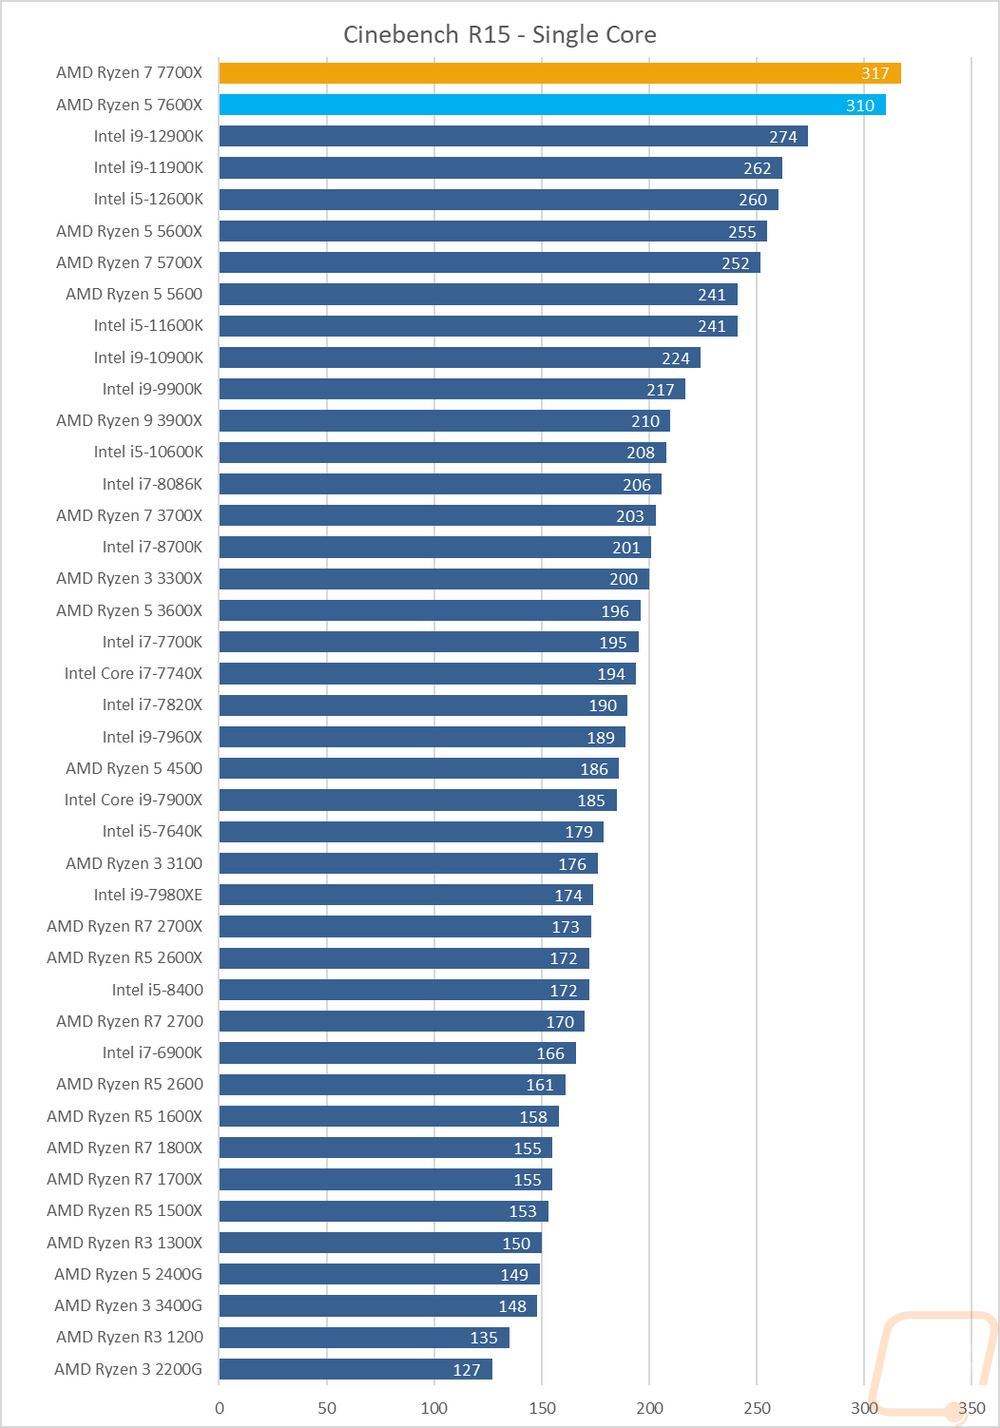
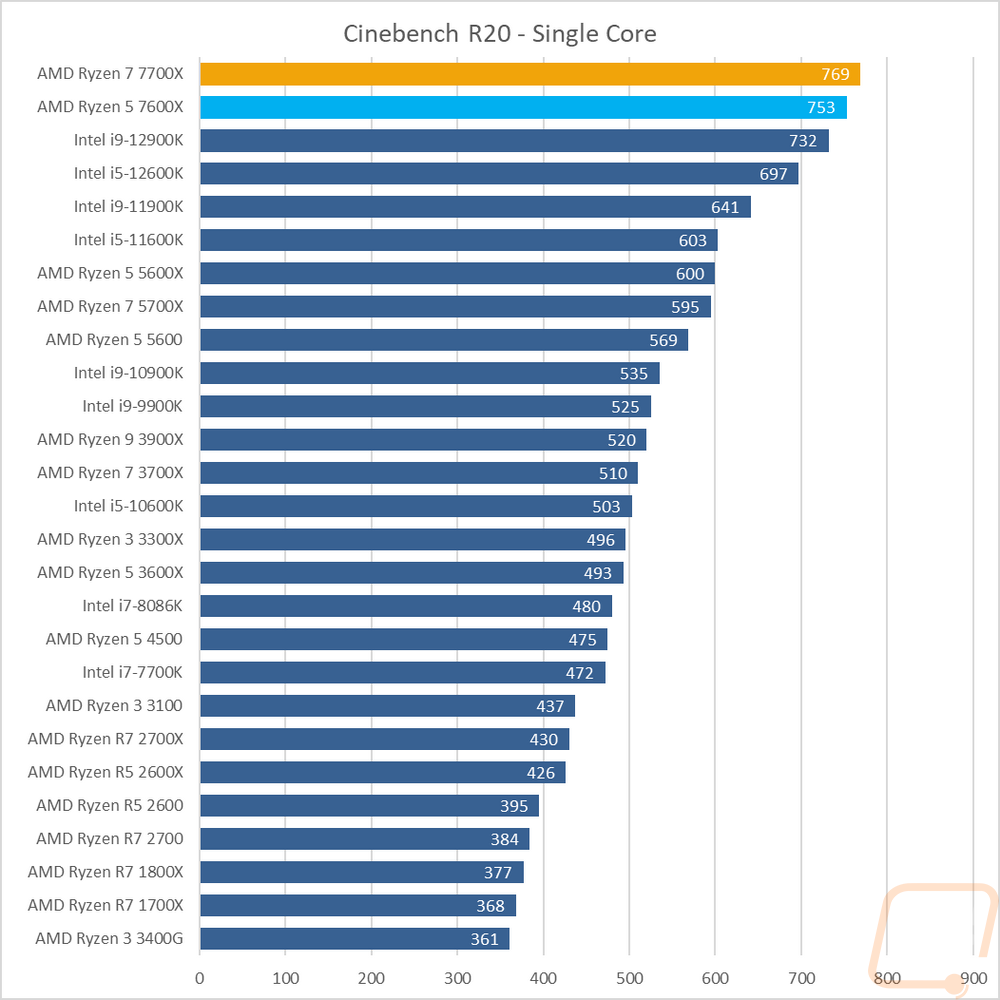
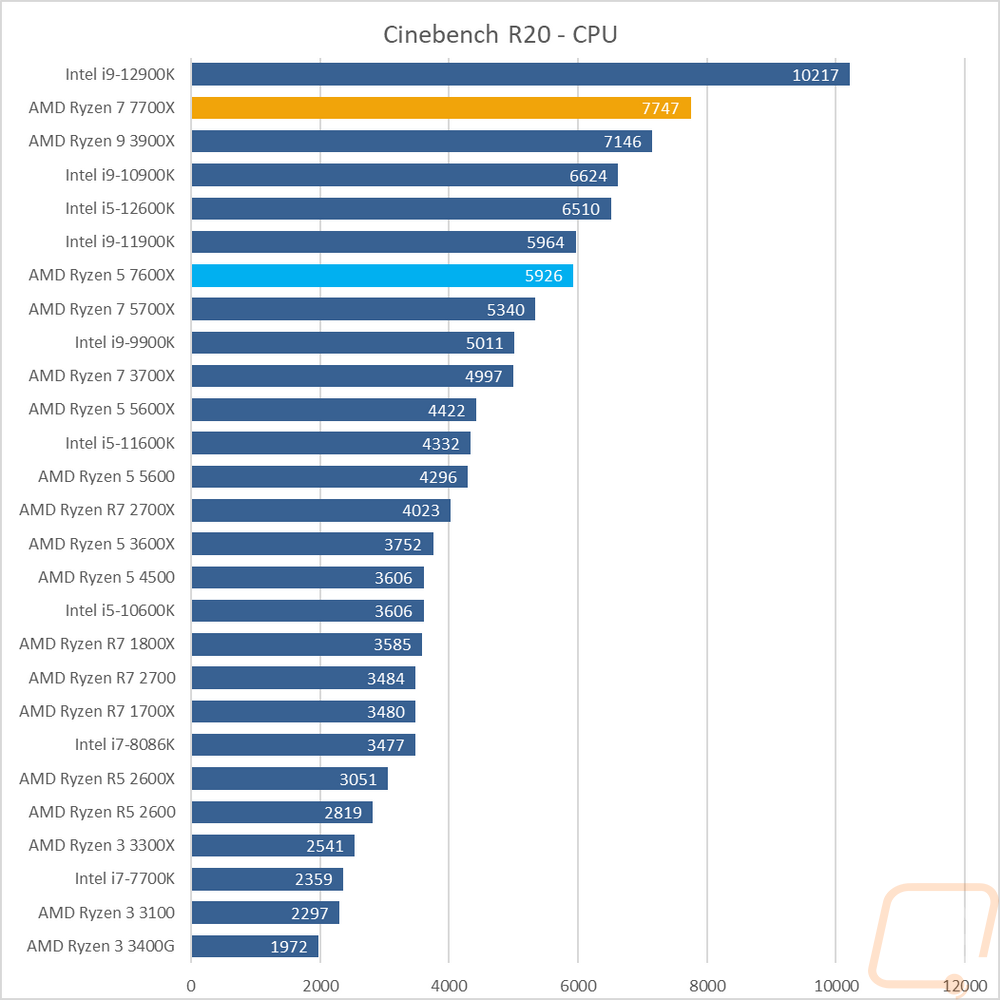
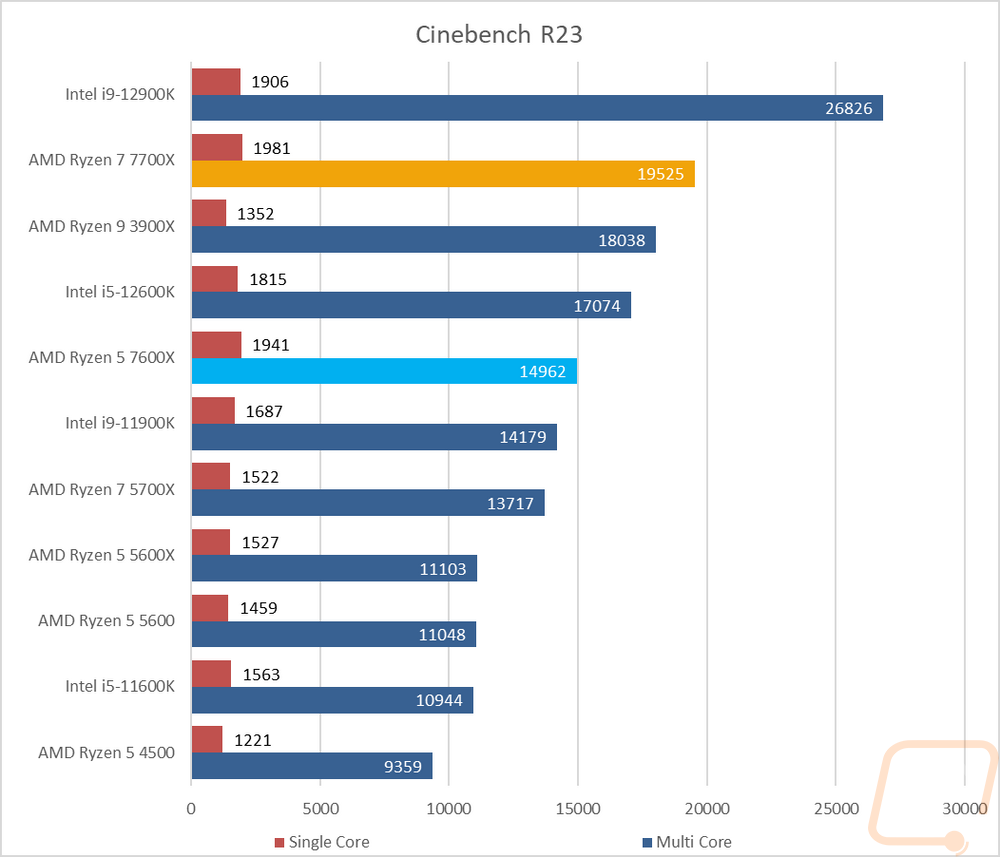
For the always popular Cinebench, I ran the three most recent versions. These are once again rendering and the latest R23 test is the most relevant for current applications but I love being able to see how everything compares in some of the older tests as well. In R15 the 7700X is up near the top with the high core count CPUs which is impressive given it just has 8 cores. The 7600X on the other hand is tied right with the 12600K which has 6 performance cores and 4 e cores. For the R15 single-core test, however, both Zen 4 CPUs are way out ahead with their high clock speeds and IPC performance. For Cinebench R20 both are at the top again in the single-core test with a big gap between even the 7600X and the 12900K. The Cinebench R20 multi-core test still has the 12900K with its 8 p cores and 8 e cores way out in front. The 7700X did have enough to outperform everything else though and the 7600X is tied up with the 11900K. Then in the latest Cinebench R23, the multi-core test is similar again with the 12900K out in front, the 7700X, then the old 3900X with its 12 cores as the top three. The 7600X sits ahead of the 11900K but behind the 12600K. The single core results in R23 on the other hand have both Zen 4 CPUs out in front once again.
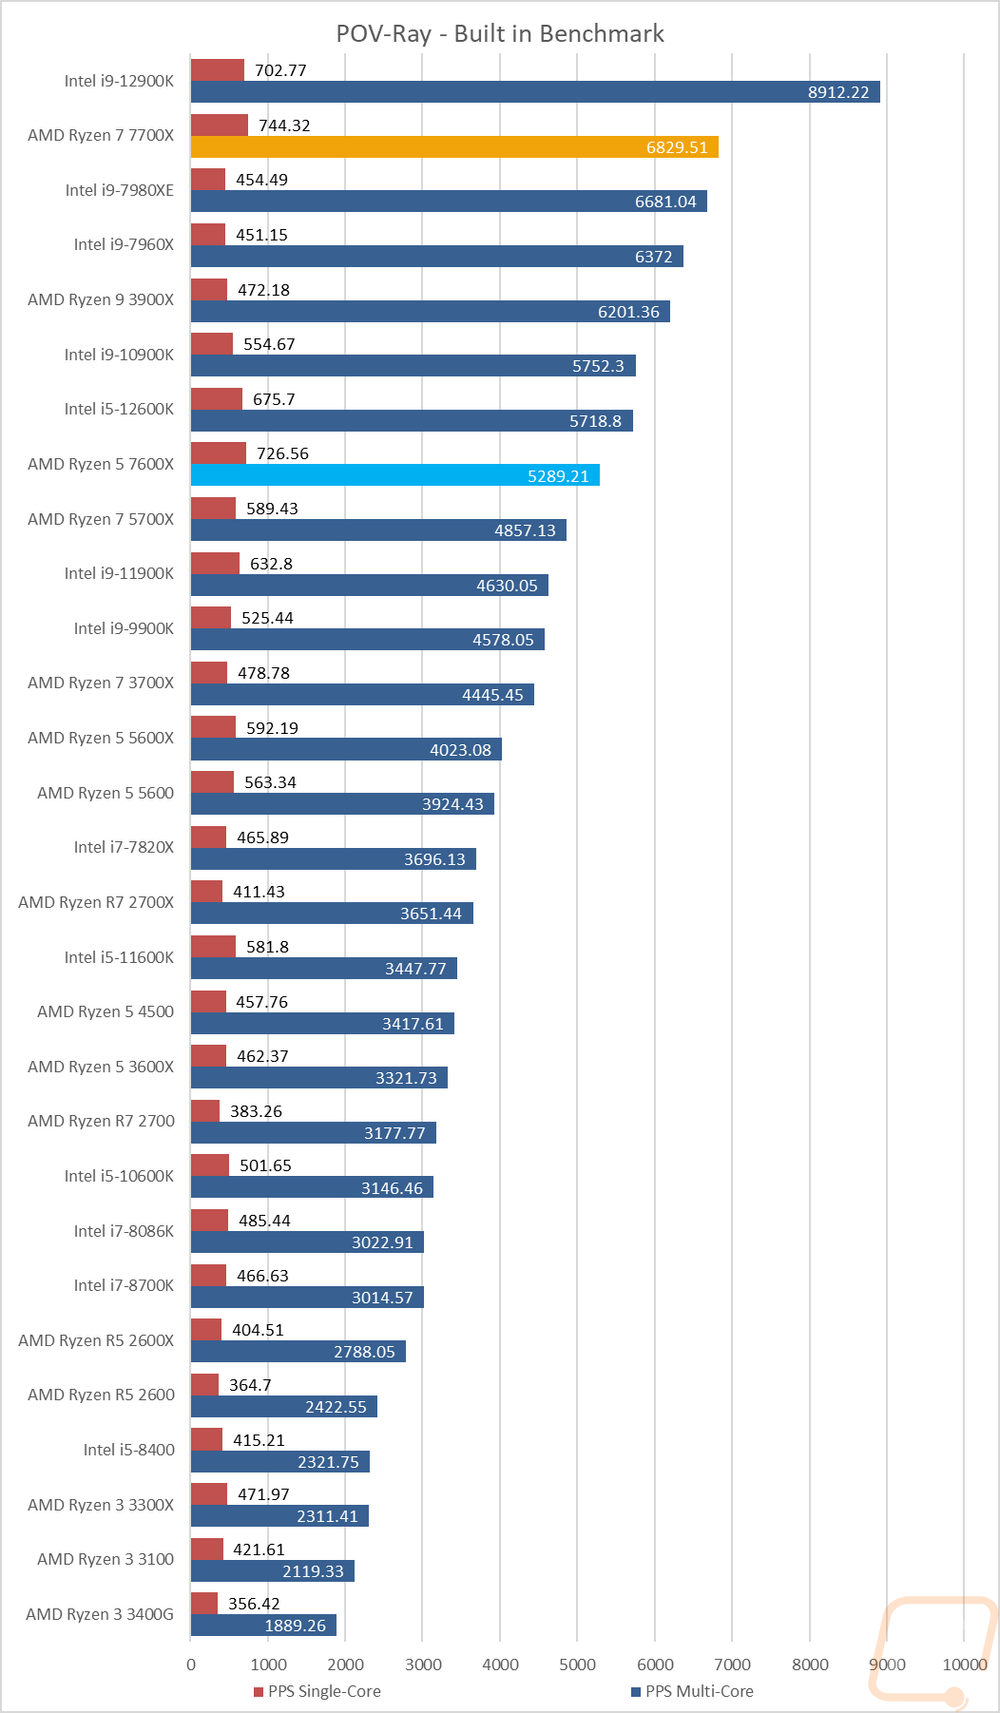
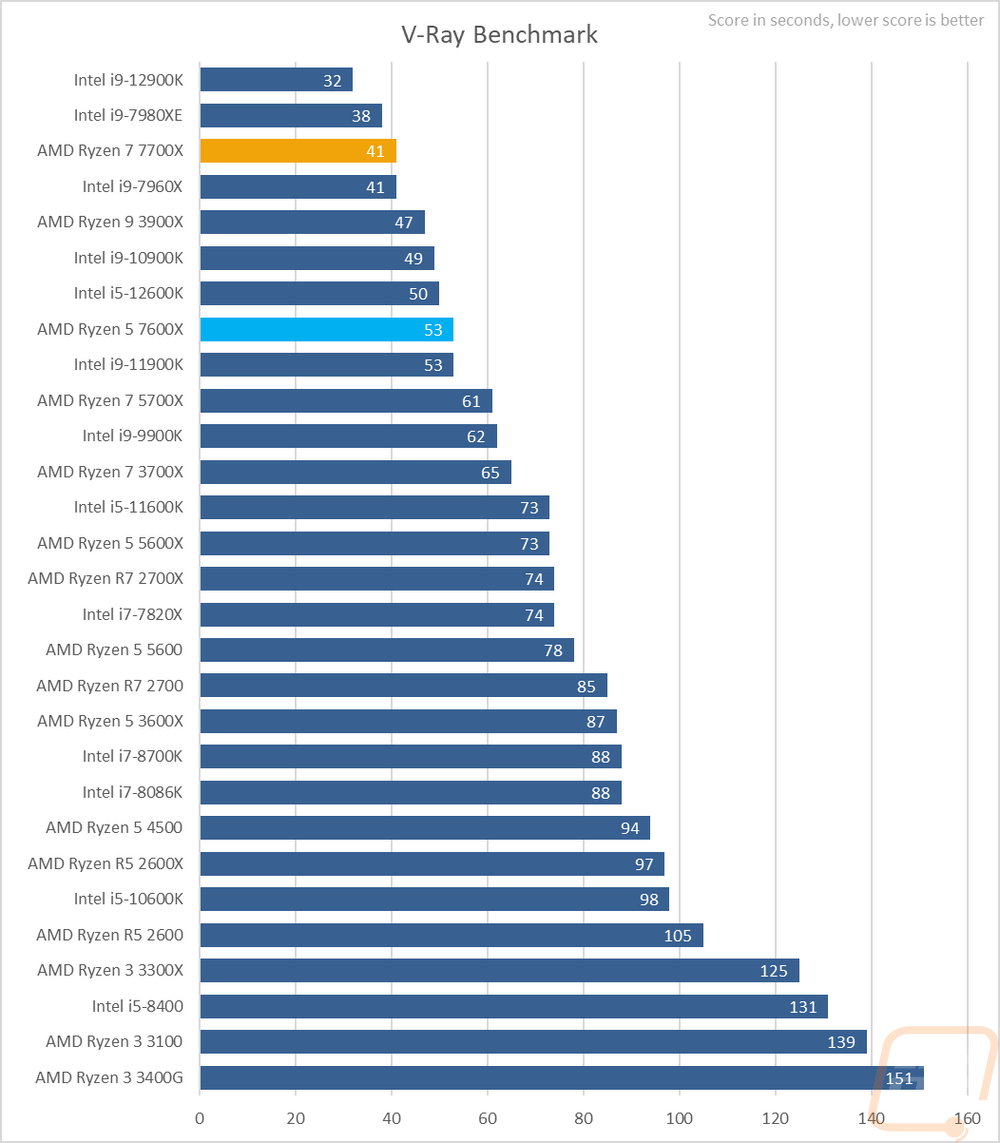
Next up we have ray tracing focused rendering benchmarks. Here I tested the CPUs in POV-Ray and V-Ray. POV-Ray was also tested with a single core and across all of the cores. In POC-Ray the 12900K is out in front by a big margin for the multi-core test with the 7700X the next closest tested and the 7600X is back behind the 12600K but the single core performance has both way out ahead. In V-Ray, the 12900K is up top with the old 7980XE and its 18 cores still lingering up at the top but the 7700X overcame the rest of the high core count CPUs to be behind it. The 7600X is behind the 12600K and its 10 cores and ahead of the 11900K.
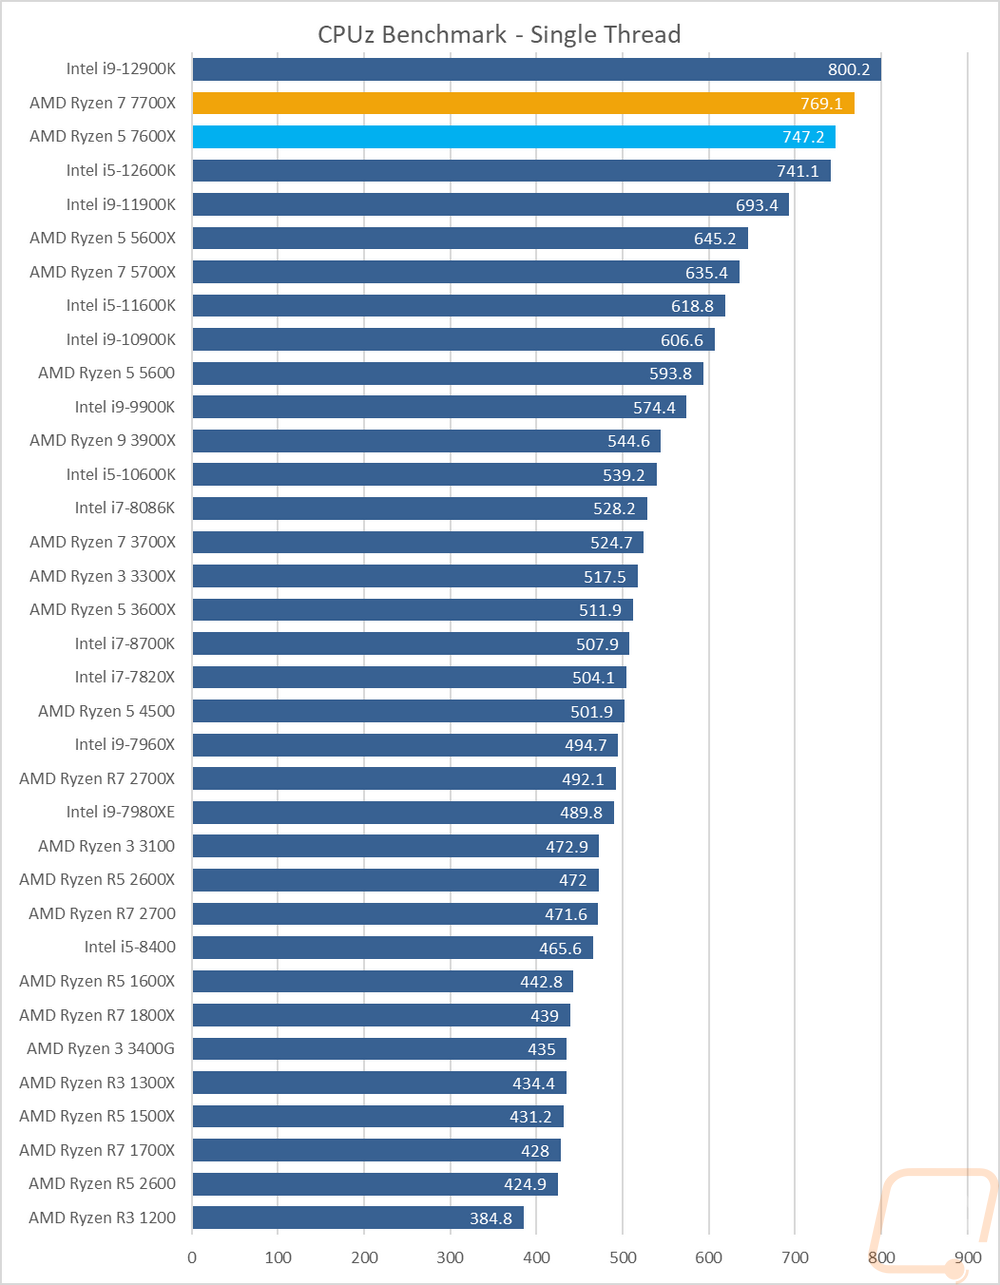
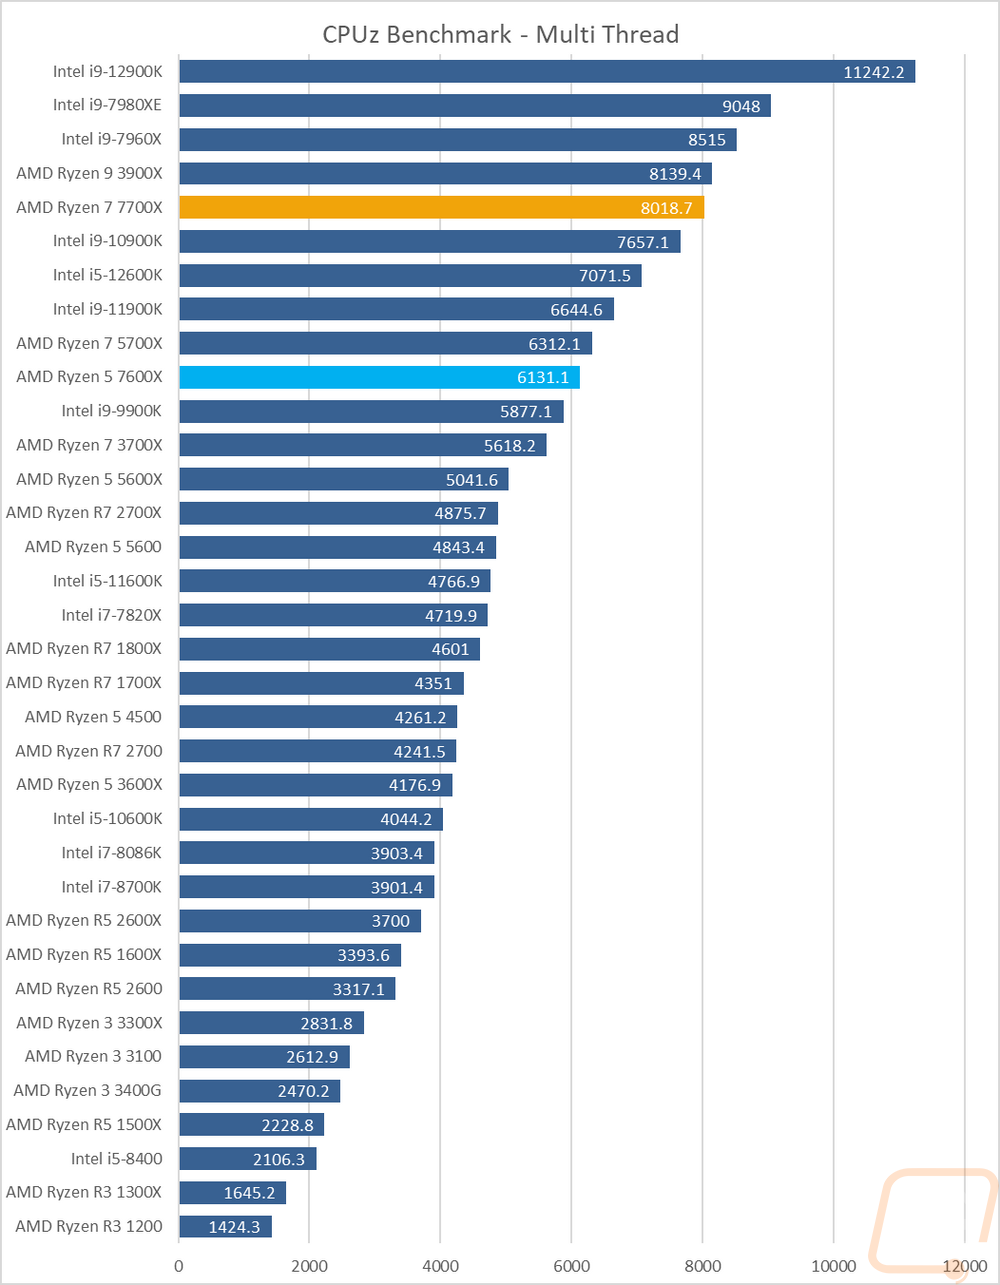
I also tested using the CPUz’s built-in benchmark which does run on a single thread and with all threads. I think this is the only result that shows the 12900K ahead in a single-threaded test but just behind it is the 7700X and then the 7600X. The multi-thread CPUz test on the other hand mixes in more of the old high core count CPUs up at the top putting the 7700X behind the 3900X. The 7600X on the other hand is sitting ahead of the 9900K and just behind the 5700X with its two extra cores.
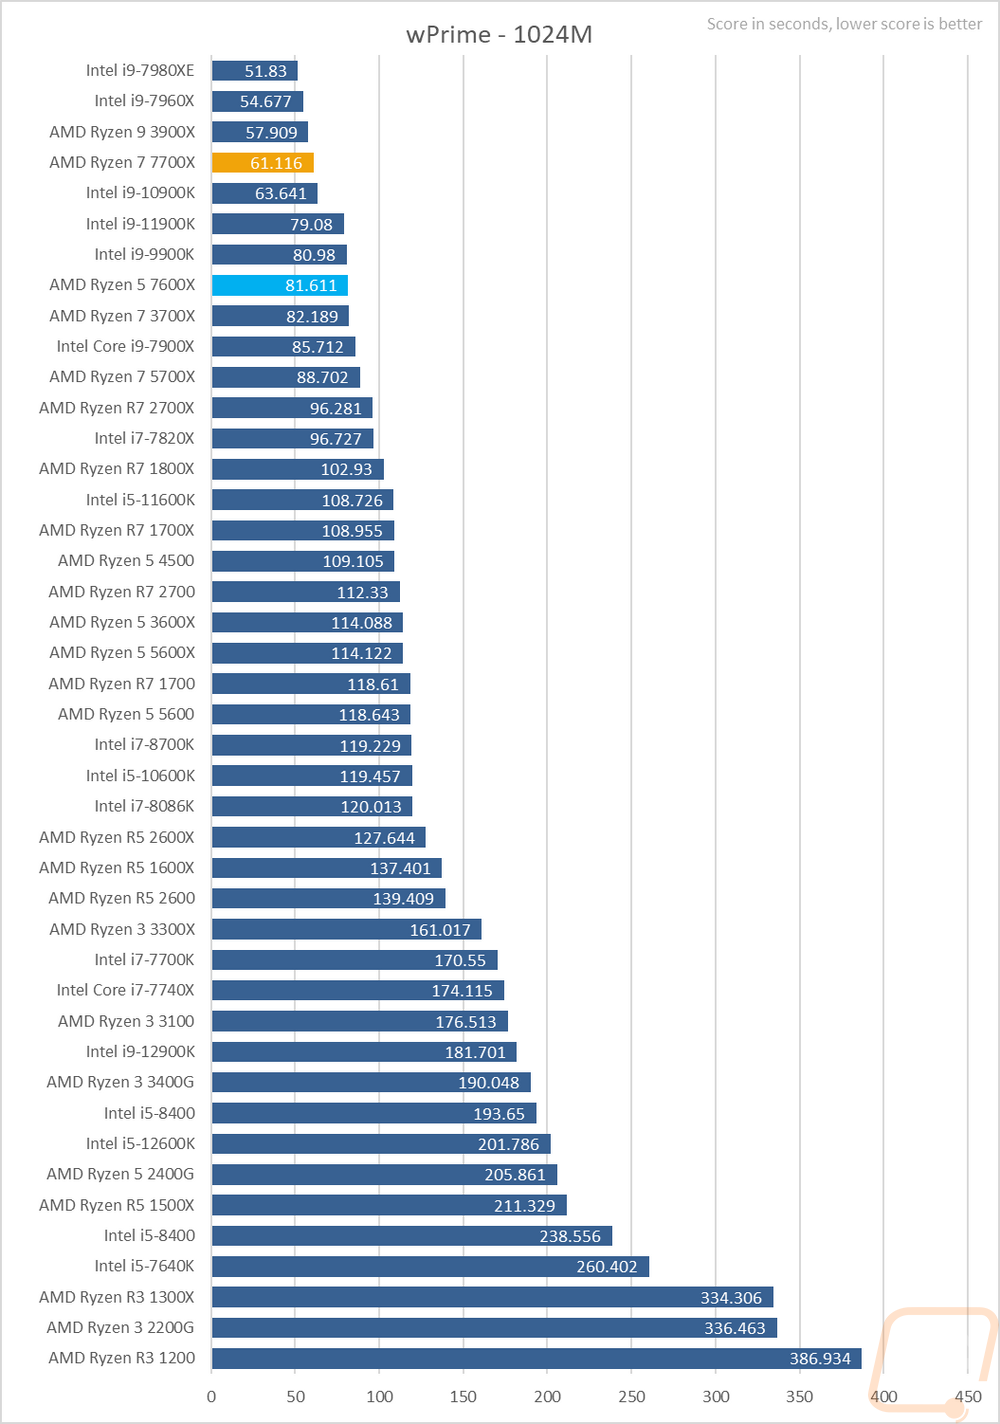
Next, we have wPrime which is a classic overclocking benchmark that calculates pi out to 1024 million digits and is timed. This is a multi-thread heavy test which has the older high core count CPUs still all over the top of the charts but the 7700X did extremely well here given its 8 cores sitting behind the 3900X and ahead of the 10900K with its 10 cores even. The 7600X is then behind the 9900K and ahead of the 3700X.
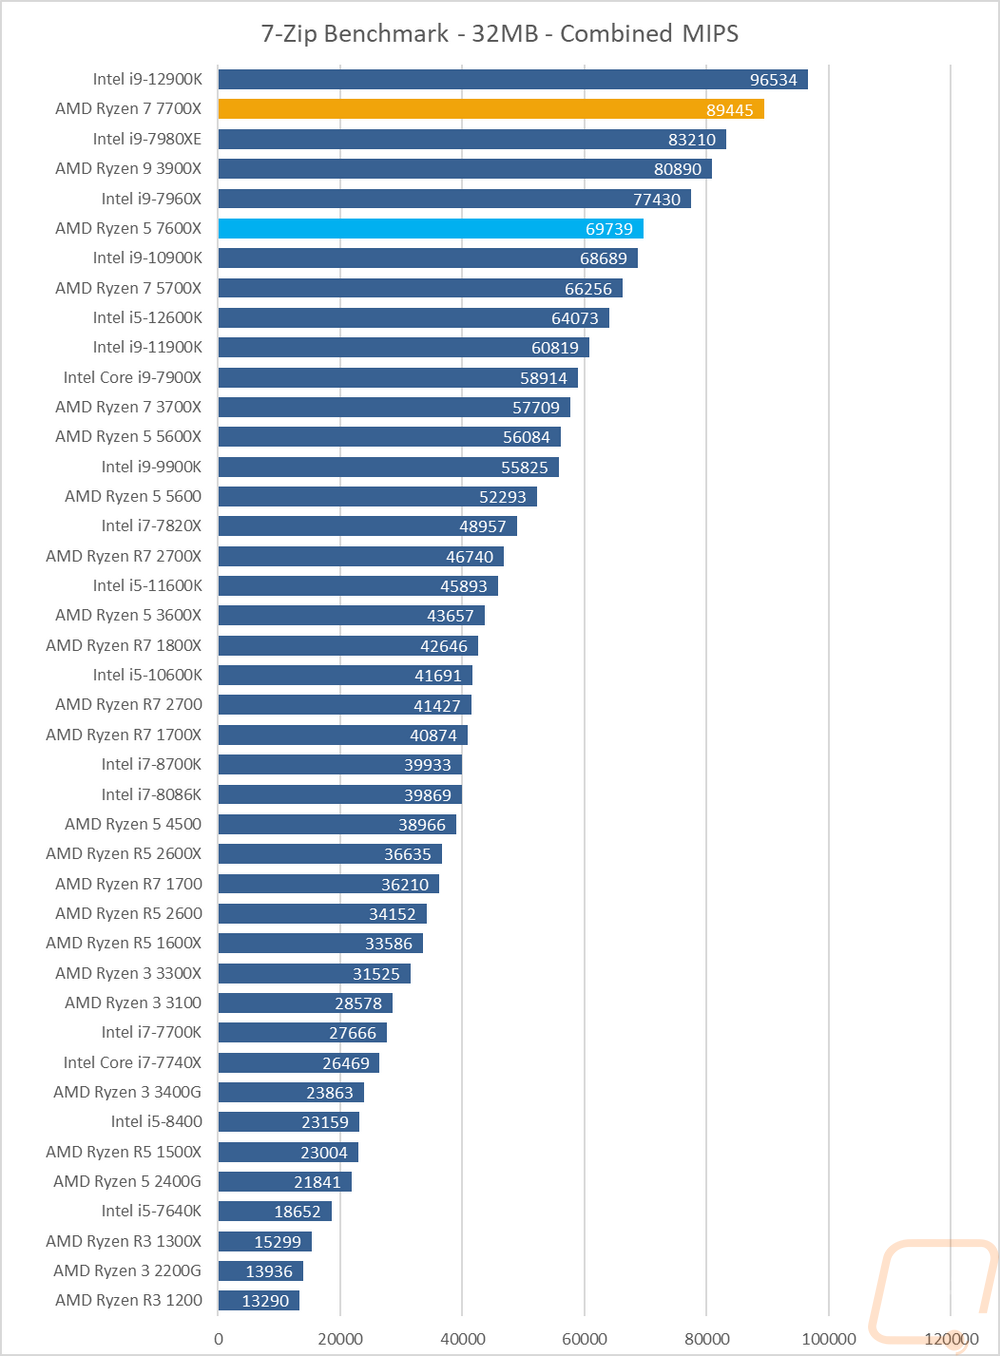
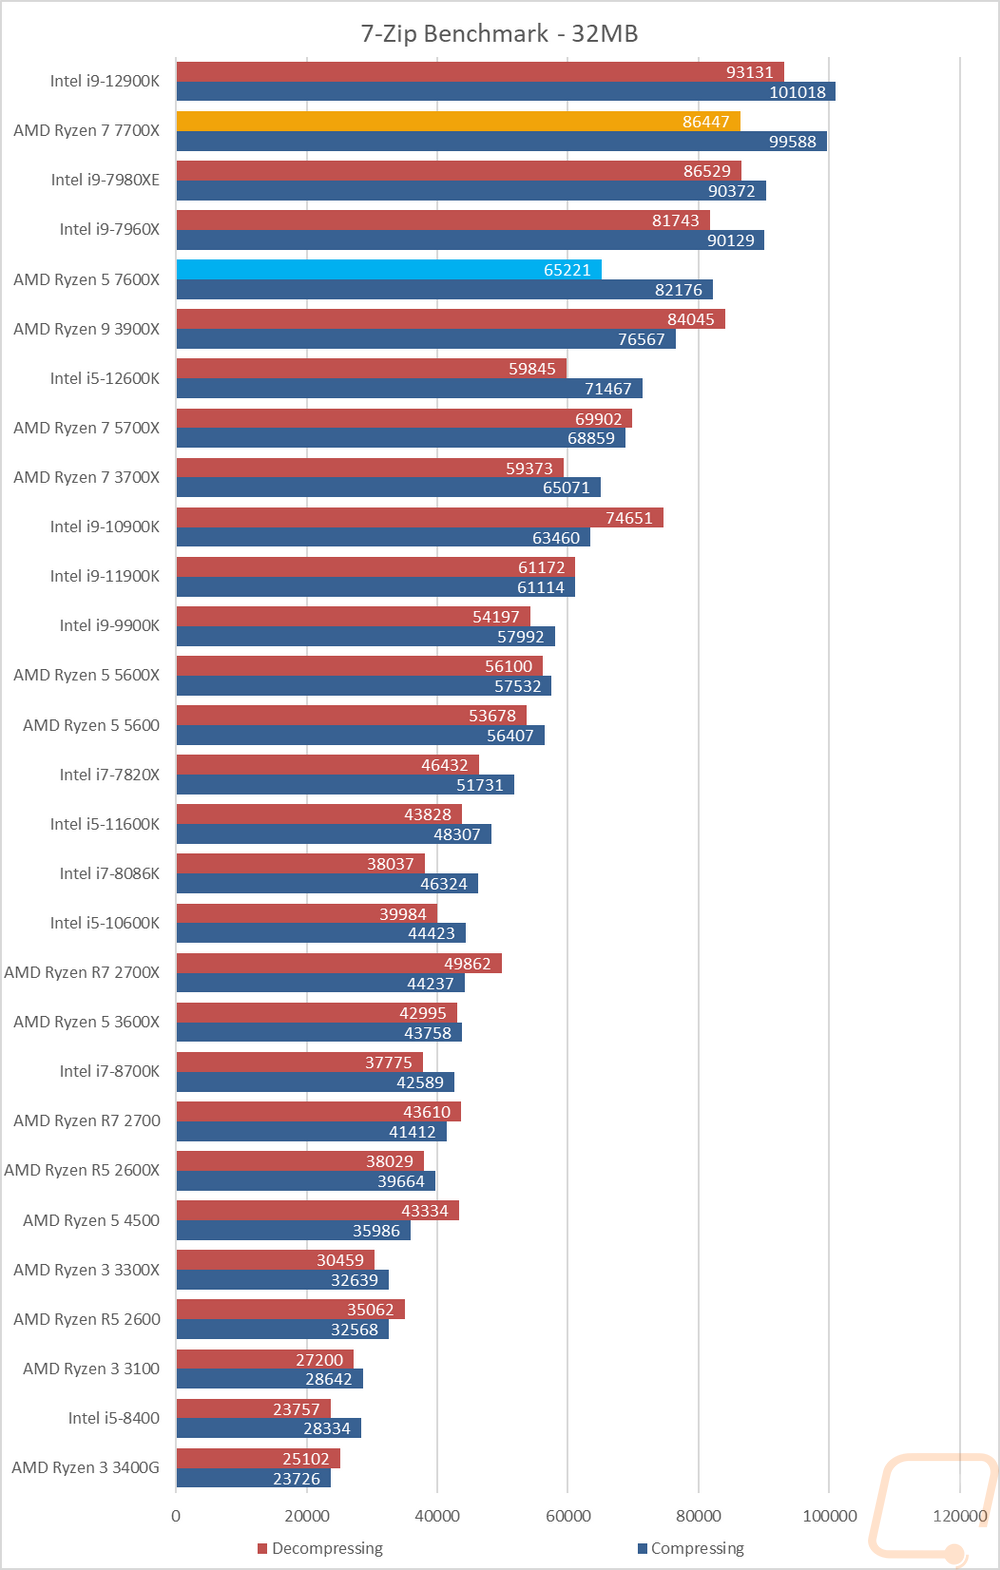
7 Zip is another open-source program, this time for compressing and decompressing all of your files. Here I have run the benchmark and we have three results. The combined MIPS is a combination of compressing and decompressing performance. Then I have it broken down between the two. This workload likes extra cores which can be seen with the CPUs that are up at the top being some of the older high core count CPUs that I have tested in the past. The 7700X came in behind the 12900K with its 16 cores and ahead of the old 7980XE and its 18 cores showing that with enough clock speed and IPC performance you can overcome the advantage that lots of cores can get you in 7 Zip performance. The 7600X with two fewer cores did well as well sitting up ahead of the 10900K. The decompressing and compressing numbers were similar overall but they do show both CPUs having a harder time with the decompressing than compressing.
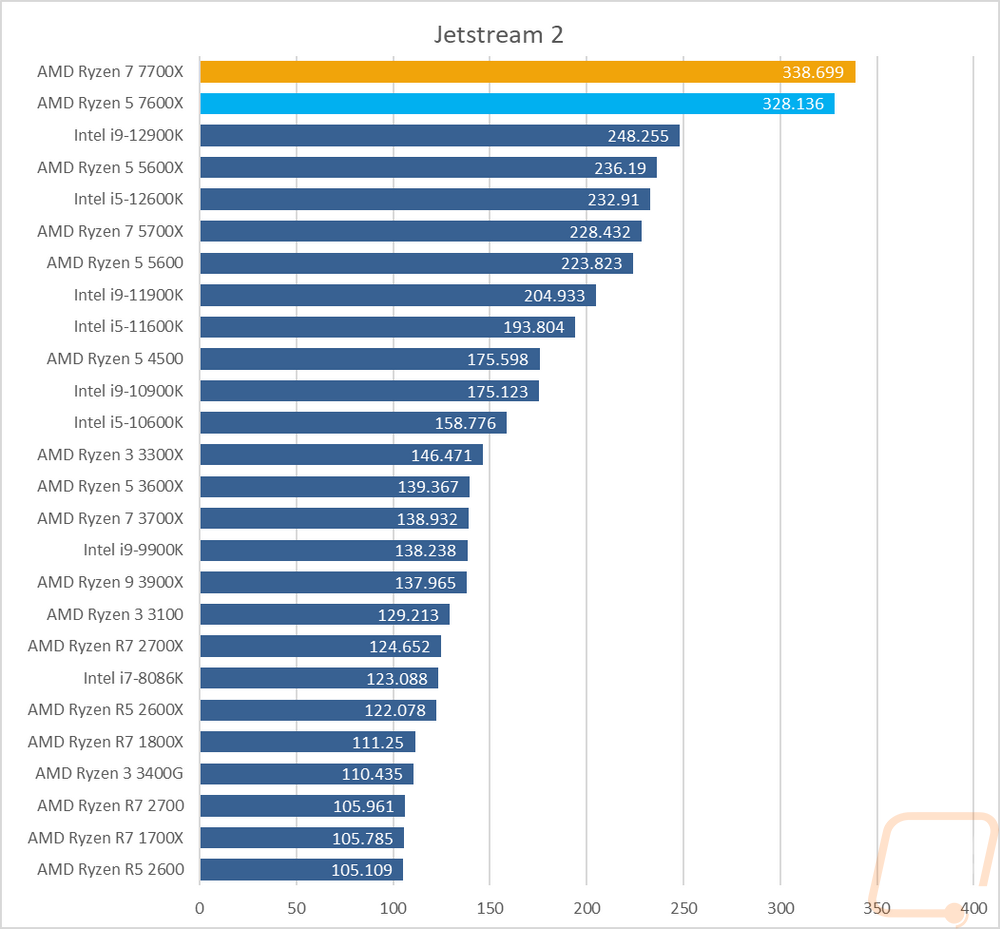
Jetstream 2 is a compilation benchmark that takes a long list of HTML5 and Java in-browser tests and runs them all three times and puts together an overall score. I love this benchmark because let's be honest, most people are using their browser more than any other game or program. Jetstream gives some interesting results sometimes though but it tends to prefer high IPC or single-core performance and there are some situations where it prefers lower core count CPUs which we can see here with the 7700X and 7600X with their high IPC and clock speeds just demolishing everything else.
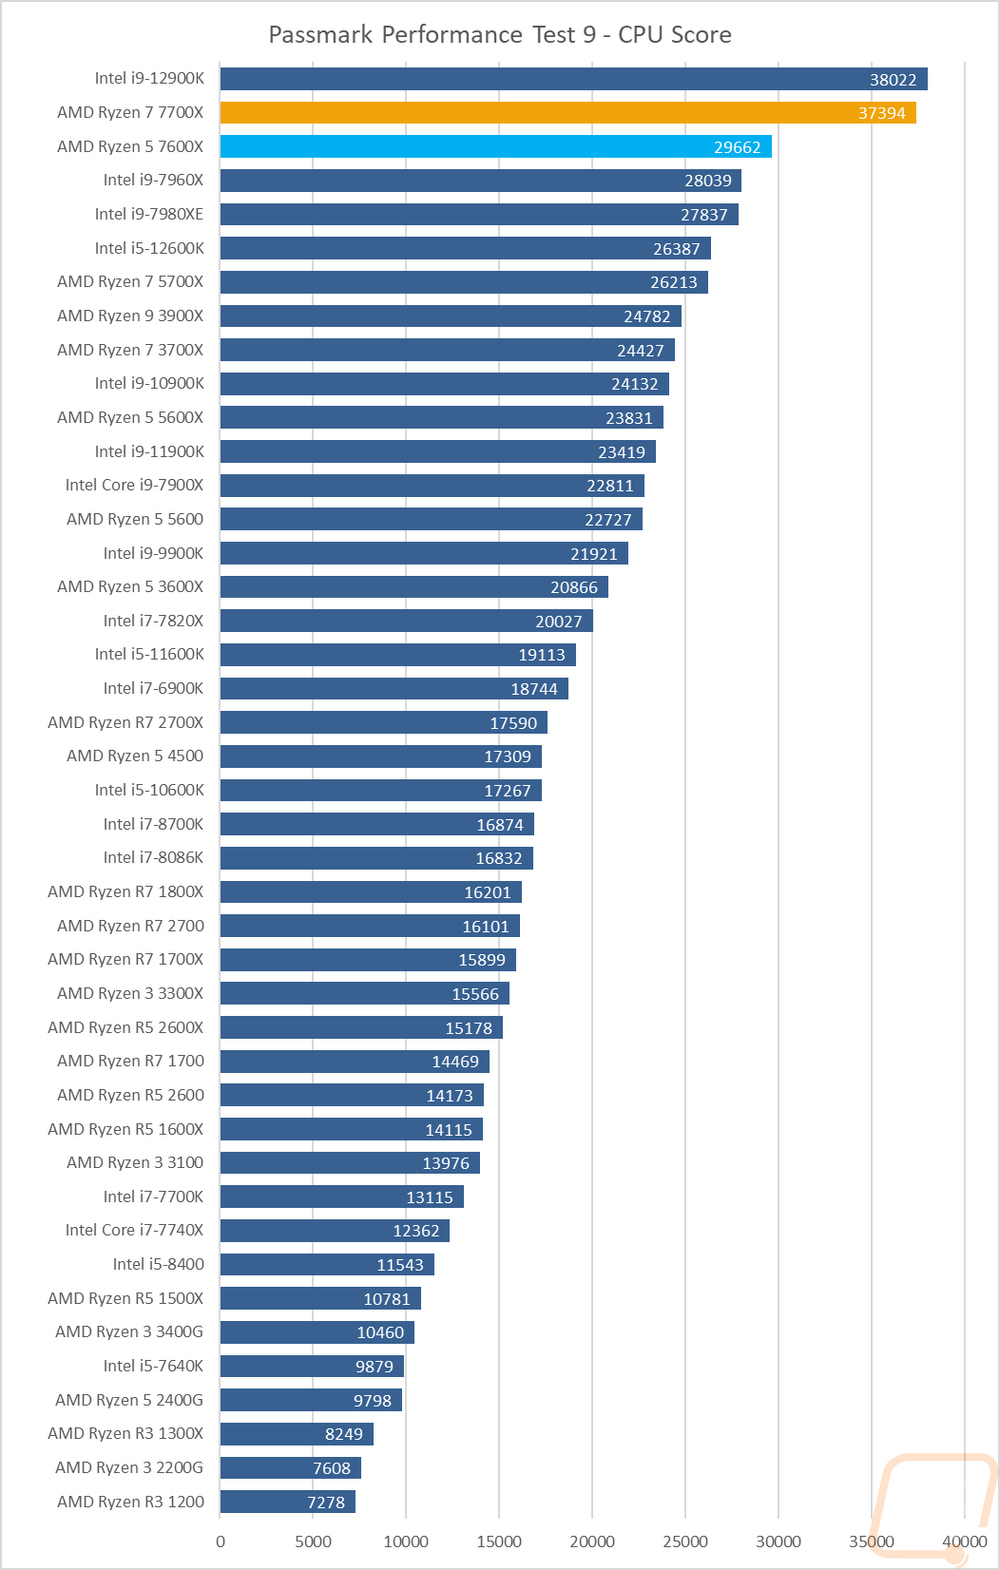
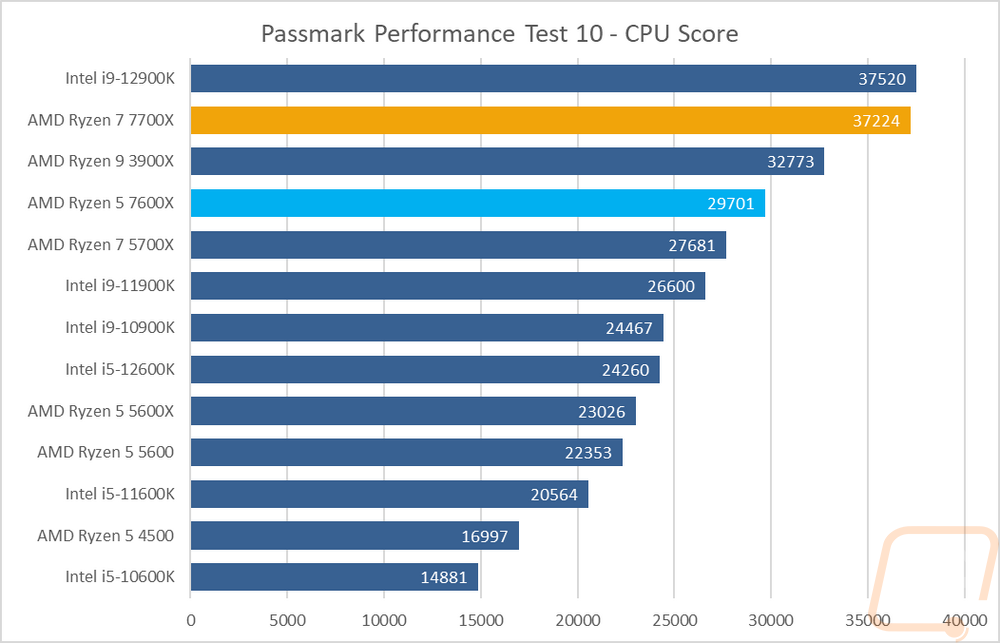
For Passmark Performance Test I took a look at both the older version 9 and the newer version 10. On both, I only look at the overall CPU score which takes a few different synthetic benchmarks and combines the results to put together an overall score. The Zen 4 CPUs as well as the Intel i9-12900K are way out ahead of all of the other CPUs tested in Passmark 9. In Passmark Performance Test 10 the 7600X drops down behind the 3900X which has 12 cores but is out ahead of the 5700X and others.
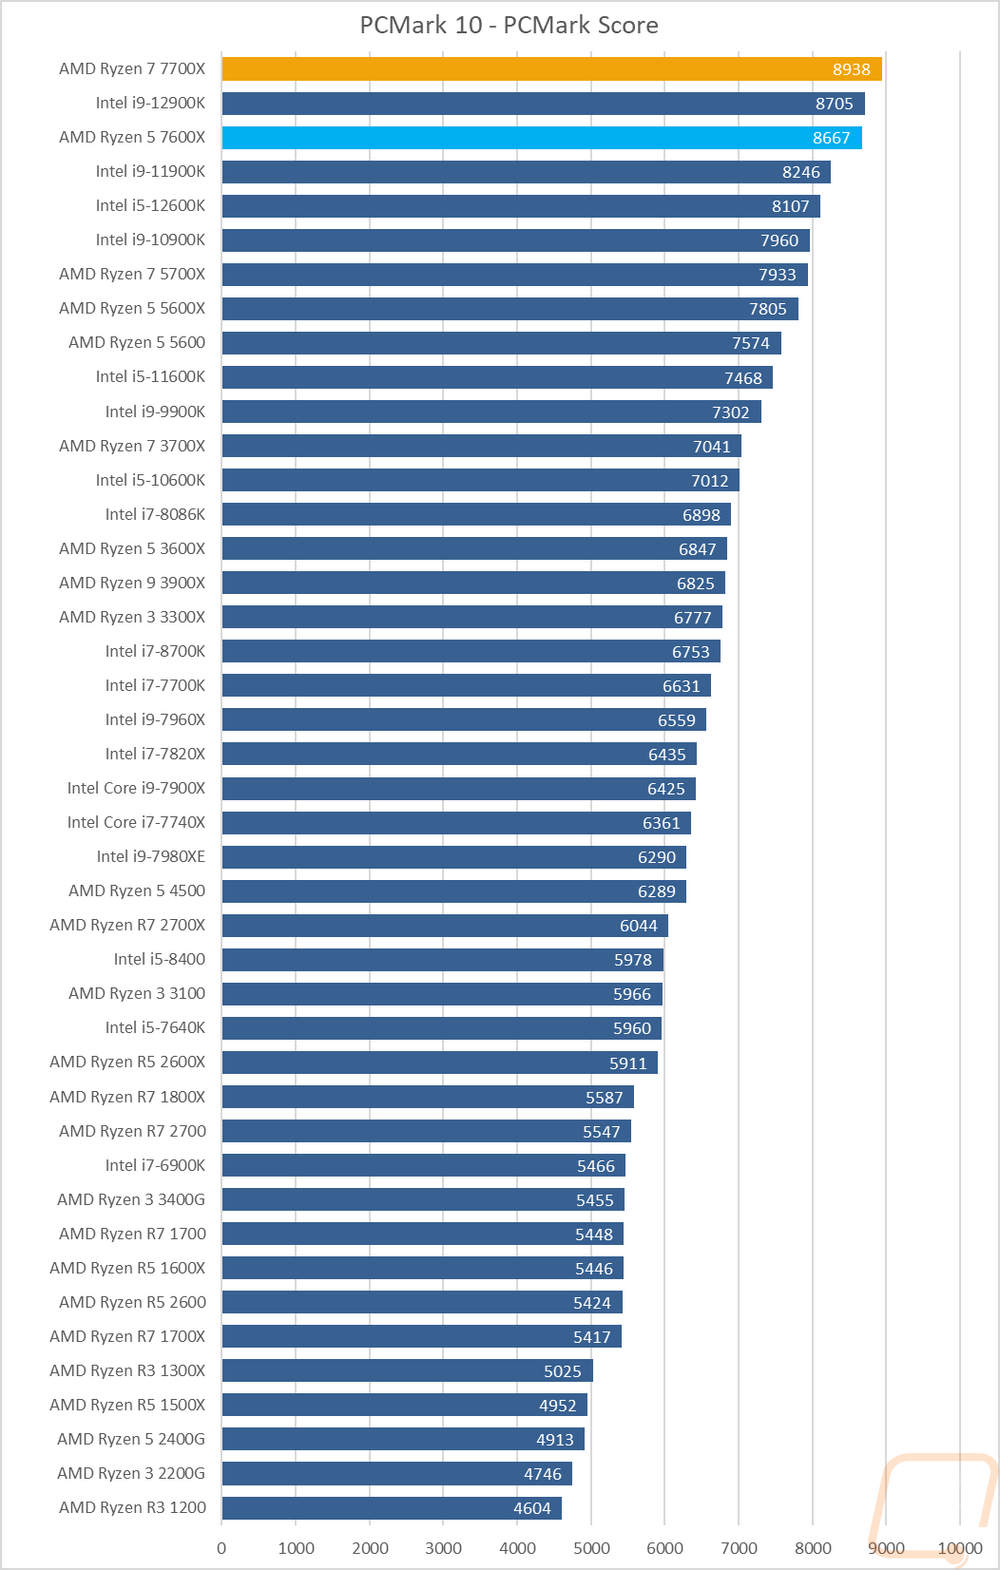
PCMark 10 is a great test because it tests things like video calls, browser performance, excel, and word performance to give an idea of real-world performance. It tends to like higher clock speeds which you can see all of the 5 GHz CPUs up at the top. The two Zen 4 CPUs which both have higher than 5 GHz boost clocks did well here with the 7700X out in front over the 12900K and the 7600X just behind the 12900K.
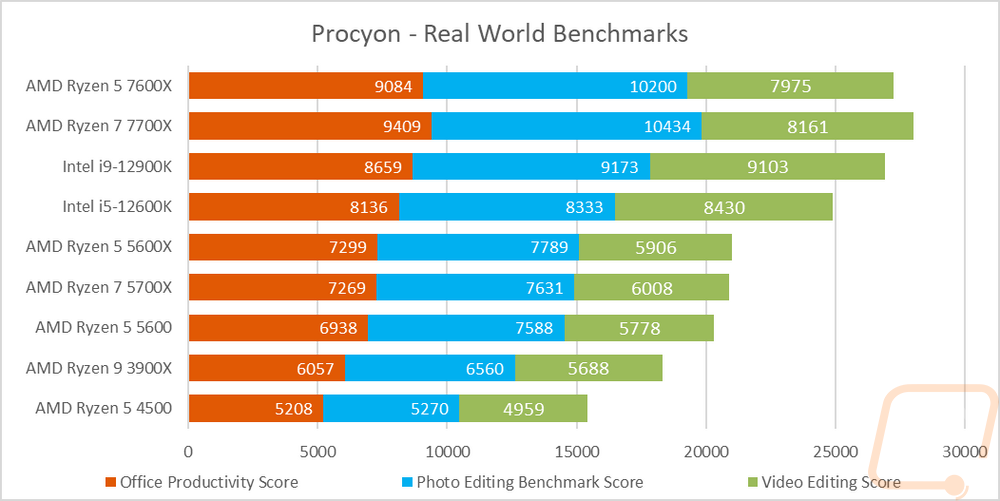
We recently added even more real-world testing with the UL Procyon Benchmarks which are as real-world as they can get using the actual programs that you would use in each test. There are three overall benchmarks, first is the Office Productivity Benchmark which uses Microsoft Office 365 to test actual performance in word, excel, PowerPoint, and outlook. The second benchmark is the Photo Editing Benchmark which is run using the latest version of Photoshop as well as Lightroom Classic to look at photo editing performance. Then the last test is the Video Editing Benchmark which uses the latest version of Adobe Premiere Pro to test video editing performance. I have all three scores stacked together to get an overall look at the performance. Both Zen 4 CPUs did extremely well here with the 7700X and its extra cores topping out the chart but what is most impressive here is that you can see better performance in Photoshop, Office, Lightroom, and Premiere Pro than the much more expensive i9-12900K with even just the Ryzen 5 7600X!
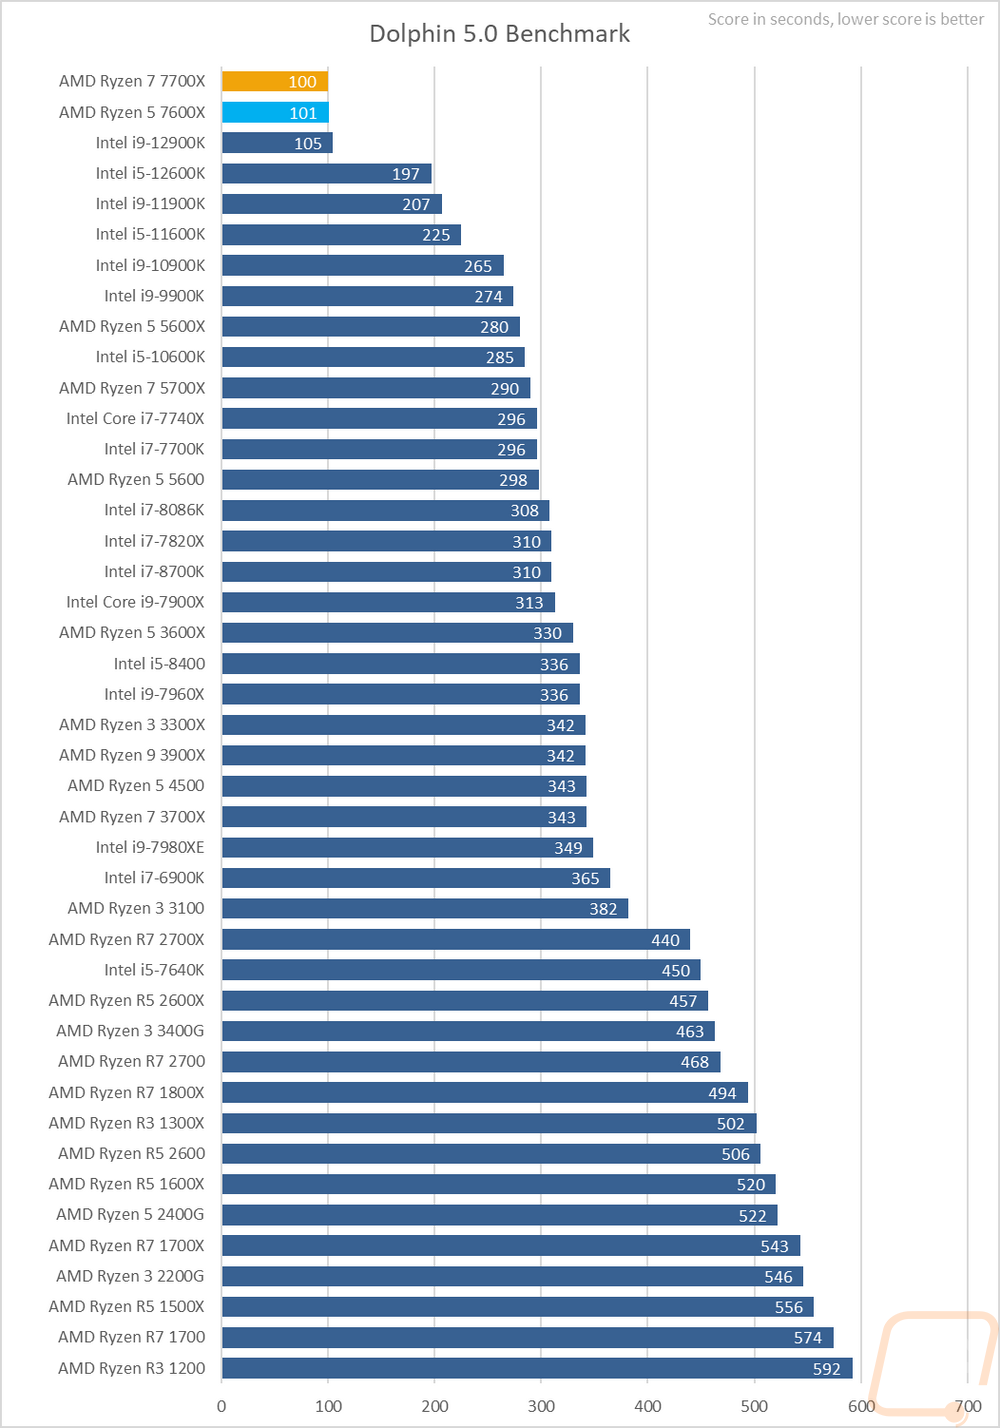
Moving the focus over towards gaming my next test is using Dolphin 5.0 Benchmark. Dolphin 5.0 is a Wii emulator and like most emulators, it doesn’t care about high core counts at all. In fact, it only runs two in total. Clock speeds are king here and you can see just how much the impressive max boosts help with the 7700X and 7600X with both topping the chart.
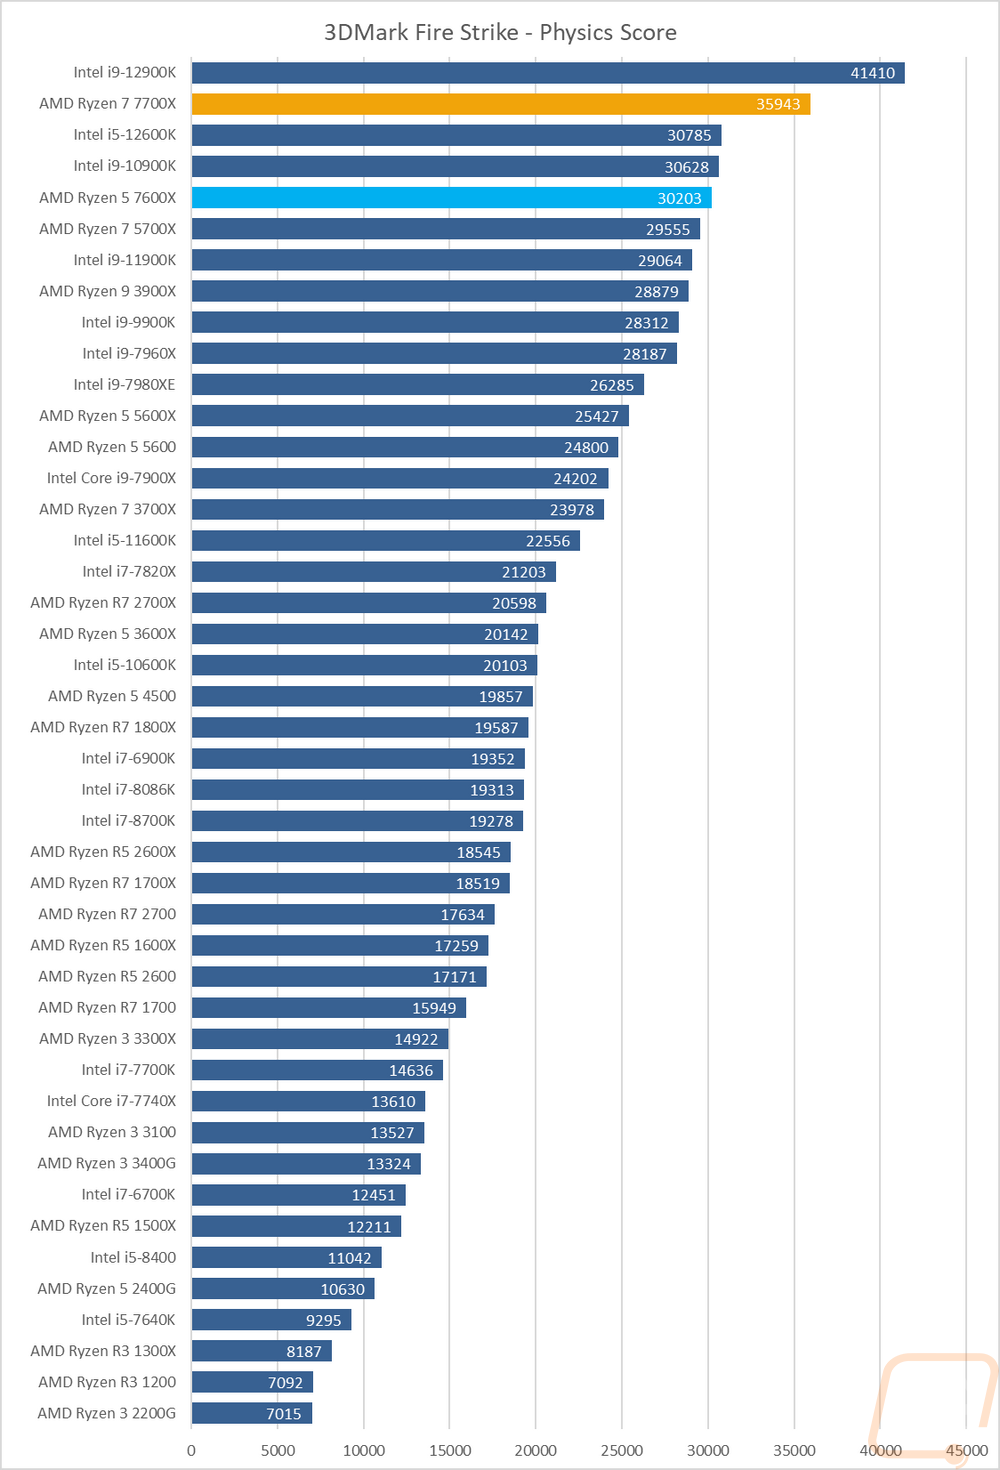
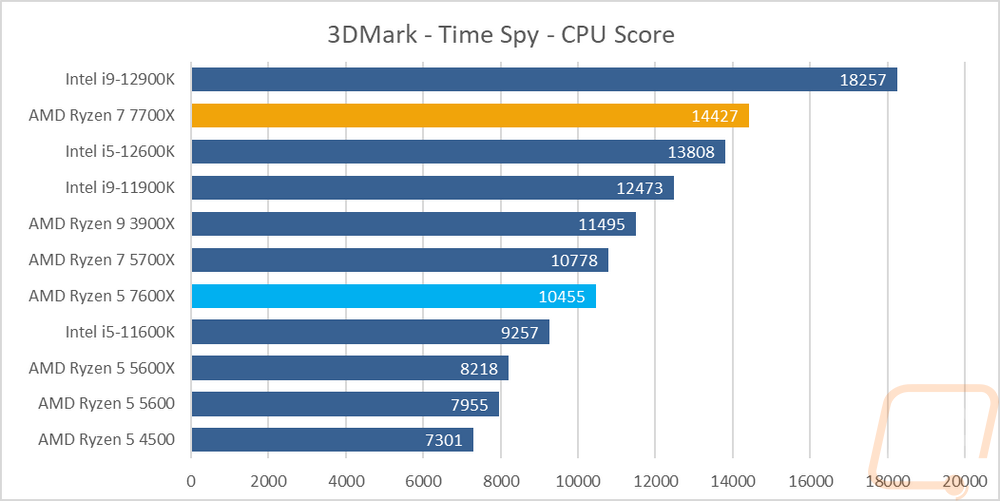
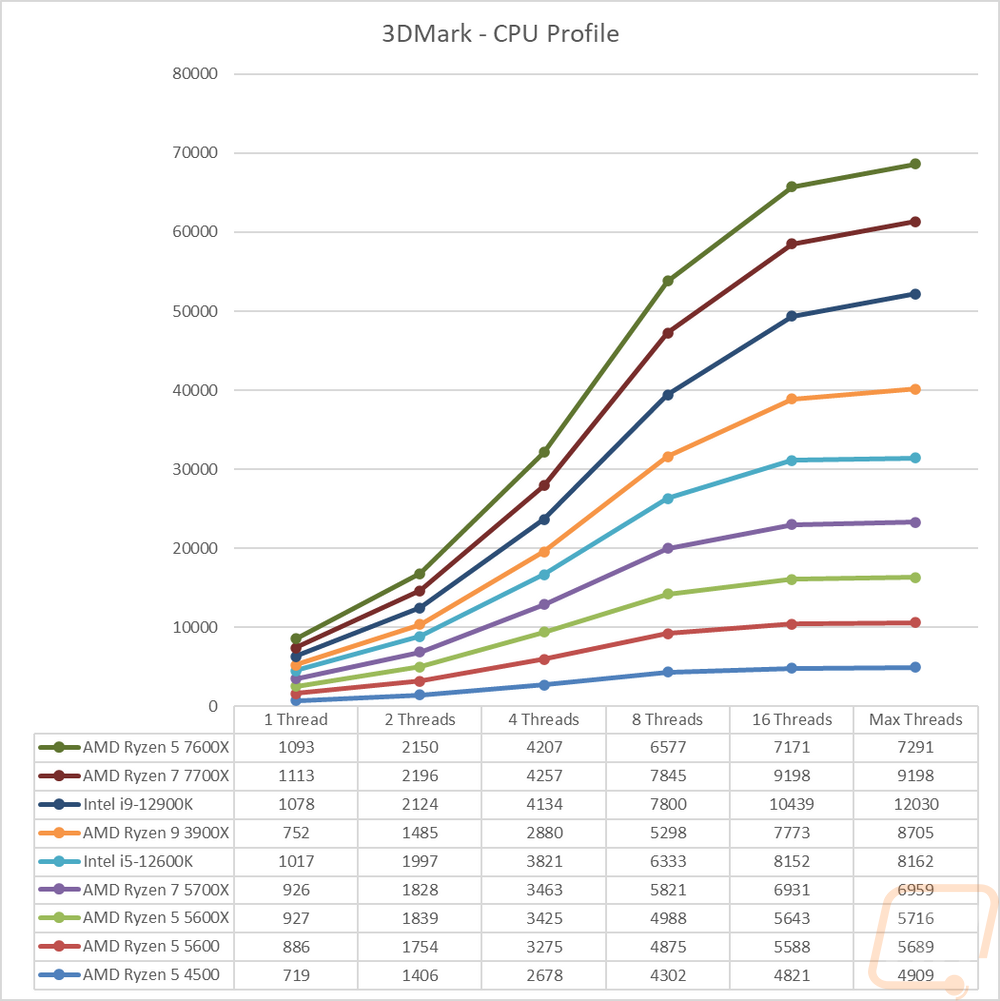
Before diving into game testing I wanted to check out synthetic performance using 3DMark. I tested with the older DX11 Fire Strike test as well as the newer DX12 Time Spy. I also added the new 3DMark CPU Profile benchmark into the mix as well which does a good job of showing the full range of thread counts that you might see being used in games as well as a max threads option that does everything above 16 threads. In the Fire Strike test, the 7700X stands way out ahead of the 7600X with its extra cores with a score sitting way out in front of the 12600K which also has 10 cores (6p cores and 4 e cores), and with the 12900K still out ahead of it. The 7600X on the other hand is sitting right in with the 10900K and ahead of last generations 5700X. Time Spy has the 7700X up near the top behind the 12900K again but the 7600X with its lower core count didn’t do as well with it sitting between the 5700X and the 11600K. The last 3DMark test was the newer CPU profile which runs the same test over and over at different thread counts and maps out the performance overall. The 7700X was the second fastest here with the 12900K of course in the lead and the 7600X sits above the 5700X at max threads but behind the 12600K.
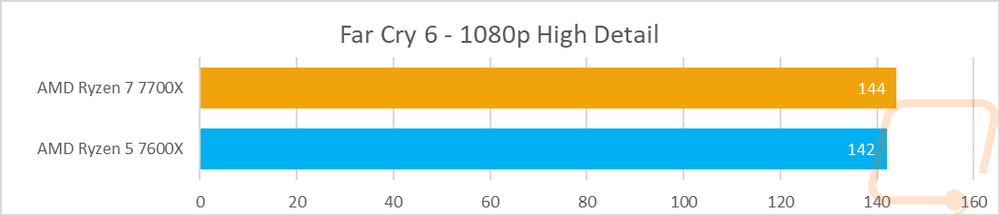
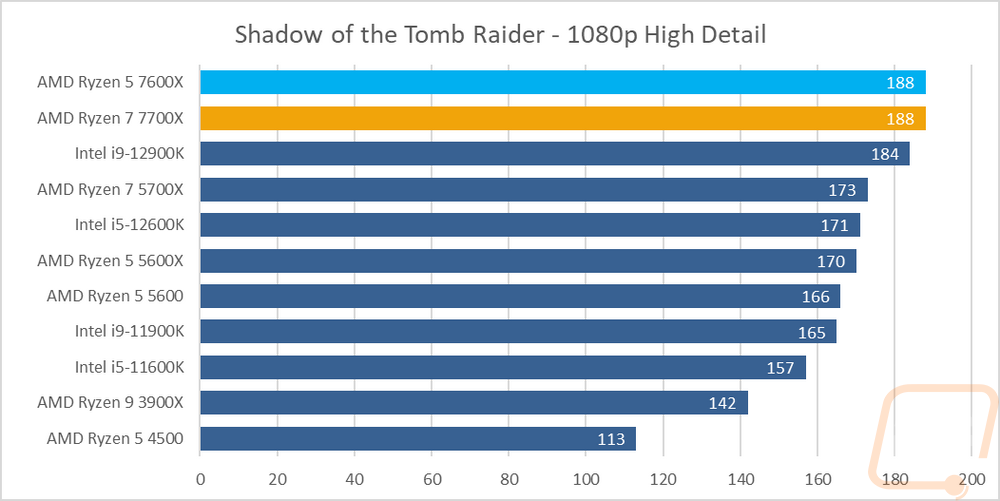
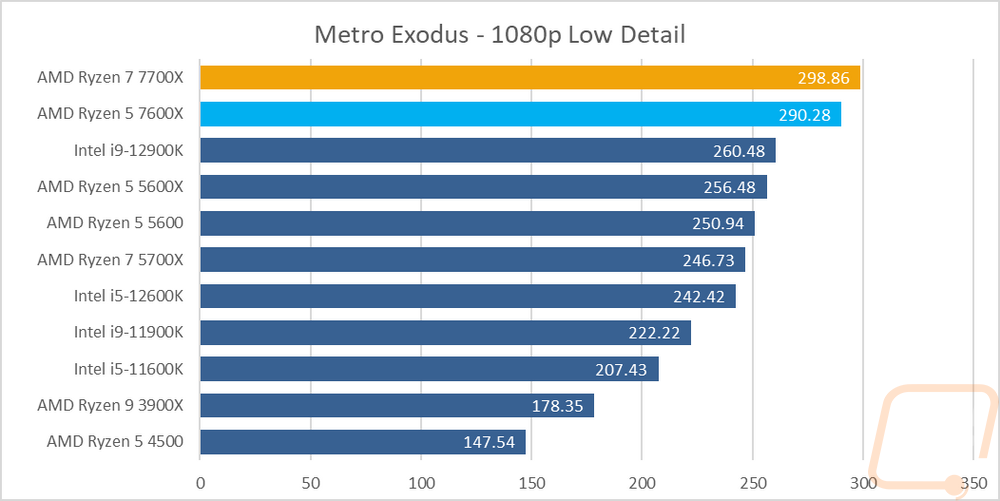
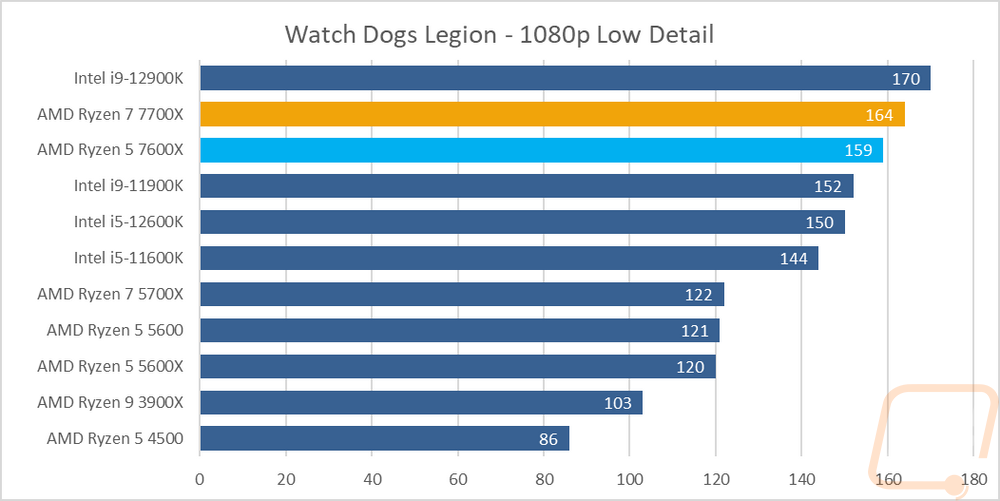
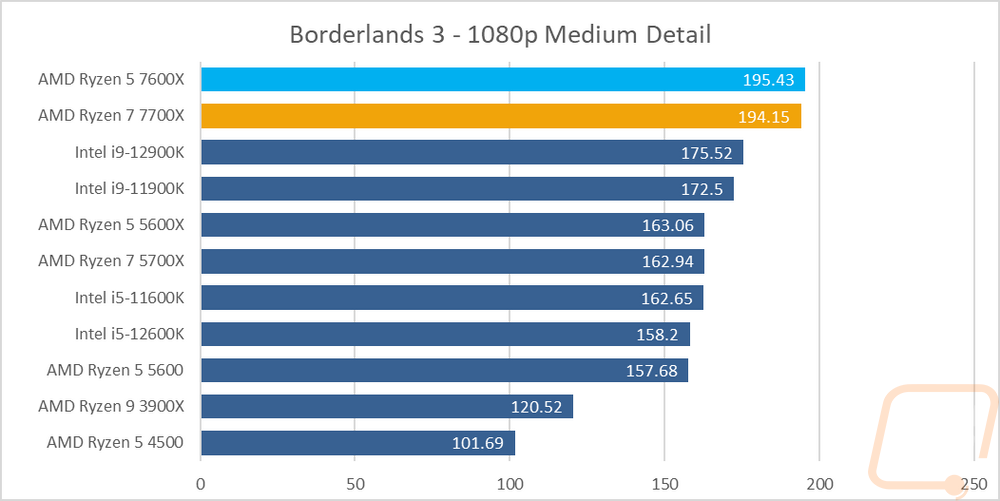
For in-game performance testing, I ran them through a variety of new and old games. TF2 for example is a very old game at this point but is also extremely CPU dependent which makes it a good option to check out for older source-based games. Game results for both the Ryzen 7 7700X and the Ryzen 5 7600X did extremely well, especially in TF2 where they are not only at the top but gave a 17-27 FPS jump over Intel’s flagship 12900K. The higher base clock speeds of the 7600X showed with it being faster than the 7700X in five out of nine of the tests. Both CPUs traded blows with the much more expensive 12900K except for Dirt 5 where they struggled and the 7700X struggled more than the 7600X.
I did also run both CPUs through a few tests using AIDA64, specifically, I wanted to check out cache performance, memory performance, and how the CPUs handle single and double precision and different integers. The 7700X and the 7600X both show an improvement in all of the cache tests when compared to the 5700X, especially with each having lowered latency in each test. Having DDR5 helped with the memory bandwidth coming from the 5700X with read performance jumping from 47858 MB/s to 58755 MB/s (7700X to 5700X) and write performance was a lot more significant going from 28760 MB/s to 80120 MB/s. The integer IOPS performance had a decent jump at 16 and 32 bits but is a huge improvement at 64 bit as well.
|
AIDA64 |
L1 Cache Read |
L1 Cache Write |
L1 Cache Latency |
L2 Cache Read |
L2 Cache Write |
L2 Cache Latency |
|
AMD Ryzen R7 2700X |
999.43 GB/s |
502.50 GB/s |
1.0 ns |
978.03 GB/s |
495.12 GB/s |
2.8 ns |
|
AMD Ryzen R5 2600X |
768.13 GB/s |
388.05 GB/s |
1.0 ns |
729.37 GB/s |
366.01 GB/s |
2.9 ns |
|
Ryzen 5 2400G |
485.01 GB/s |
238.29 GB/s |
1.0 ns |
459.80 GB/s |
232.20 GB/s |
3.1 ns |
|
Ryzen 3 2200G |
460.55 GB/s |
227.41 GB/s |
1.1 ns |
352.84 GB/s |
177.56 GB/s |
3.3 ns |
|
Intel i7-8700K |
1595.6 GB/s |
803.65 GB/s |
0.9 ns |
640.37 GB/s |
397.14 GB/s |
2.6 ns |
|
Intel i5-8400 |
1417.2 GB/s |
710.79 GB/s |
1.0 ns |
543.81 GB/s |
352.90 GB/s |
3.1 ns |
|
Intel Core i9-7980XE |
3758.3 GB/s |
1896.7 GB/s |
1.1 ns |
1671.7 GB/s |
1069.9 GB/s |
5.6 ns |
|
Intel Core i9-7960X |
3532.3 GB/s |
1785.2 GB/s |
1.0 ns |
1571.6 GB/s |
1003.5 GB/s |
5.1 ns |
|
Intel Core i7-7820X |
1969.9 GB/s |
995.02 GB/s |
1.0 ns |
884.63 GB/s |
574.74 GB/s |
5.6 ns |
|
Intel Core i5-7640X |
1044.8 GB/s |
31888 GB/s |
1.0 ns |
397.26 GB/s |
247.00 GB/s |
2.9 ns |
|
Intel Core i9-7900X |
2418.5 GB/s |
709.16 GB/s |
1.0 ns |
1037.3 GB/s |
521.94 GB/s |
5.2 ns |
|
Intel Core i7-7740X |
1102.7 GB/s |
561.25 GB/s |
0.9 ns |
424.55 GB/s |
304.30 GB/s |
2.7 ns |
|
Intel i7-6900K |
1963.9 GB/s |
999.59 GB/s |
1.0 ns |
710.28 GB/s |
310.34 GB/s |
4.1 ns |
|
Intel i7-7700K |
1114.6 GB/s |
560.82 GB/s |
0.9 ns |
415.45 GB/s |
285.97 GB/s |
2.7 ns |
|
Intel i7-5960X |
1748.5 GB/s |
874.60 GB/s |
1.2 ns |
623.08 GB/s |
272.77 GB/s |
3.5 ns |
|
AMD Ryzen R7 1800X |
917.46 GB/s |
460.16 GB/s |
1.1 ns |
831.95 GB/s |
446.37 GB/s |
4.7 ns |
|
AMD Ryzen R7 1700X |
867.89 GB/s |
435.33 GB/s |
1.2 ns |
809.29 GB/s |
419.38 GB/s |
5.0 ns |
|
AMD Ryzen R7 1700 |
793.90 GB/s |
398.12 GB/s |
1.3 ns |
742.92 GB/s |
389.73 GB/s |
5.4 ns |
|
AMD Ryzen R5 1600X |
689.47 GB/s |
345.95 GB/s |
1.1 ns |
630.99 GB/s |
334.93 GB/s |
4.7 ns |
|
AMD Ryzen R5 1500X |
446.84 GB/s |
224.01 GB/s |
1.1 ns |
306.82 GB/s |
211.58 GB/s |
11.8 ns |
|
AMD Ryzen R5 2600 |
685.38 GB/s |
344.05 GB/s |
1 ns |
669.28 GB/s |
333.5 GB/s |
3.1 ns |
|
AMD Ryzen R7 2700X |
849.91 GB/s |
426.09 GB/s |
1 ns |
837.76 GB/s |
418.75 GB/s |
3.0 ns |
|
Intel i7-8086K |
1596.4 GB/s |
803.56 GB/s |
0.9 ns |
623.36 GB/s |
423.53 GB/s |
2.6 ns |
|
Intel i9-9900K |
2375.6 GB/s |
1195.4 GB/s |
0.8 ns |
907.65 GB/s |
626.34 GB/s |
2.4 ns |
|
AMD Ryzen 9 3900X |
3098.6 GB/s |
1551.4 GB/s |
0.9 ns |
1545.3 GB/s |
1416.8 GB/s |
2.8 ns |
|
AMD Ryzen 7 3700X |
2133.2 GB/s |
1072.9 GB/s |
0.9 ns |
1069.1 GB/s |
993.49 GB/s |
2.8 ns |
|
AMD Ryzen 5 3600X |
1547.4 GB/s |
779.24 GB/s |
1.0 ns |
777.62 GB/s |
745.30 GB/s |
2.8 ns |
|
AMD Ryzen 3 3400G |
508.97 GB/s |
253.87 GB/s |
1.0 ns |
490.26 GB/s |
247.04 GB/s |
3.0 ns |
|
AMD Ryzen 3 3300X |
1080.5 GB/s |
541.50 GB/s |
0.9 ns |
541.84 GB/s |
530.50 GB/s |
2.7 ns |
|
AMD Ryzen 3 3100 |
965.85 GB/s |
484.67 GB/s |
1.0 ns |
485.55 GB/s |
460.71 GB/s |
3.1 ns |
|
Intel i5-10600K |
1676.6 GB/s |
840.87 GB/s |
0.8 ns |
662.98 GB/s |
452.67 GB/s |
2.5 ns |
|
Intel i9-10900K |
3162.1 GB/s |
1586.7 GB/s |
0.8 ns |
1201.8 GB/s |
759.97 GB/s |
2.4 ns |
|
AMD Ryzen 5 5600X |
1721.4 GB/s |
869.69 GB/s |
0.9 ns |
851.89 GB/s |
831.97 GB/s |
2.6 ns |
|
Intel i9-11900K |
4542.8 GB/s |
2299.3 GB/s |
1.0 ns |
1413.2 GB/s |
691.62 GB/s |
2.5 ns |
|
Intel i5-11600K |
3412.3 GB/s |
1724.9 GB/s |
1.0 ns |
960.91 GB/s |
526.76 GB/s |
2.7 ns |
|
Intel i9-12900K |
2310.0 GB/s |
1438.7 GB/s |
1.0 ns |
1233.5 GB/s |
562.72 GB/s |
2.9 ns |
|
Intel i5-12600K |
1461.1 GB/s |
971.78 GB/s |
1.1 ns |
846.4 GB/s |
360.51 GB/s |
3.2 ns |
|
AMD Ryzen 5 4500 |
1561.9 GB/s |
784.1 GB/s |
1.0 ns |
785.34 GB/s |
751.61 GB/s |
2.9 ns |
|
AMD Ryzen 5 5600 |
1646.6 GB/s |
831.24 GB/s |
0.9 ns |
832.43 GB/s |
767.22 GB/s |
2.7 ns |
|
AMD Ryzen 7 5700X |
2267.8 GB/s |
1157.8 GB/s |
0.9 ns |
1147.6 GB/s |
1026.1 GB/s |
2.6 ns |
|
AMD Ryzen 7 7700X |
2722.9 GB/s |
1381 GB/s |
0.7 ns |
1361.1 GB/s |
1305.1 GB/s |
2.7 ns |
|
AMD Ryzen 5 7600X |
1996.3 GB/s |
1019.3 GB/s |
0.7 ns |
1020.9 GB/s |
999.93 GB/s |
2.6 ns |
|
AIDA64 |
L3 Cache Read |
L3 Cache Write |
L3 Cache Latency |
Memory Read |
Memory Write |
Memory Latency |
|
AMD Ryzen R7 2700X |
414.95 GB/s |
417.71 GB/s |
8.8 ns |
50214 MB/s |
48578 MB/s |
65.0 ns |
|
AMD Ryzen R5 2600X |
429.09 GB/s |
323.83 GB/s |
9.1 ns |
50273 MB/s |
48346 MB/s |
65.5 ns |
|
Ryzen 5 2400G |
222.96 GB/s |
181.60 GB/s |
9.6 ns |
45967 MB/s |
47850 MB/s |
66.6 ns |
|
Ryzen 3 2200G |
137.30 GB/s |
171.20 GB/s |
10.2 ns |
35567 MB/s |
36240 MB/s |
118.4 ns |
|
Intel i7-8700K |
337.00 GB/s |
213.67 GB/s |
11.0 ns |
38421 MB/s |
40175 MB/s |
57.9 ns |
|
Intel i5-8400 |
270.89 GB/s |
186.82 GB/s |
13.0 ns |
38096 MB/s |
40549 MB/s |
59.8 ns |
|
Intel Core i9-7980XE |
229.61 GB/s |
118.40 GB/s |
21.0 ns |
77004 MB/s |
68888 MB/s |
73.4 ns |
|
Intel Core i9-7960X |
220.22 GB/s |
121.04 GB/s |
19.8 ns |
79416 MB/s |
71554 MB/s |
74.9 ns |
|
Intel Core i7-7820X |
114.40 GB/s |
103.57 GB/s |
19.2 ns |
76049 MB/s |
73759 MB/s |
71.6 ns |
|
Intel Core i5-7640X |
228.31 GB/s |
163.86 GB/s |
11.1 ns |
30786 MB/s |
31888 MB/s |
68.5 ns |
|
Intel Core i9-7900X |
124.16 GB/s |
106.78 GB/s |
21.2 ns |
76856 MB/s |
72856 MB/s |
72.8 ns |
|
Intel Core i7-7740X |
287.01 GB/s |
186.67 GB/s |
21.2 ns |
38455 MB/s |
40596 MB/s |
53.2 ns |
|
Intel i7-6900K |
243.96 GB/s |
195.41 GB/s |
14.6 ns |
66786 MB/s |
68130 MB/s |
61.9 ns |
|
Intel i7-7700K |
234.50 GB/s |
188.70 GB/s |
10.4 ns |
38498 MB/s |
40448 MB/s |
52.7 ns |
|
Intel i7-5960X |
260.72 GB/s |
184.92 GB/s |
15.3 ns |
66108 MB/s |
49545 MB/s |
62.8 ns |
|
AMD Ryzen R7 1800X |
388.18 GB/s |
386.01 GB/s |
12.4 ns |
44031 MB/s |
43425 MB/s |
81.8 ns |
|
AMD Ryzen R7 1700X |
369.75 GB/s |
350.31 GB/s |
12.9 ns |
44493 MB/s |
43749 MB/s |
78.3 ns |
|
AMD Ryzen R7 1700 |
334.36 GB/s |
332.12 GB/s |
14.2 ns |
45343 MB/s |
43777 MB/s |
82.6 ns |
|
AMD Ryzen R5 1600X |
386.48 GB/s |
326.86 GB/s |
12.3 ns |
44452 MB/s |
43918 MB/s |
83.7 ns |
|
AMD Ryzen R5 1500X |
306.82 GB/s |
211.58 GB/s |
11.8 ns |
44289 MB/s |
43746 MB/s |
83.1 ns |
|
AMD Ryzen R5 2600 |
381.16 GB/s |
320.56 GB/s |
9.8 ns |
50385 MB/s |
48499 MB/s |
66.5 ns |
|
AMD Ryzen R7 2700 |
357.51 GB/s |
356.71 GB/s |
9.4 ns |
50088 MB/s |
48343 MB/s |
65.9 ns |
|
Intel i7-8086K |
380.04 GB/s |
243.73 GB/s |
10.9 ns |
39069 MB/s |
40675 MB/s |
56.2 ns |
|
Intel i9-9900K |
302.01 GB/s |
221.1 GB/s |
11.0 ns |
39682 MB/s |
41015 MB/s |
51.1 ns |
|
AMD Ryzen 9 3900X |
1014.4 GB/s |
836.39 GB/s |
11.5 ns |
53981 MB/s |
52271 MB/s |
70.7 ns |
|
AMD Ryzen 7 3700X |
611.53 GB/s |
573.21 GB/s |
10.2 ns |
51498 MB/s |
28739 MB/s |
67.3 ns |
|
AMD Ryzen 5 3600X |
584.93 GB/s |
538.45 GB/s |
10.4 ns |
50769 MB/s |
28736 MB/s |
68.9 ns |
|
AMD Ryzen 3 3400G |
233.57 GB/s |
193.62 GB/s |
9.3 ns |
49936 MB/s |
53502 MB/s |
67.1 ns |
|
AMD Ryzen 3 3300X |
322.13 GB/s |
321.33 GB/s |
11.1 ns |
51435 MB/s |
28743 MB/s |
66.4 ns |
|
AMD Ryzen 3 3100 |
374.11 GB/s |
343.53 GB/s |
11.8 ns |
50246 MB/s |
28734 MB/s |
71.1 ns |
|
Intel i5-10600K |
361.35 GB/s |
238.47 GB/s |
10.5 ns |
43340 MB/s |
43430 MB/s |
48.2 ns |
|
Intel i9-10900K |
407.66 GB/s |
245.94 GB/s |
11.4 ns |
44972 MB/s |
43808 MB/s |
50.5 ns |
|
AMD Ryzen 5 5600X |
276.24 GB/s |
298.84 GB/s |
11.0 ns |
50972 MB/s |
28772 MB/s |
59.2 ns |
|
Intel i9-11900K |
330.32 GB/s |
213.28 GB/s |
11.4 ns |
44919 MB/s |
43343 MB/s |
51.8 ns |
|
Intel i5-11600K |
319.10 GB/s |
198.57 GB/s |
11.4 ns |
43953 MB/s |
43468 MB/s |
55.6 ns |
|
Intel i9-12900K |
678.84 GB/s |
418.11 GB/s |
19.8 ns |
71418 MB/s |
72395 MB/s |
82.0 ns |
|
Intel i5-12600K |
598.86 GB/s |
292.09 GB/s |
21.4 ns |
65416 MB/s |
71336 MB/s |
87.8 ns |
|
AMD Ryzen 5 4500 |
350.05 GB/s |
571.19 GB/s |
10.5 ns |
52683 MB/s |
53191 MB/s |
82.8 ns |
|
AMD Ryzen 5 5600 |
445.8 GB/s |
437.73 GB/s |
11.9 ns |
48444 MB/s |
28753 MB/s |
70.9 ns |
|
501.53 GB/s |
526.11 GB/s |
11.5 ns |
47858 MB/s |
28760 MB/s |
68.2 ns |
|
|
AMD Ryzen 7 7700X |
887.95 GB/s |
901.2 GB/s |
10.1 ns |
58755 MB/s |
80120 MB/s |
70 ns |
|
AMD Ryzen 5 7600X |
847.43 GB/s |
847.61 GB/s |
10.5 ns |
54720 MB/s |
80771 MB/s |
69.5 ns |
|
AIDA64 |
Single-Precision FLOPS |
Double Precision FLOPS |
AES-256 |
24-bit Integer IOPS |
32-bit Integer IOPS |
64-bit Integer IOPS |
|
AMD Ryzen R7 2700X |
507.9 GFLOPS |
253.9 GFLOPS |
70514 MB/s |
127.7 GIOPS |
127.7 GIOPS |
64.22 GIOPS |
|
AMD Ryzen R5 2600X |
383.2 GFLOPS |
191.4 GFLOPS |
51932 MB/s |
95.82 GIOPS |
95.82 GIOPS |
48.15 GIOPS |
|
Ryzen 5 2400G |
235.9 GFLOPS |
117.8 GFLOPS |
32388 MB/s |
58.94 GIOPS |
58.98 GIOPS |
29.67 GIOPS |
|
Ryzen 3 2200G |
225.8 GFLOPS |
112.6 GFLOPS |
27603 MB/s |
56.32 GIOPS |
56.32 GIOPS |
28.30 GIOPS |
|
Intel i7-8700K |
825.0 GFLOPS |
412.5 GFLOPS |
29406 MB/s |
370.0 GIOPS |
370.0 GIOPS |
51.55 GIOPS |
|
Intel i5-8400 |
728.8 GFLOPS |
364.5 GFLOPS |
25192 MB/s |
323.5 GIOPS |
323.5 GIOPS |
45.55 GIOPS |
|
Intel Core i9-7980XE |
1831 GFLOPS |
915.5 GFLOPS |
69377 MB/s |
821.2 GIOPS |
821.3 GIOPS |
121.6 GIOPS |
|
Intel Core i9-7960X |
1681 GFLOPS |
840.6 GFLOPS |
65409 MB/s |
754.0 GIOPS |
753.9 GIOPS |
114.7 GIOPS |
|
Intel Core i7-7820X |
944.9 GFLOPS |
472.5 GFLOPS |
36420 MB/s |
423.7 GIOPS |
423.7 GIOPS |
63.85 GIOPS |
|
Intel Core i5-7640X |
536.5 GFLOPS |
268.2 GFLOPS |
18547 MB/s |
238.1 GIOPS |
138.1 GIOPS |
33.53 GIOPS |
|
Intel Core i9-7900X |
1148 GFLOPS |
574.5 GFLOPS |
45506 MB/s |
515.1 GIOPS |
515.0 GIOPS |
79.76 GIOPS |
|
Intel Core i7-7740X |
575.4 GFLOPS |
287.8 GFLOPS |
20503 MB/s |
258.1 GIOPS |
258.0 GIOPS |
35.97 GIOPS |
|
Intel i7-6900K |
1023 GFLOPS |
511.7 GFLOPS |
36340 MB/s |
255.9 GIOPS |
255.9 GIOPS |
63.96 GIOPS |
|
Intel i7-7700K |
575.7 GFLOPS |
287.9 GFLOPS |
20519 MB/s |
258.0 GIOPS |
258.0 GIOPS |
35.98 GIOPS |
|
Intel i7-5960X |
895.5 GFLOPS |
447.7 GFLOPS |
31783 MB/s |
223.9 GIOPS |
223.9 GIOPS |
55.97 GIOPS |
|
AMD Ryzen R7 1800X |
472.4 GFLOPS |
236.2 GFLOPS |
64016 MB/s |
118.1 GIOPS |
118.1 GIOPS |
59.03 GIOPS |
|
AMD Ryzen R7 1700X |
446.8 GFLOPS |
223.4 GFLOPS |
61730 MB/s |
111.7 GIOPS |
111.7 GIOPS |
55.84 GIOPS |
|
AMD Ryzen R7 1700 |
408.5 GFLOPS |
204.3 GFLOPS |
56811 MB/s |
102.1 GIOPS |
102.1 GIOPS |
51.05 GIOPS |
|
AMD Ryzen R5 1600X |
354.9 GFLOPS |
177.5 GFLOPS |
49340 MB/s |
88.74 GIOPS |
88.73 GIOPS |
44.34 GIOPS |
|
AMD Ryzen R5 1500X |
229.8 GFLOPS |
114.8 GFLOPS |
31983 MB/s |
57.43 GIOPS |
57.45 GIOPS |
28.72 GIOPS |
|
AMD Ryzen R5 2600 |
351 GFLOPS |
175.4 GFLOPS |
48939 MB/s |
88.03 GIOPS |
88.02 GIOPS |
44.01 GIOPS |
|
AMD Ryzen R7 2700 |
434.3 GFLOPS |
217.2 GFLOPS |
60336 MB/s |
108.6 GIOPS |
108.6 GIOPS |
54.68 GIOPS |
|
Intel i7-8086K |
824.9 GFLOPS |
412.5 GFLOPS |
29397 MB/s |
369.9 GIOPS |
369.9 GIOPS |
51.55 GIOPS |
|
Intel i9-9900K |
1226 GFLOPS |
613.0 GFLOPS |
45542 MB/s |
550.0 GIOPS |
549.8 GIOPS |
79.79 GIOPS |
|
AMD Ryzen 9 3900X |
1546 GFLOPS |
772.1 GFLOPS |
106943 MB/s |
385.7 GIOPS |
385.7 GIOPS |
96.57 GIOPS |
|
AMD Ryzen 7 3700X |
1078 GFLOPS |
537.8 GFLOPS |
74474 MB/s |
271.0 GIOPS |
271.2 GIOPS |
67.77 GIOPS |
|
AMD Ryzen 5 3600X |
799.5 GFLOPS |
400.0 GFLOPS |
55456 MB/s |
198.6 GIOPS |
198.6 GIOPS |
49.64 GIOPS |
|
AMD Ryzen 3 3400G |
257.2 GFLOPS |
128.5 GFLOPS |
35736 MB/s |
64.16 GIOPS |
64.16 GIOPS |
32.25 GIOPS |
|
AMD Ryzen 3 3300X |
551.6 GFLOPS |
276.1 GFLOPS |
38176 MB/s |
138.7 GIOPS |
138.7 GIOPS |
34.65 GIOPS |
|
AMD Ryzen 3 3100 |
497.6 GFLOPS |
248.7 GFLOPS |
34946 MB/s |
124.4 GIOPS |
124.4 GIOPS |
31.09 GIOPS |
|
Intel i5-10600K |
863.8 GFLOPS |
431.9 GFLOPS |
30782 MB/s |
387.2 GIOPS |
386.9 GIOPS |
53.99 GIOPS |
|
Intel i9-10900K |
1632 GFLOPS |
815.7 GFLOPS |
58163 MB/s |
731.3 GIOPS |
731.2 GIOPS |
102.0 GIOPS |
|
AMD Ryzen 5 5600X |
891.9 GFLOPS |
445.8 GFLOPS |
61623 MB/s |
709.6 GIOPS |
709.7 GIOPS |
55.72 GIOPS |
|
Intel i9-11900K |
1068 GFLOPS |
534.2 GFLOPS |
164966 MB/s |
547.0 GIOPS |
547.0 GIOPS |
182.7 GIOPS |
|
Intel i5-11600K |
838.7 GFLOPS |
419.4 GFLOPS |
123767 MB/s |
429.3 GIOPS |
429.3 GIOPS |
143.4 GIOPS |
|
Intel i9-12900K |
695.7 GFLOPS |
247.9 GFLOPS |
140499 MB/s |
400.6 GIOPS |
400.6 GIOPS |
166.2 GIOPS |
|
Intel i5-12600K |
432.5 GFLOPS |
216.2 GFLOPS |
86470 MB/s |
252.7 GIOPS |
252.7 GIOPS |
96.22 GIOPS |
|
AMD Ryzen 5 4500 |
806 GFLOPS |
402.6 GFLOPS |
56578 MB/s |
201.5 GIOPS |
201.3 GIOPS |
50.35 GIOPS |
|
AMD Ryzen 5 5600 |
853.2 GFLOPS |
426.2 GFLOPS |
107839 MB/s |
675.8 GIOPS |
679.6 GIOPS |
53.38 GIOPS |
|
AMD Ryzen 7 5700X |
1158 GFLOPS |
577.9 GFLOPS |
137459 MB/s |
919.1 GIOPS |
912.9 GIOPS |
74.38 GIOPS |
|
AMD Ryzen 7 7700X |
1392 GFLOPS |
694.6 GFLOPS |
192730 MB/s |
1205 GIOPS |
1205 GIOPS |
602.4 GIOPS |
|
AMD Ryzen 5 7600X |
1046 GFLOPS |
523.1 GFLOPS |
147661 MB/s |
912.5 GIOPS |
912.5 GIOPS |
456.4 GIOPS |
iGPU Performance
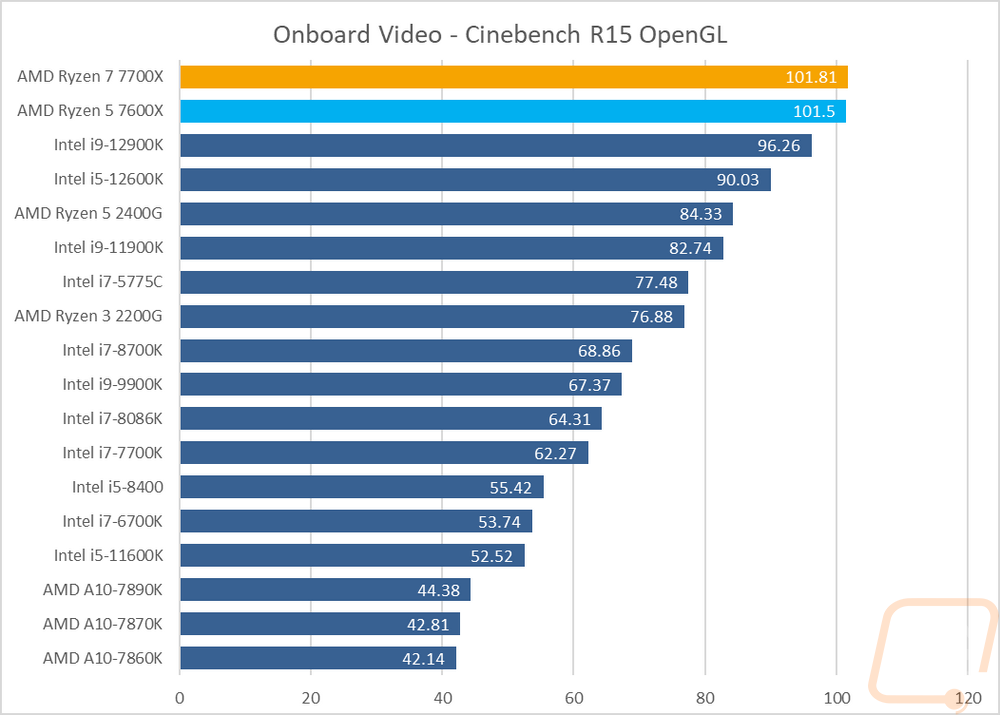
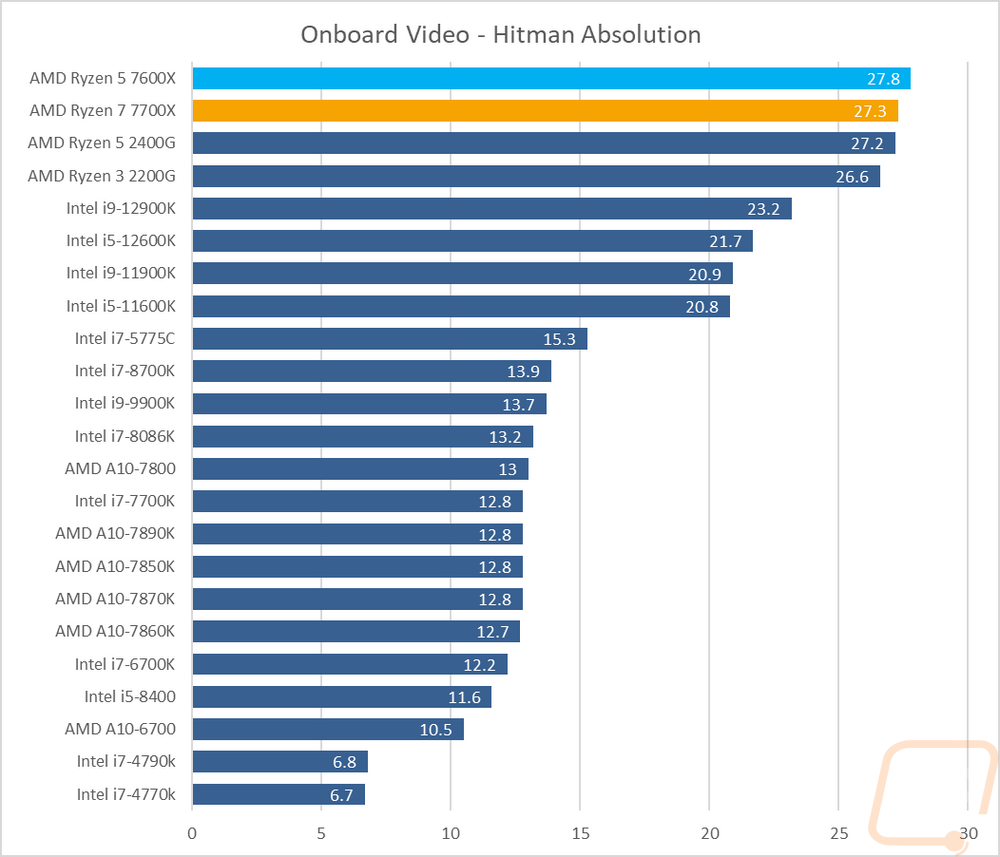
GPU availability has been improving so iGPU performance has been a little less important, but there are still a lot of situations where people do not need a dedicated GPU, and for those people, I do still like to check out the performance of the built-in GPU which in the case of the new 7000 Series is the first Ryzen generation to have integrated graphics included in all of the CPUs. My first test was an older Cinebench R15 which has an OpenGL benchmark render that tests rendering performance on the GPU side. Here the 7700X and 7600X did extremely well, outperforming all of the CPUs tested previously including the Intel 12th gen CPUs that were previously at the top.
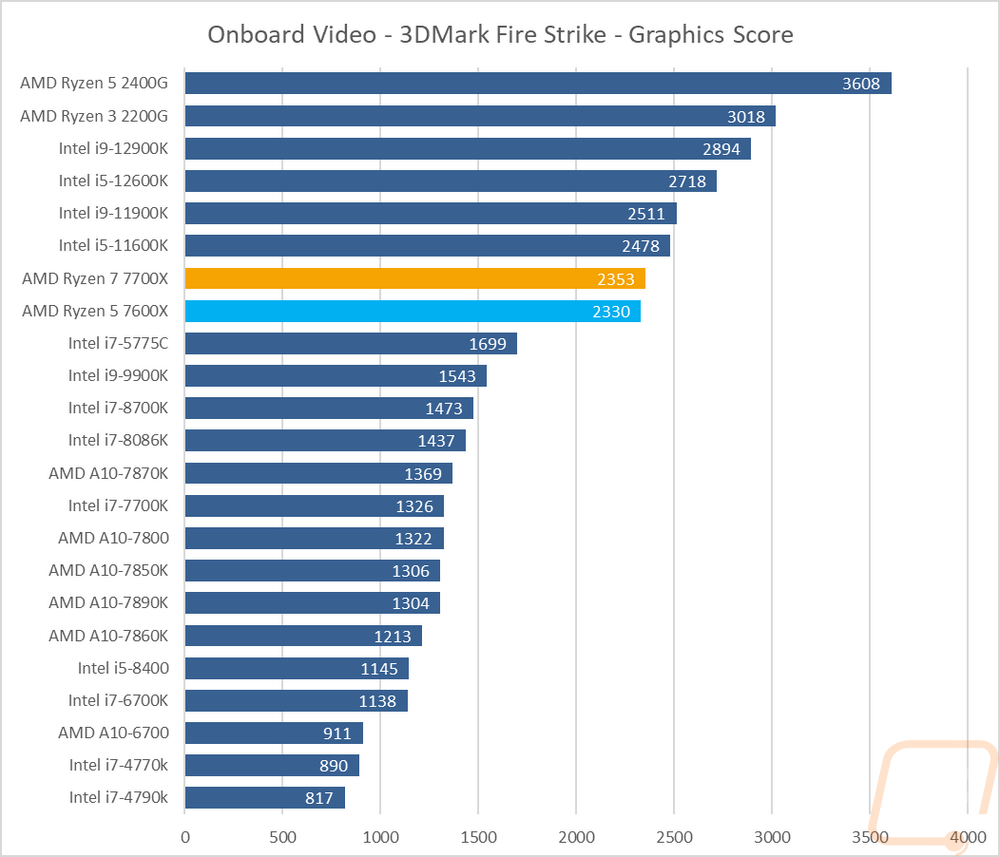
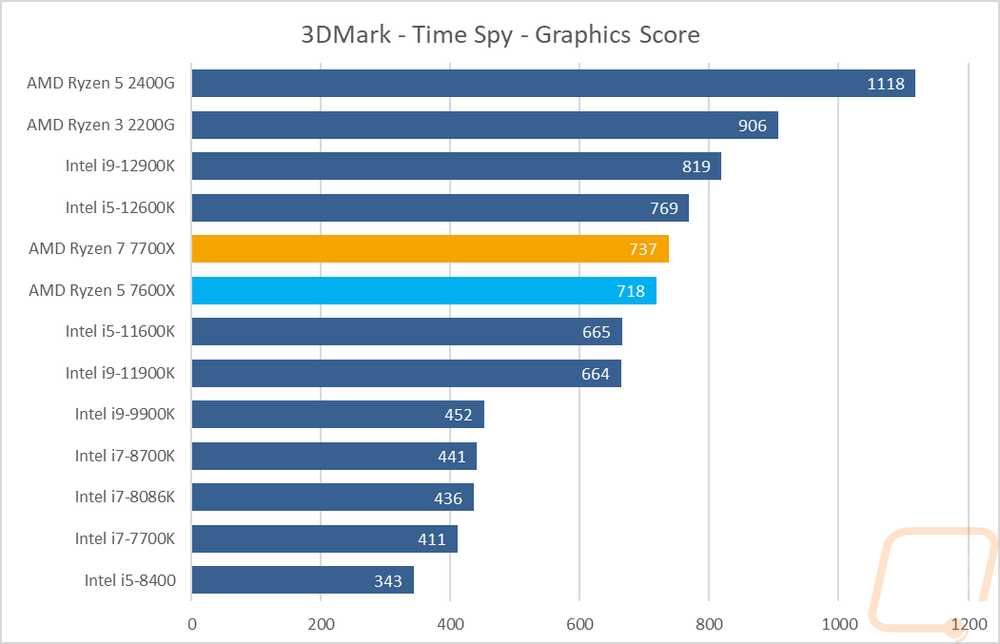
Next, I defaulted to the always consistent 3DMark with both the older Fire Strike benchmark and the newer Time Spy which is DX12. I only used the graphics score, not the total score to take the CPU performance out of the equation as much as possible. I wasn’t sure what to expect overall but it is clear that the RDNA2 graphics built into the Zen 4 CPUs don’t have the same power as the G series of Ryzen CPUs, but in Fire Strike, both CPUs came in below Intel’s 11th Gen CPUs and in Time Spy they did better falling between the Intel 11th and 12th Gen CPUs.
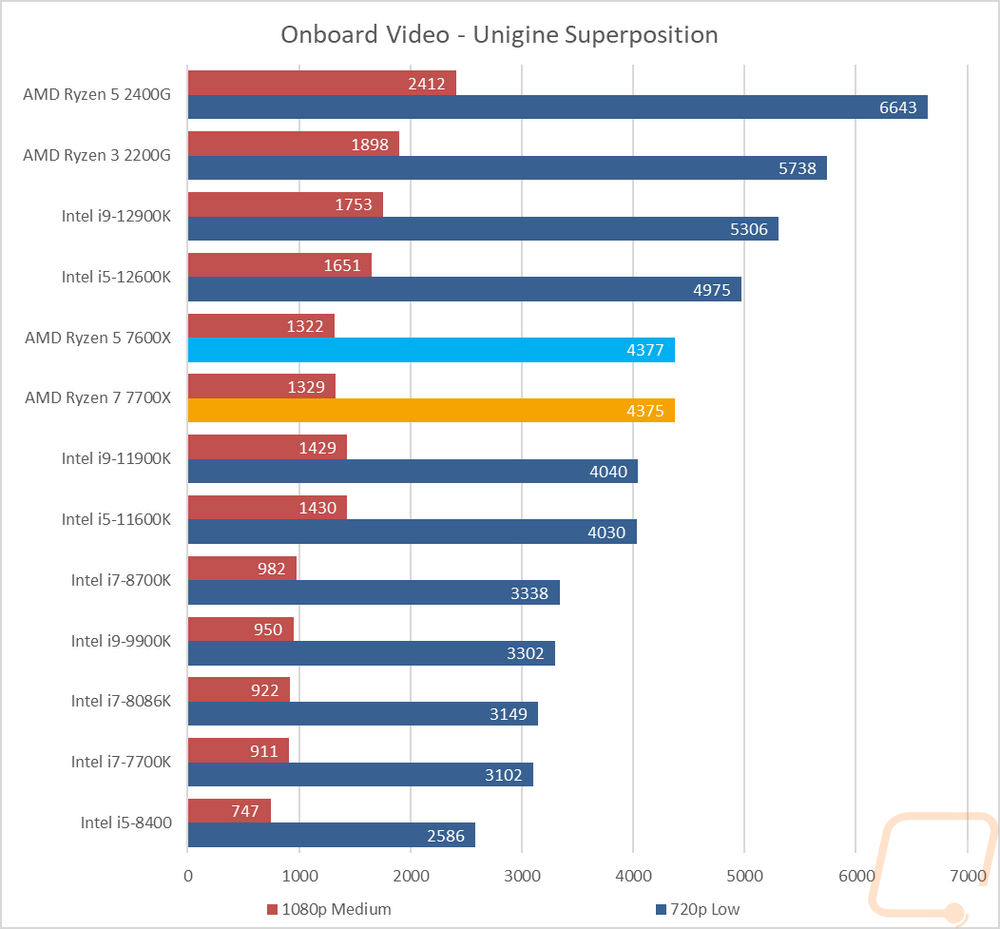
In Unigine Superposition I ran the 1080p medium detail and 720p low detail tests and the results here weren’t much different than the previous tests. The 7600X and 7700X came in right in between the Intel 11th and 12th Gen CPUs with the past 2400G and 2200G Ryzen CPUs way out in front.
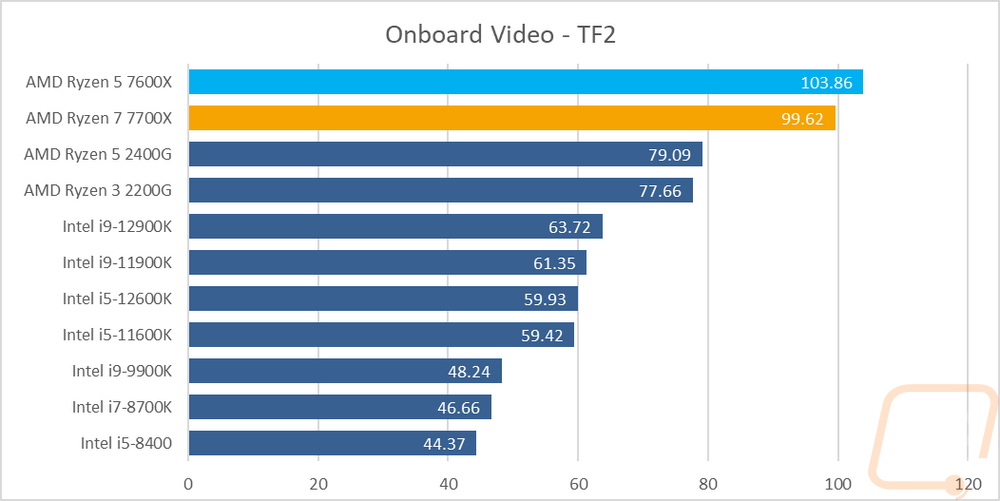
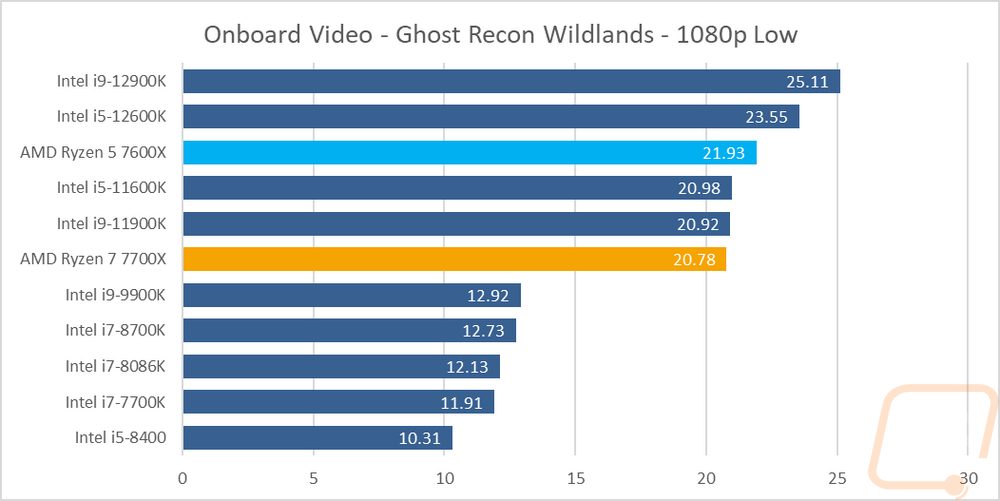
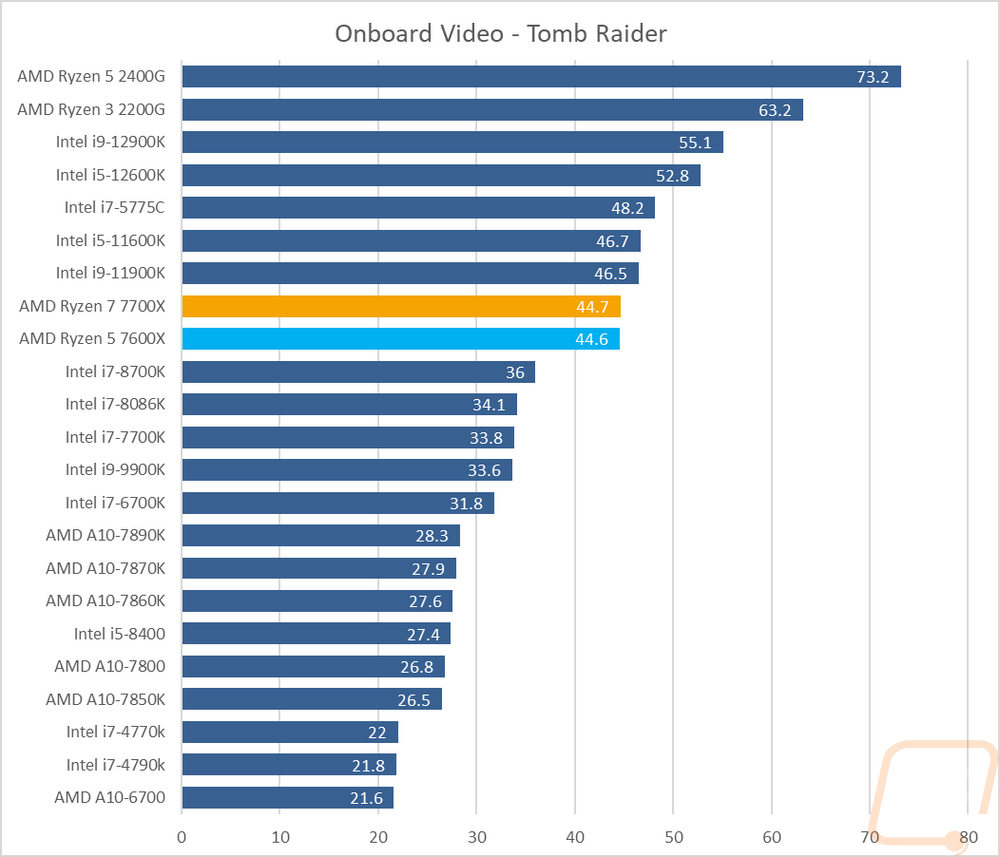
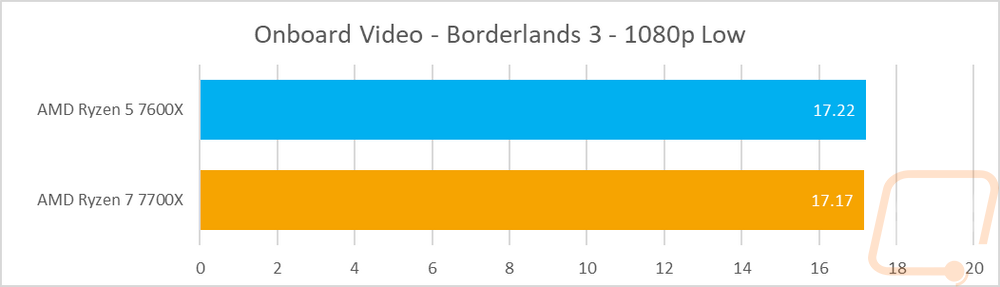
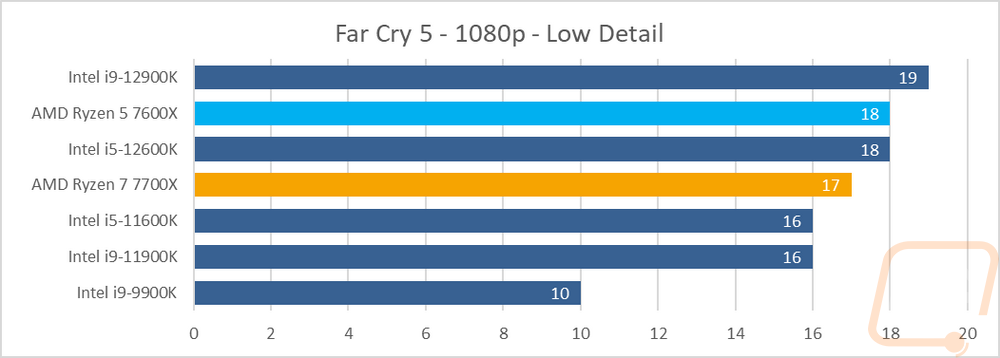
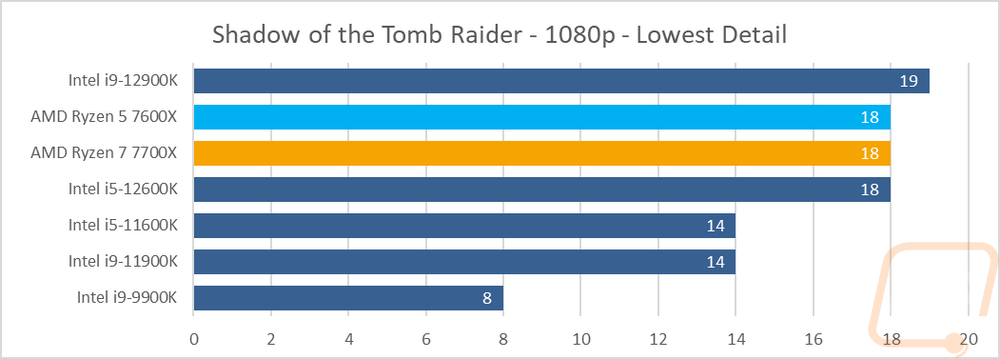
Then from there on, I jumped into game tests. Some of our tests are older games but I did also add in a few newer games as well to get an idea of newer games when tested at 1080p and low or medium settings. While both the 7700X and the 7600X have the same iGPU it is interesting to see how the lower base clock speed on the 7700X but higher boost clock speed swaps which CPU is faster from game to game. Well, I shouldn’t say game to game, in all but one game the 7600X was a hair faster than the 7700X with one tie and one faster on the 7700X. I was especially impressed with the performance in TF2 which was beyond smooth and starting to get up into the higher refresh rate performance. Gaming at 1080p was hit and miss across the rest of the games new and old with some demanding games like Far Cry 5 struggling across the board. If you are looking to play more demanding games a dedicated GPU is still going to be the best option or you will at least need to drop down to 720p.
Power Usage and Temperatures
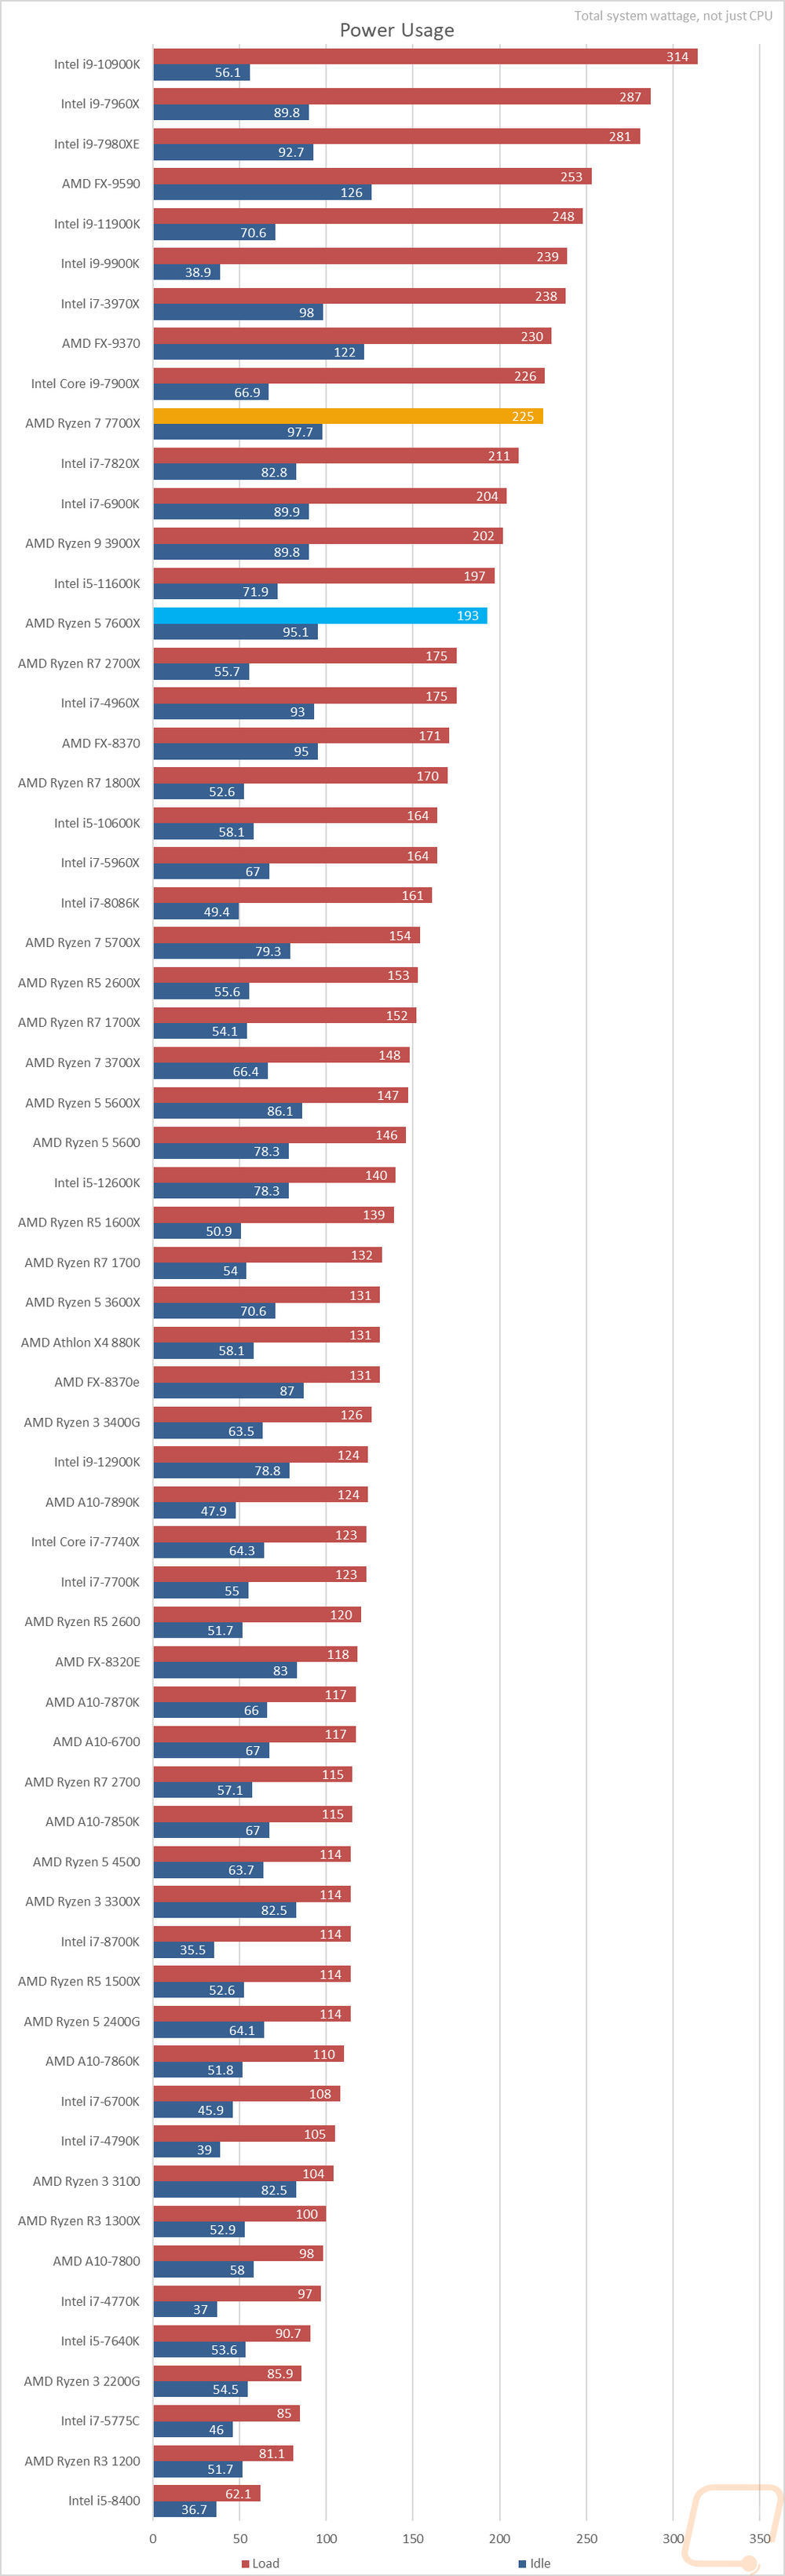
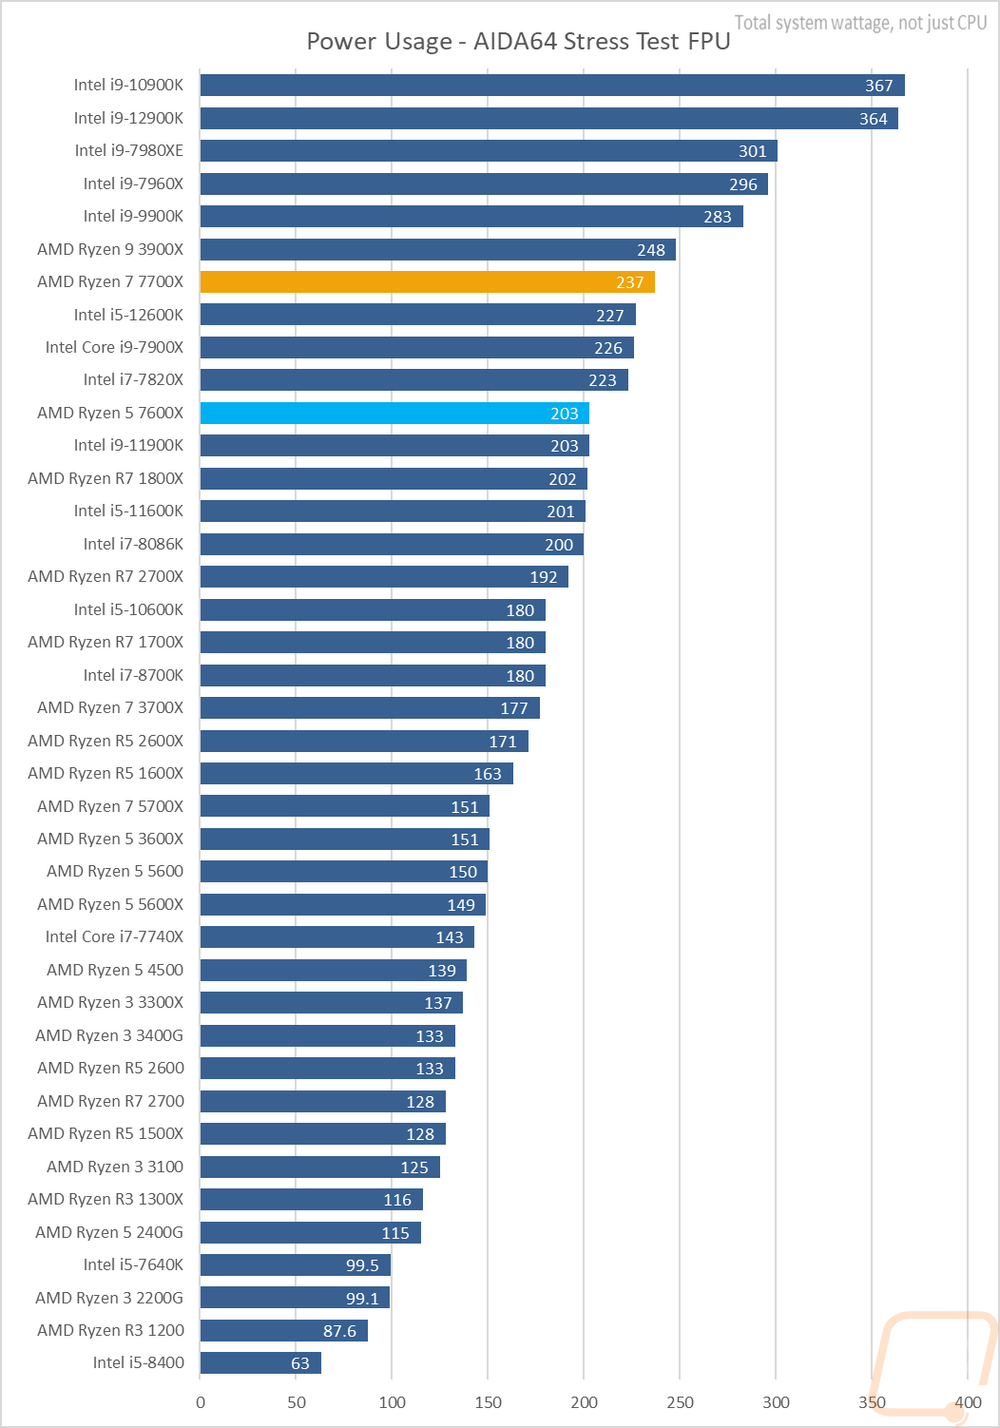
For some people, performance is the only thing important, but for others, power usage and temperatures also play a role so we do take a look at both of those as well. This is especially important in SFF or even just smaller mid-sized builds and it affects the components you need to get for your system as well with your PSU and cooler. To take a look at power usage I ran three different tests. I noted the idle power draw of our entire system then I took a look at the load wattage of the system using two different workloads. One was wPrime and the second was AIDA64 using their FPU workload which is extremely demanding. At idle the testbench with the 7700X was pulling a lot more than I would have expected at 97.7 watts and the same with the 7600X which was at 95.1 watts with 1% or less CPU usage. I hope that is something that can be addressed in the future with an update or maybe it is a mistake on my part that I can’t find. With the CPUs loaded up though power usage for the 7700X in wPrime was 225 watts and the 7600X was even better at 193 watts. AIDA64 did increase the power draw on both CPUs with the 7700X going up to 237 watts and the 7600X to 203 but overall both used less power than CPUs that were slower across the board.
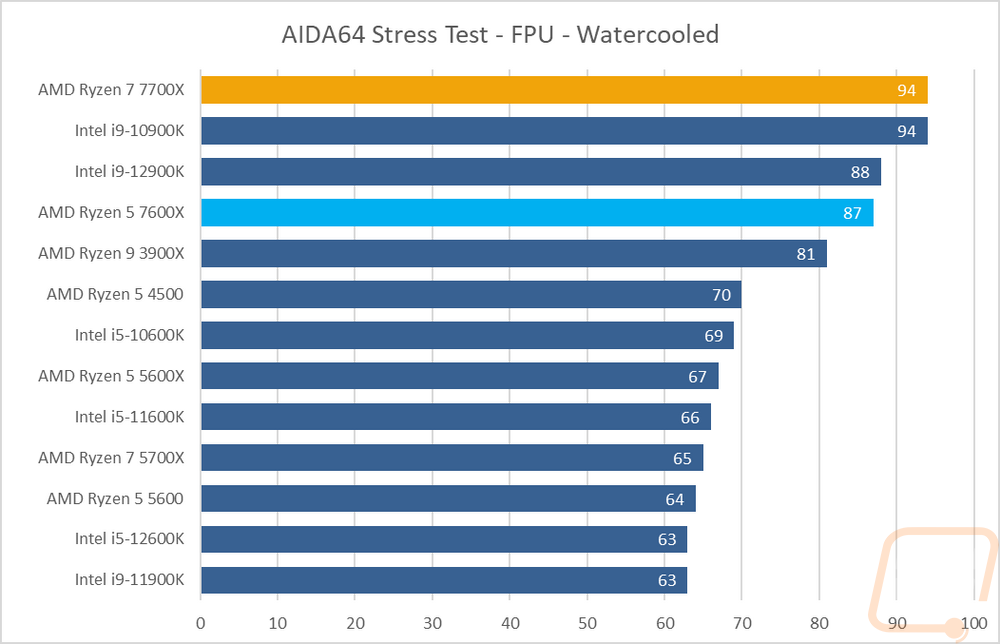
AMD has both the Ryzen 7 7700X and the Ryzen 5 7600X listed as tower cooler capable whereas the new 7950X and 7900X are listed as needing a 240/280mm cooler. What complicates things though when it comes to getting a look at the temperatures is with precision boost 2 the CPUs will overclock up if you have the thermal capabilities. This means a few things. For one it means that even with the 240mm AIO used on our test bench that it will ramp up and still get hot. Intel does the same thing on most motherboards unless you have the wattages set to Intel’s suggested wattages which is what was done in our testing. But with Ryzen 7000 they are uncapped so this isn’t the best comparison. This overclocking however does mean that you get better performance depending on how good your cooling is. For the 7700X it leveled out at 94c in my testing which also tells us that it could still benefit a little bit from an even larger cooler. The 7600X on the other hand ran cooler at 87c. Overall they run warm and it makes me curious to see how the Ryzen 9 CPUs handle the same cooler.
Overall and Final Verdict
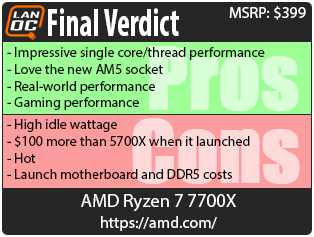
AMD's 7000 Series CPUs and Zen 4 have been a long time coming and with just the four CPUs launched today, it seems that there will be more 7000 series to come in the future as they fill out their product stack. The Ryzen 7 7700X and Ryzen 5 7600X that I’ve taken a look at here today are both exciting with the single core/thread performance of the new architecture standing out in today's testing. The IPC performance is so good that the 7600X and the 7700X which are just 6 and 8-core CPUs outperformed almost everything that I’ve tested in the past except for the i9-12900K which is Intel’s flagship and costs nearly $600. In some of the tests that matter the most to me like gaming and real-world tests like Microsoft Office, Photoshop, Premier Pro, and web browser performance both CPUs did often top the charts. Who would have thought that either would have been a better pickup for those workloads?
The new AM5 socket brings more PCIe lanes and power which opens up the options as far as motherboard features. Not to mention AMD now has DDR5 and PCIe 5.0. The future is here! They haven’t skimped on the USB options when it comes to high-end chipsets as well, the Asus ROG Crosshair X670E Hero that AMD sent with our test kit has 8 Type-A connections and four Type-C connects on the rear I/O alone. With all of those being USB 3.2 Gen 2 speeds at a minimum and come being 3.2x2 or USB 4.0. That does lead me to one issue I am seeing for the initial launch. The X670 and X670E chipsets are launching tomorrow along with the four CPUs and the cheapest board options will be around $290 and boards like the Hero are $699. Add to that DDR5 which has come down in price some but without the flexibility of DDR4 or DDR5 like Intel has the initial buy-in cost for a new Ryzen 7000 Series setup is going to be expensive. AMD does have mid-range chipsets coming next month so those who don’t want to break the bank will just need to be patient. Beyond that both CPUs did have unusually high power usage at idle and because of how precision boost 2 adjusts clock speeds they had no problem cranking things up and using all of our 240mm AIO in testing.
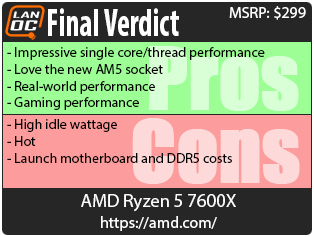
As for pricing, the Ryzen 7 7700X has an MSRP of $399 which isn’t too bad for the performance you are getting. It is a $100 jump over its predecessor's launch price of $299, but that does get a little complicated because the 5600X also had a launch price of $299. Speaking of $299, that is the MSRP of the Ryzen 5 7600X and for me, this is looking like a great option. You can get great gaming performance and real-world office/photoshop/premiere pro performance is great. On top of that, you are getting in early in a socket that we know AMD will keep around for a long time which means upgrade options in the future and upgrade options as far as PCIe 5.0 for your GPU and storage if you end up with an X670E board.

Live Pricing: HERE

Live Pricing: HERE


