CPU Performance
Before jumping into testing, I want to address MCE and our testing. Turning on MCE in the motherboard BIOS is officially within Intels specifications but it opens up a lot of variability when testing. For simplicity, I have MCE off in our main testing but I do take a look at MCE performance as well as Intel's Adaptive Boost father down the page. So keep in mind that to compare results with ours MCE or a similar option depending on the motherboard will need to be off. This is especially important later when I look at thermals and power which MCE makes a HUGE difference on. Anyhow all of our testing here is done with XMP turned on and with an H100i 240mm water cooler, see the previous section for more information on the tests and our test system.
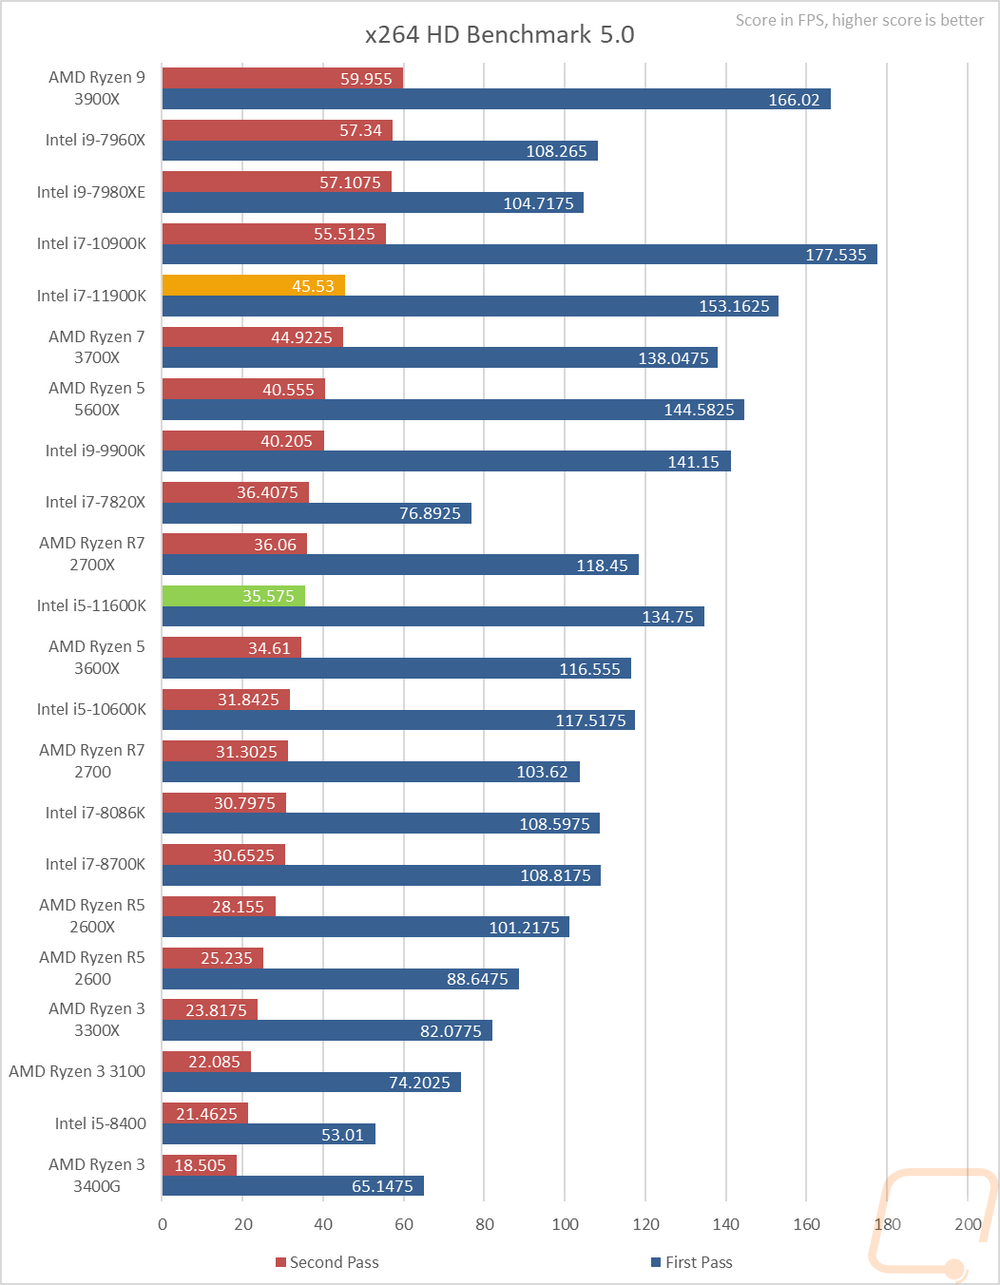
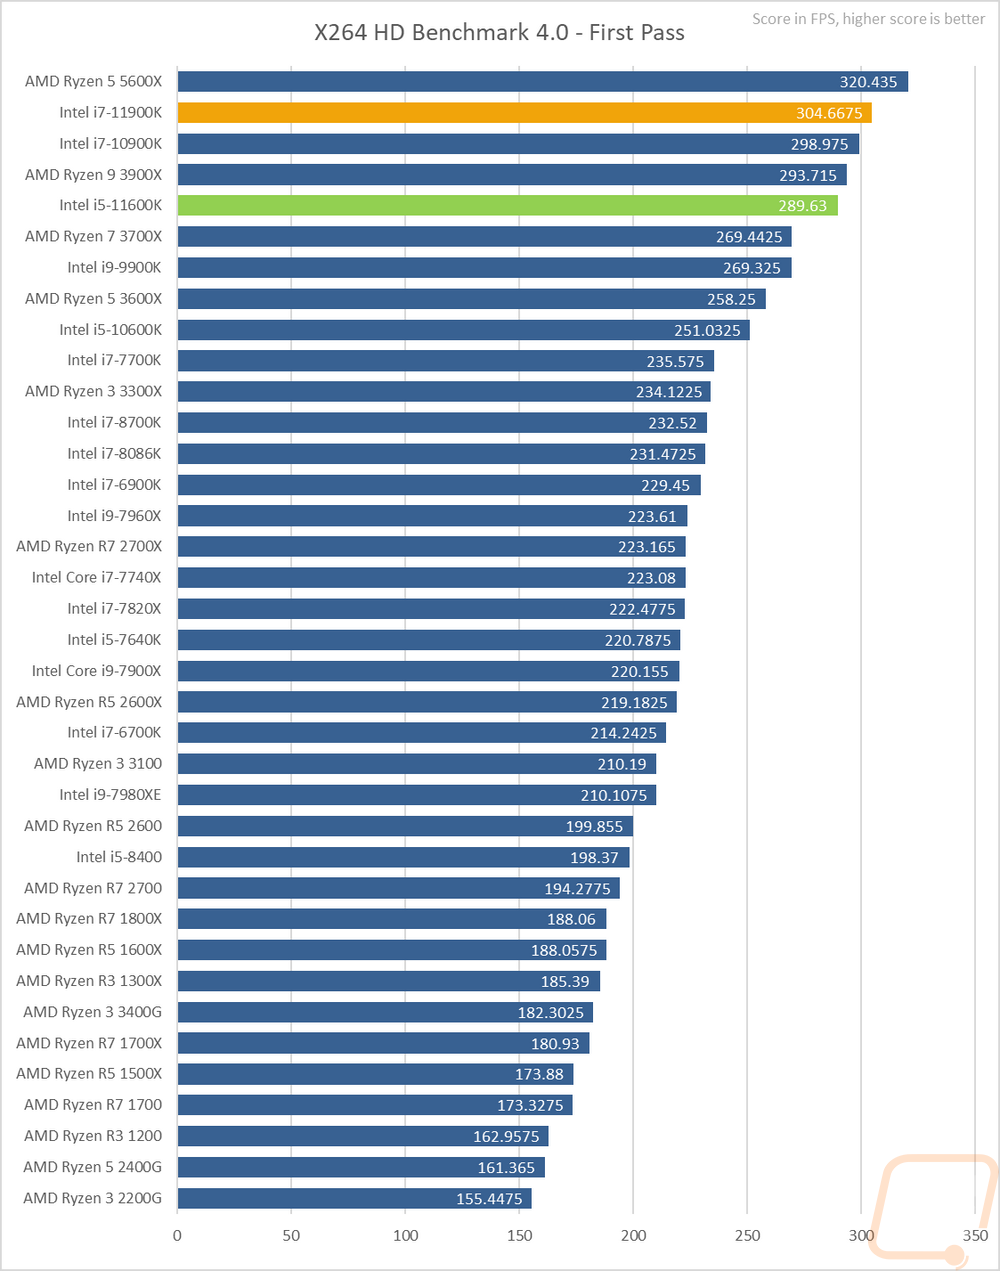
So for my first tests, I take a look at encoding performance using X264 HD with its older 4.0 and newer 5.0 versions. This is an area in which Intel has always done well but the last few generations of Ryzen have made huge steps forward. In the 5.0 test, the 11900K didn’t do too bad but wasn’t up at the top of the charts like you would expect. The decision to drop down to 8 cores made a difference here with the 10 core 10900K even outperforming in the first pass especially. The 11600K on the other hand didn’t do bad but did come in behind the AMD 5600X. In the older 4.0 test the 11900K did better being up at the top of the Intel CPUs test but the Ryzen 5600X (which was the only 5000 series Ryzen CPU we have been able to get our hands on) was out ahead on this IPC focused benchmark.
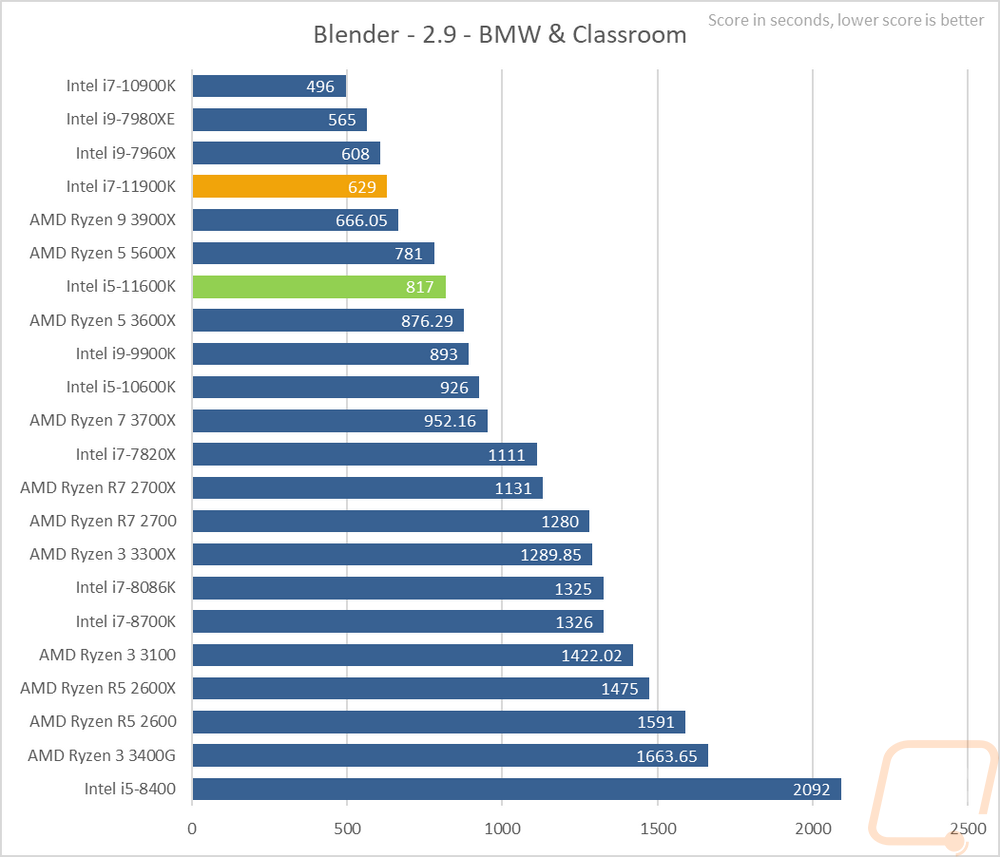
3D modeling is always popular and the open-source program blender is one of the best ways to get into it. I’ve run their standard benchmark on the quick benchmark setting. This test just times running through two files being rendered (BMW and Classroom). Lower scores are better here and while the 11900K didn’t do bad, the older high core count CPUs are still out ahead of it here as well as the 10900K with its extra two cores. The 11600K came in behind the 5600X but is a good bump in performance from last generation's 10600K.
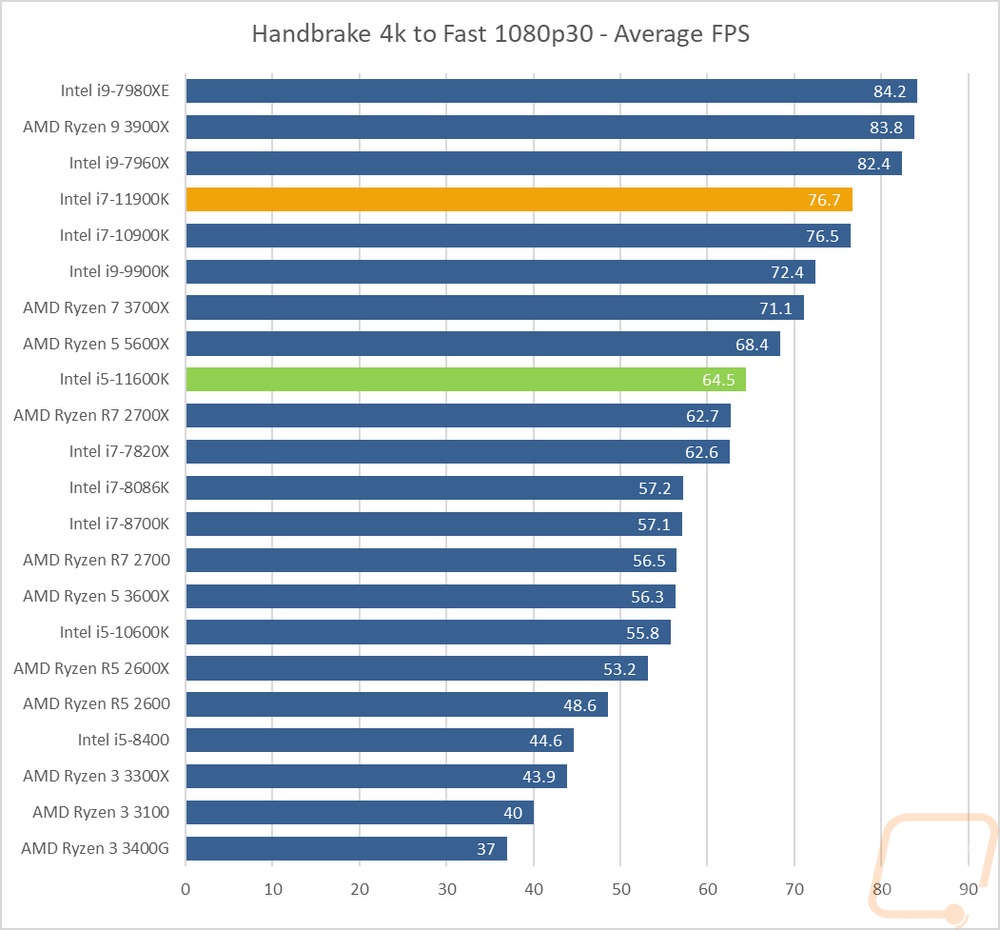
Continuing with the video encoding theme I also have handbrake which is a which is an open-source transcoder. For this test I am taking a 4k video down to 1080p 30 FPS, the results are the average FPS of that task. The higher core count CPUs are mostly out ahead here but the 11900K did come in nearly tied with the 10900K with its 2 extra cores. The 11600K was 4 FPS below the 5600X and a big jump over last year's 10600K.
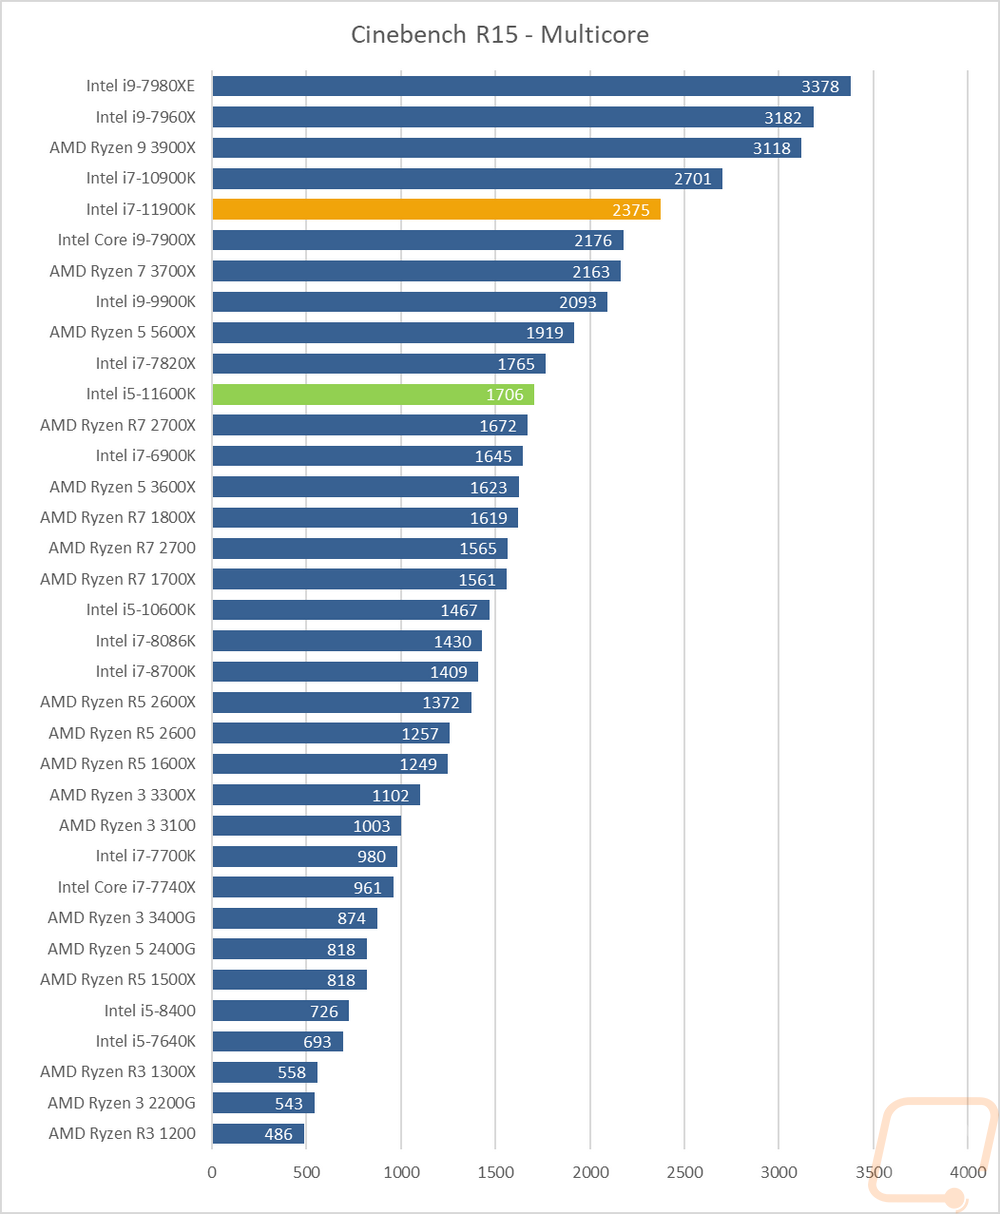
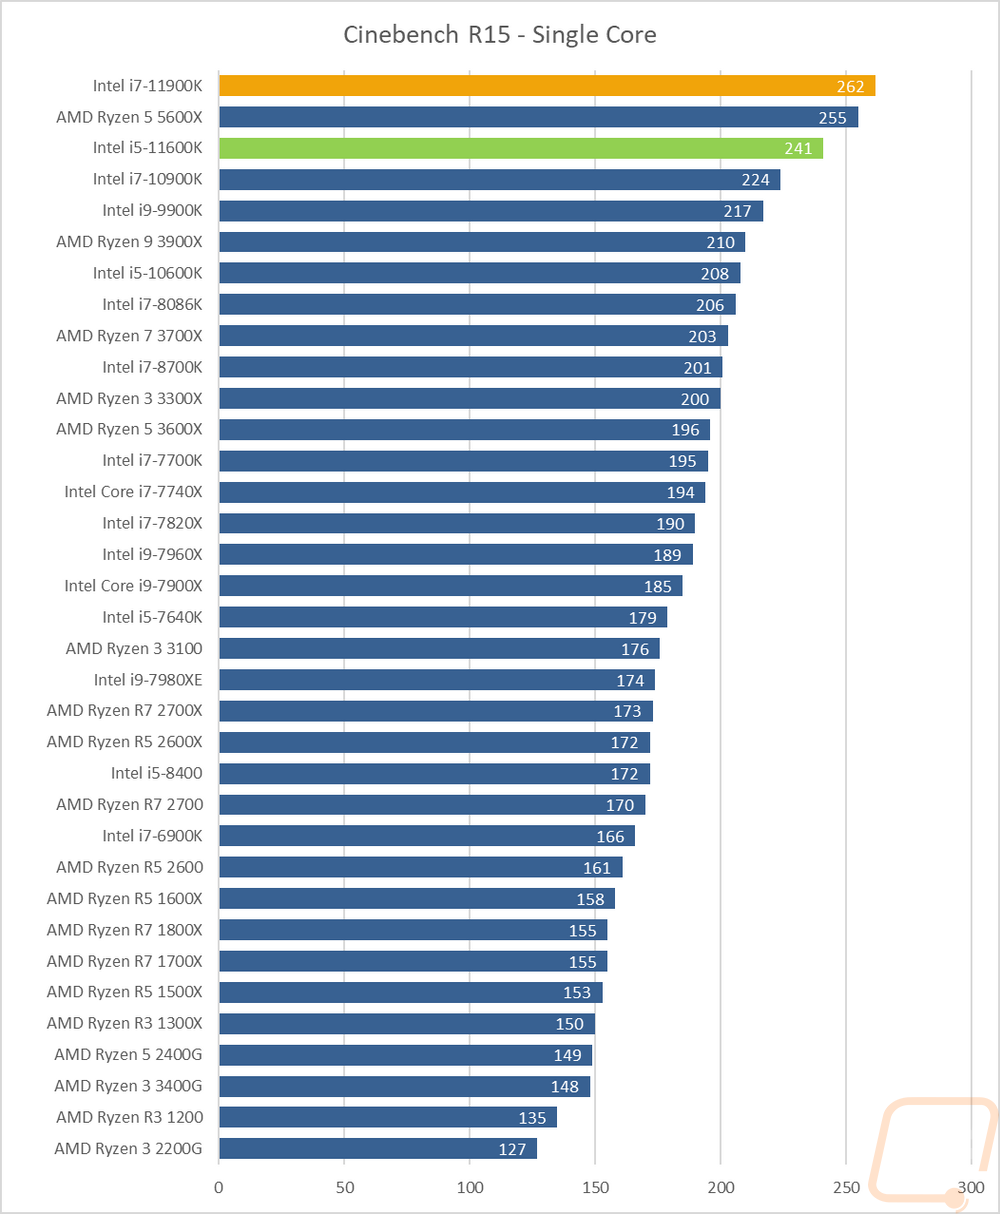
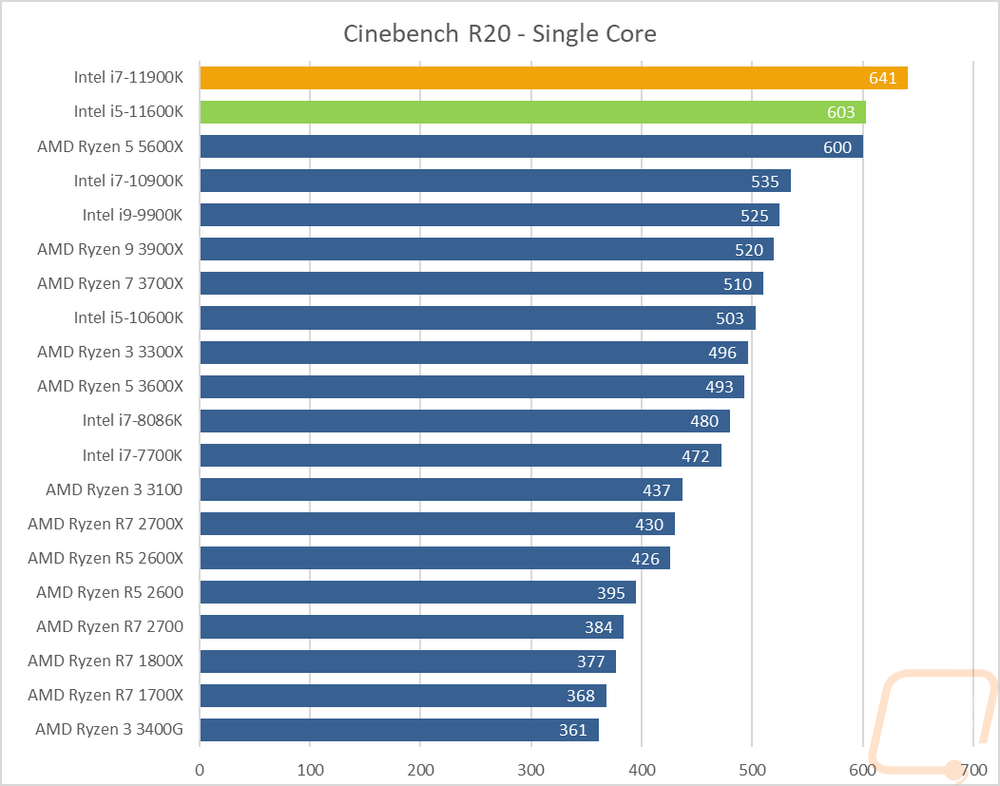
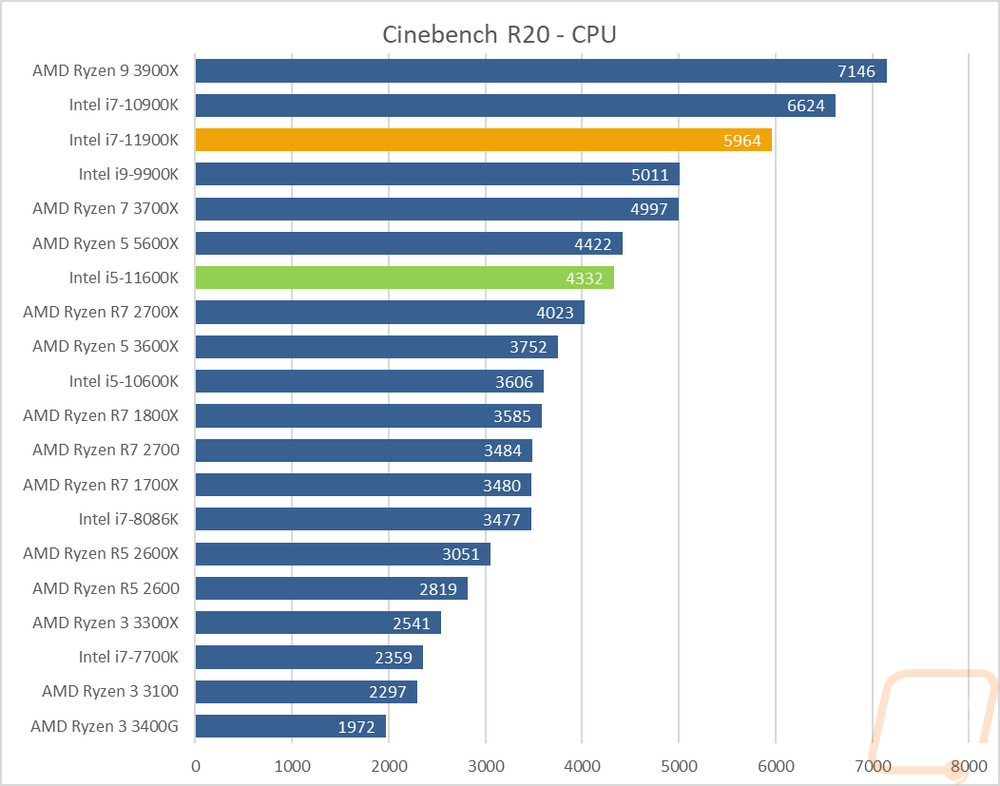
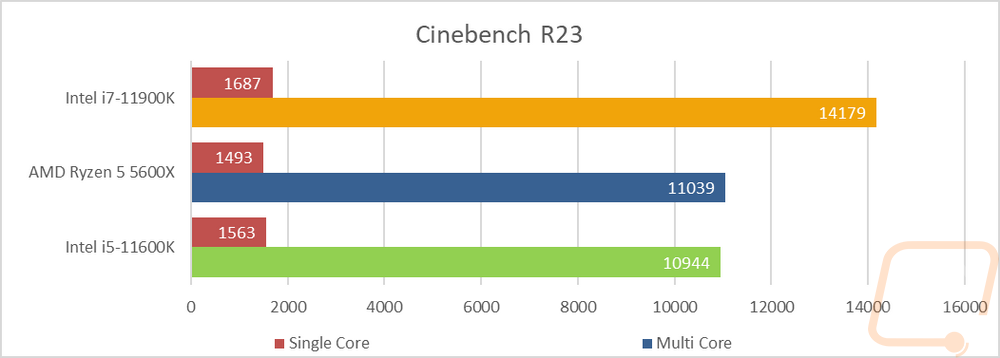
For the always popular Cinebench, I ran the older R15 test which better fits a 4 core CPU, and the new R20 for high core count CPUs as well as the latest R23 as well. R15 multicore has the 10+ core count CPUs out in front including the 10900K. But when it comes to pure IPC the 11900K was out in front with the 5600X behind it then the 11600K and then everything else. This was similar in R20 and R23 which had the two 11th gen core CPUs out ahead of the 5600X as well. But the multi-core tests in all three still come back down to core count as you would expect and the 11900K being down two cores couldn’t keep up even with a higher IPC.
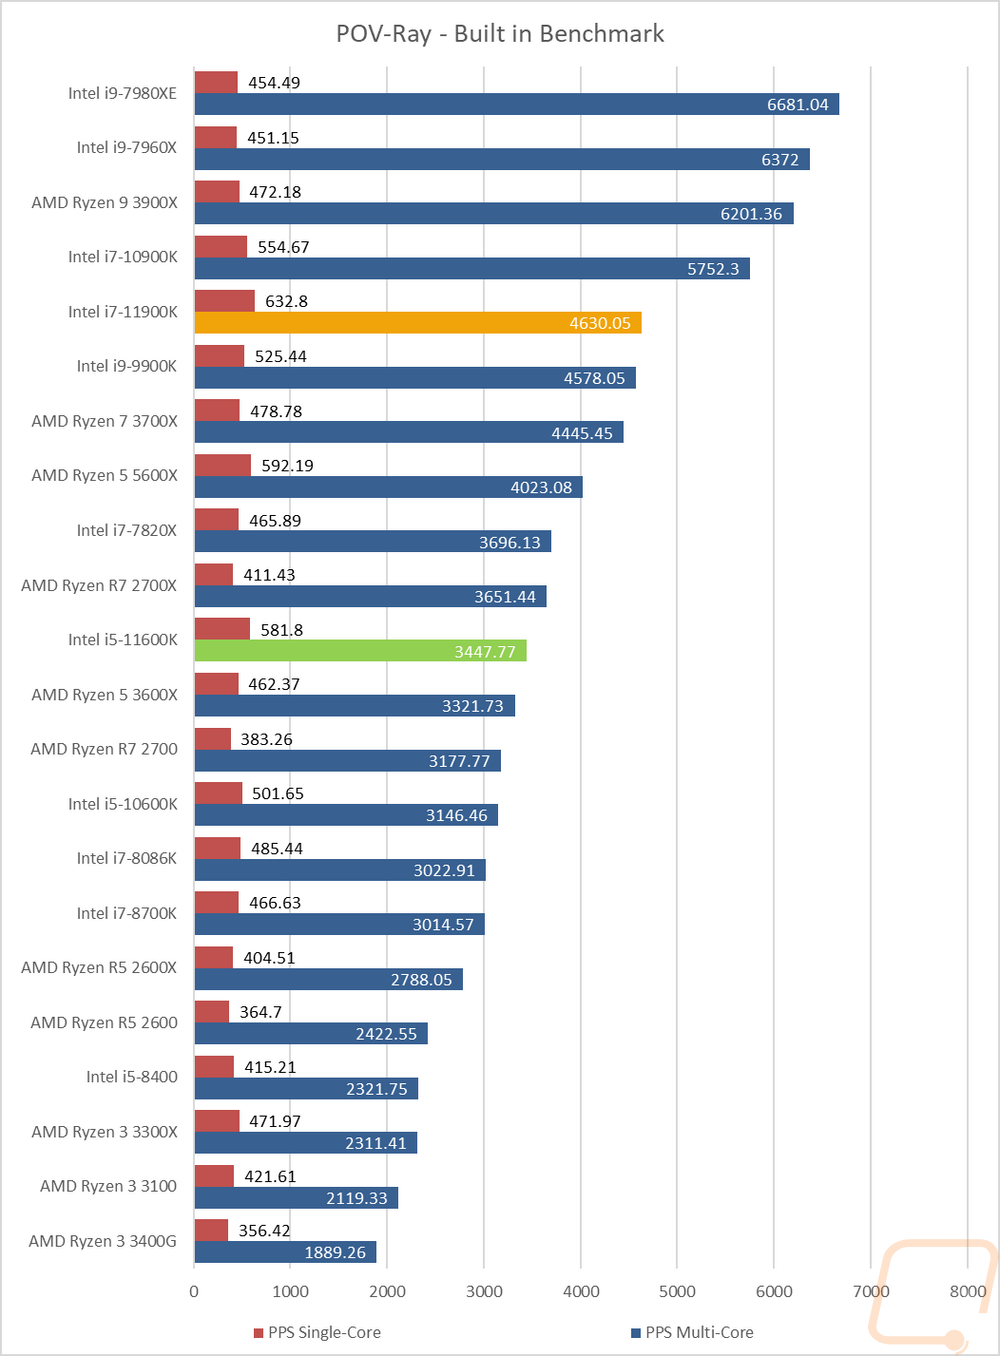
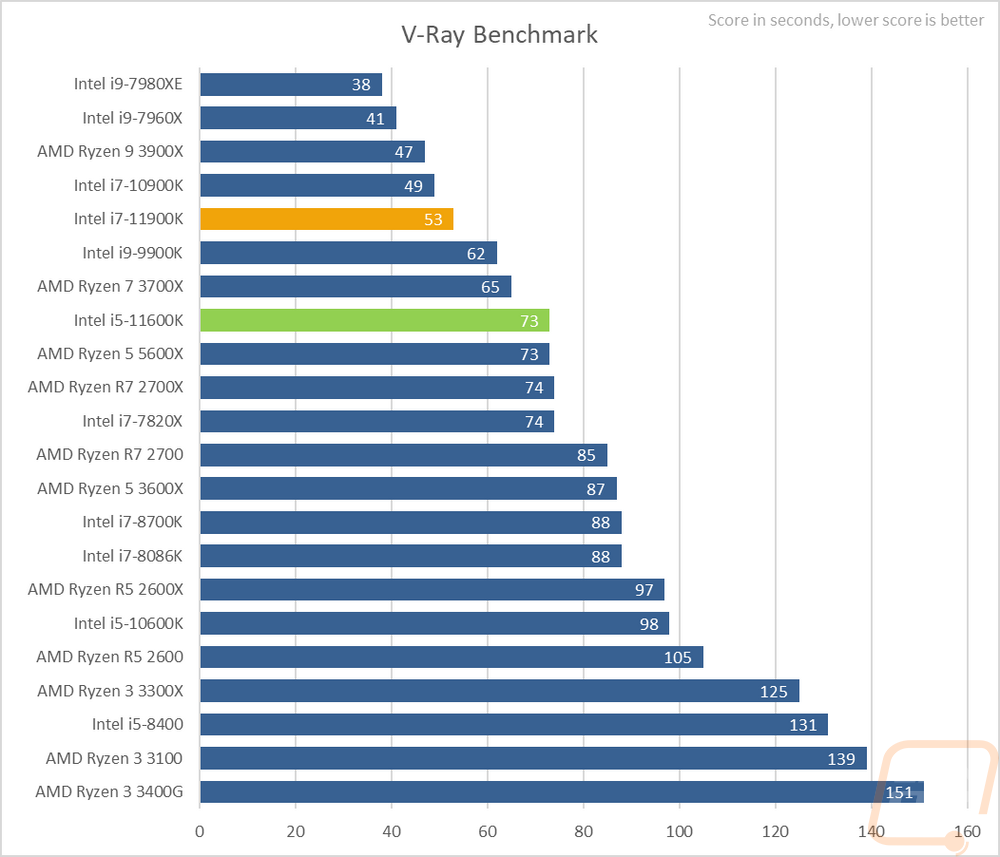
Ray tracing is picking up on the GPU side of things, but when it comes to rendering photos and sometimes videos it has been a thing for a while. I’ve run two benchmarks that check out the performance and in POV-Ray the higher core count CPUs still rule all in the multi-core test which has the 11900K even right with the older 9900K even with a big IPC improvement between the two. The single-core test however has the 11900K out in front there with the 5600X the first CPU back. In V-Ray, the core count still defined the results with even the 11600K and the 5600X tied as well.
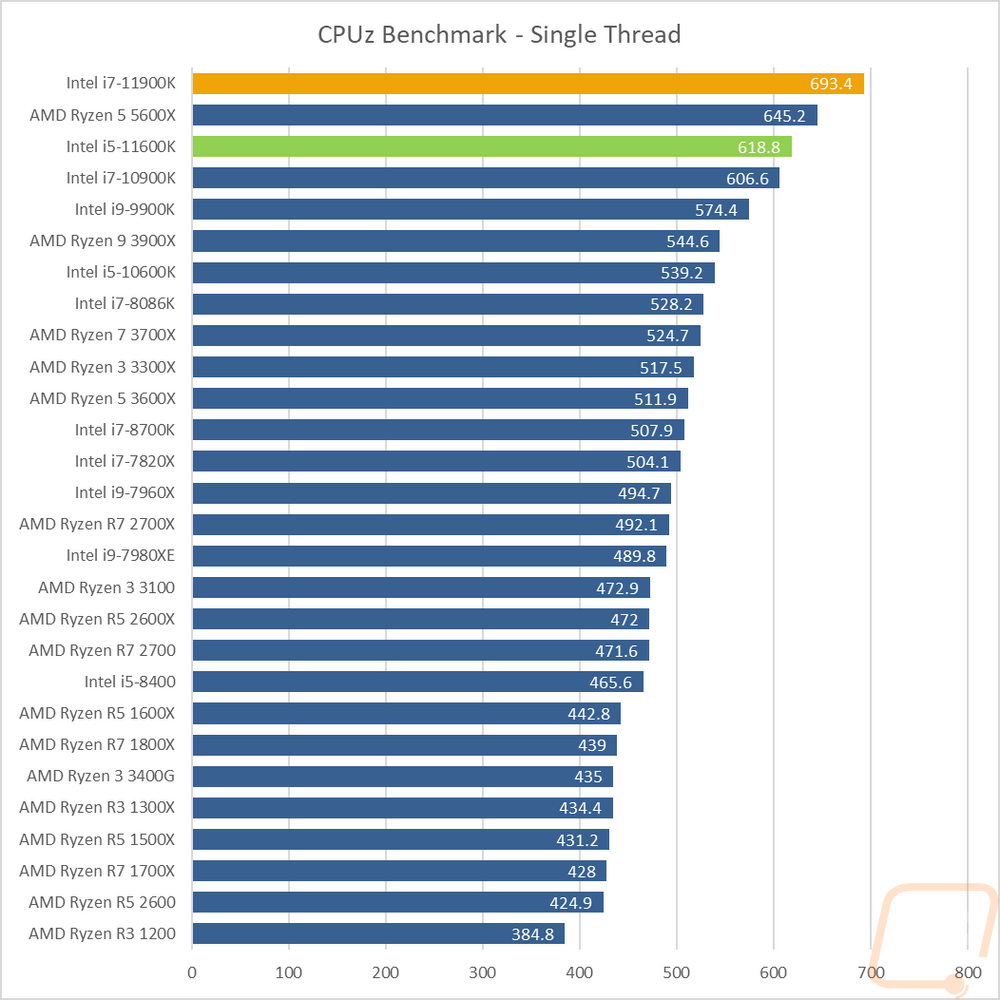
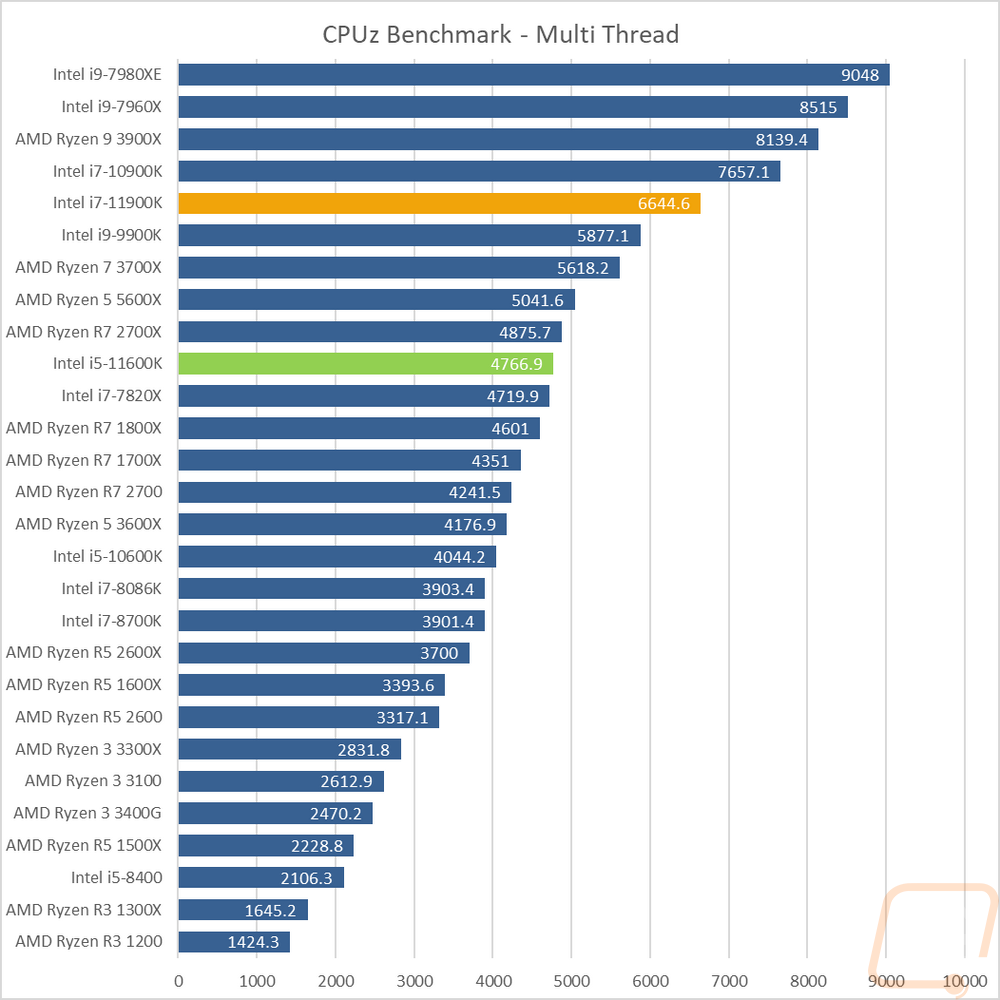
Most people use CPUz to check out a few clock speeds, your BIOS version, and other information. But they do have a benchmark slipped in as well at the back and I like it because it does split up performance between multi-core and single-core. The single-core test here has the 11900K way out ahead of the pack which isn’t a surprise, the 5600X in second, then the 11600K behind that running near the 10900K. The multi-thread test on the other hand is sorted again by core count.
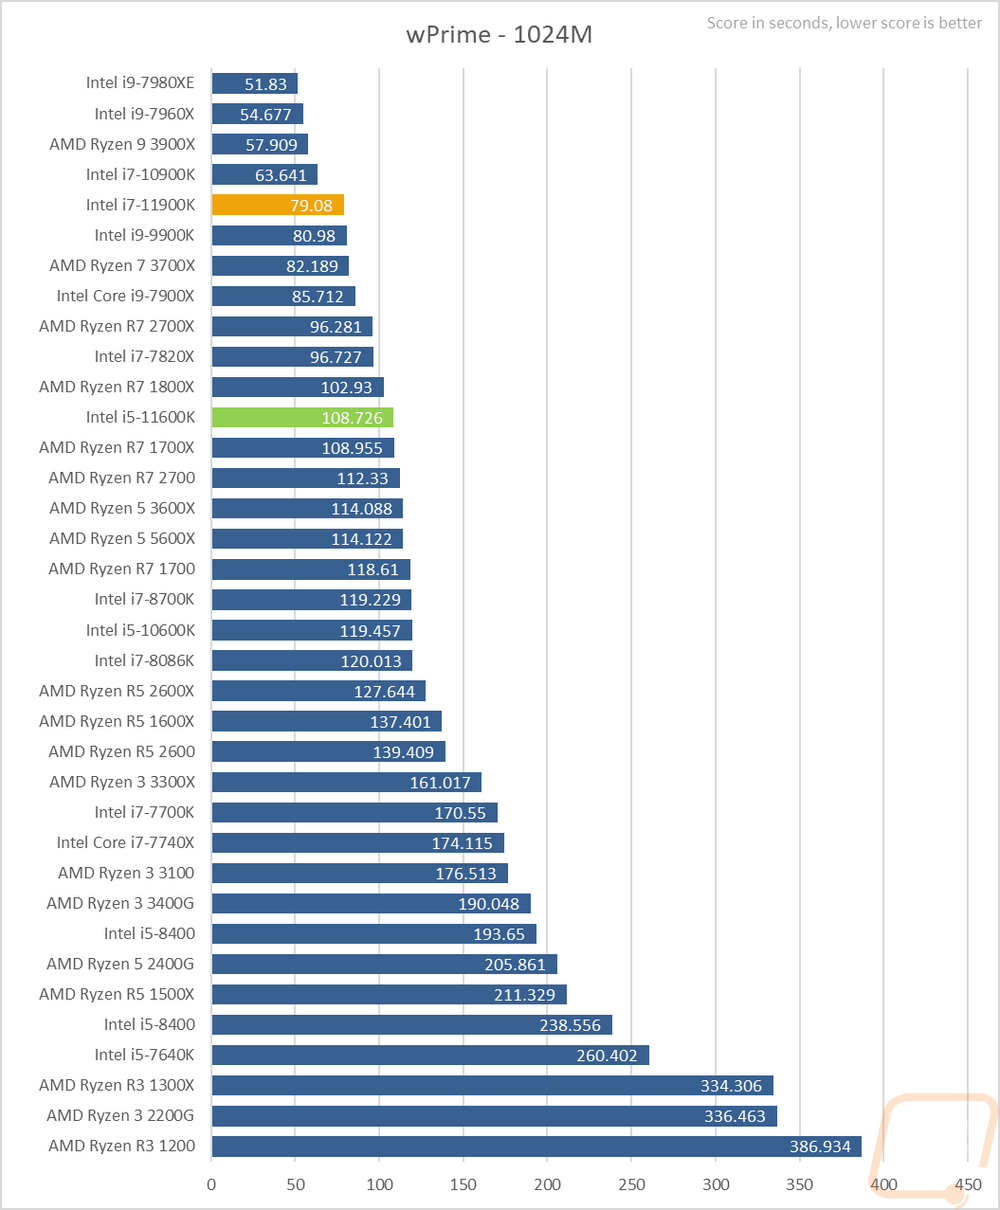
Going back to the basics I tested with wPrime which is an old overclocking favorite that takes a look at the time it takes to calculate prime out to 1024 million. Core count is still king here, but clock speed does help which is why overclockers have used this one. The 11900K is up near the top behind all of the higher core count CPUs. The IPC gap between it and the 9900K was only enough to shave off a little under two seconds when you compare the two. Here the 10600K is out way ahead of the 5600X.
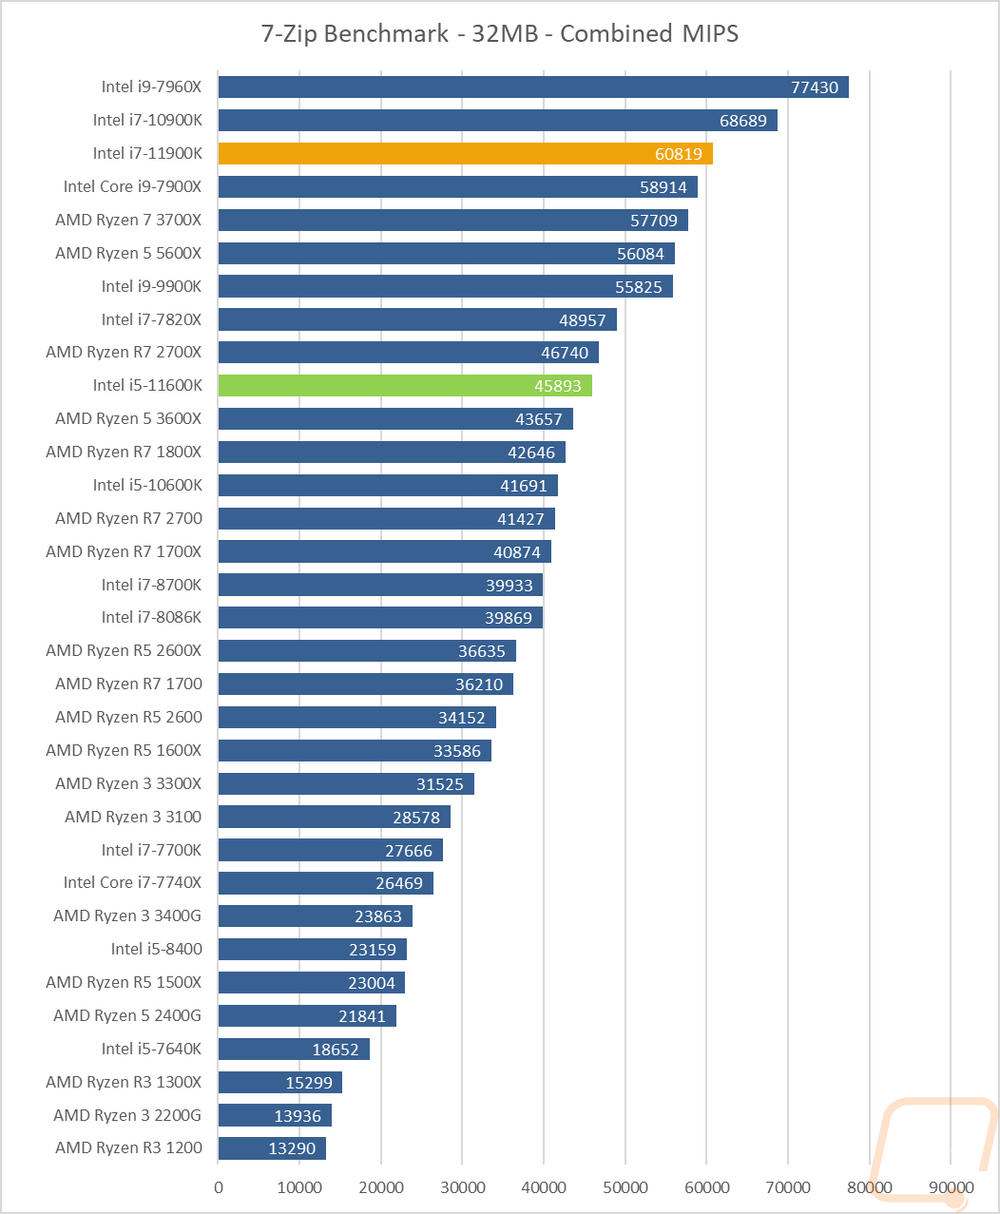
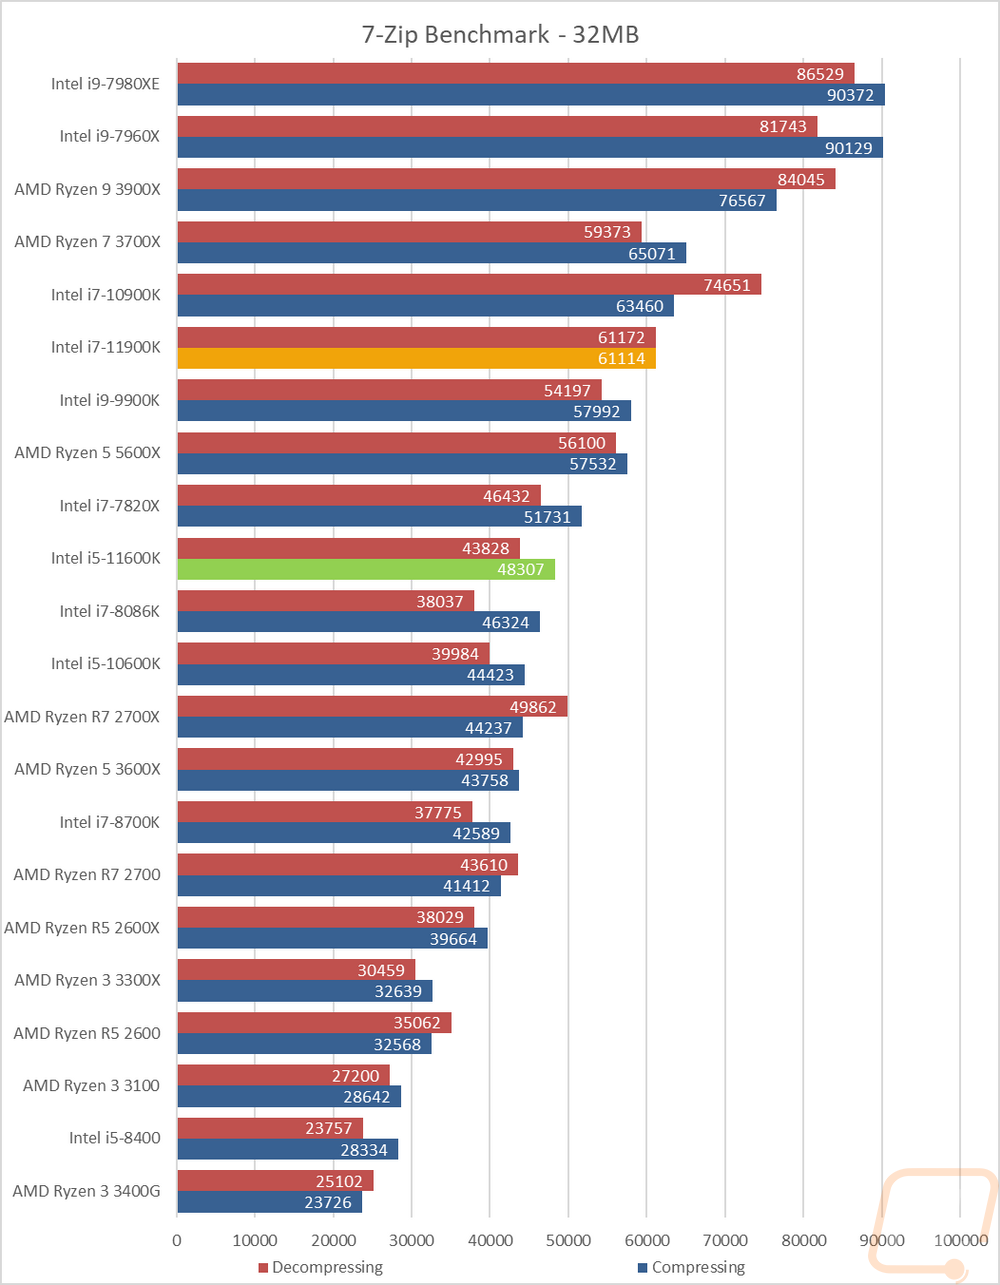
7 Zip is another open-source program, this time for compressing and decompressing all of your files. Here I have run the benchmark and we have three results. The combined MIPS which is a combination of compressing and decompressing performance. Then I have it broken down between the two. This workload likes extra cores which can be seen with the Core-X CPUs, 10900K, and high core count Ryzen CPUs up at the top. The combined MIPS results on the other hand still have the higher core counts up top but with the 11900K up closer to the top.
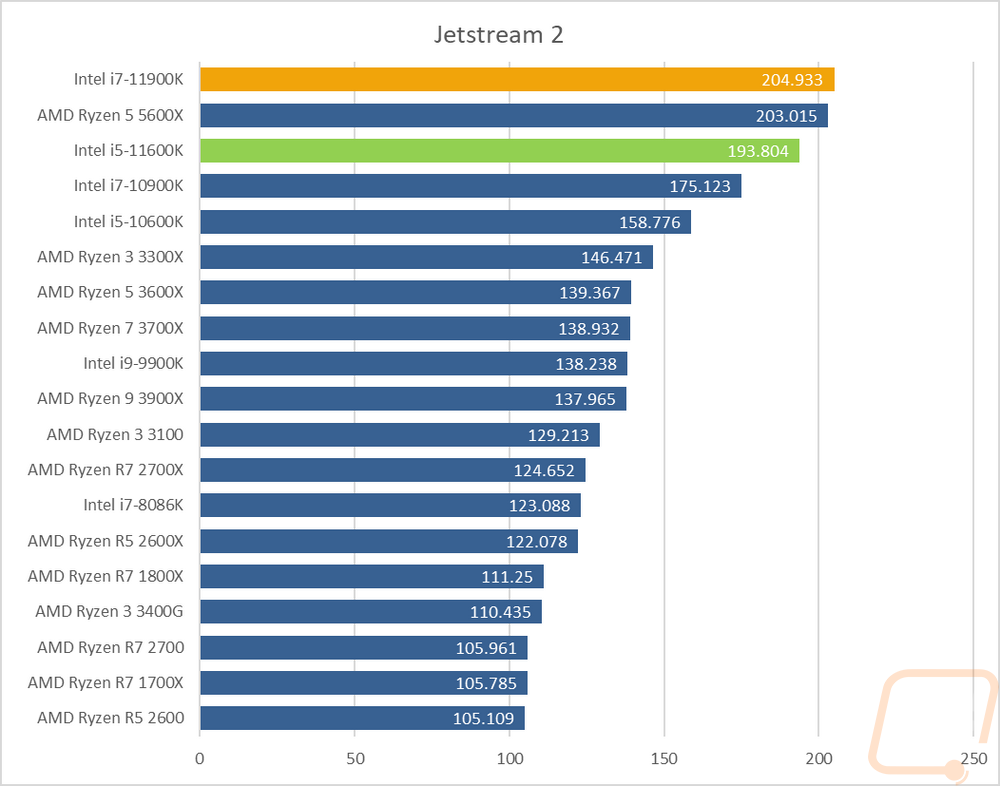
Jetstream 2 is a compilation benchmark which takes a long list of HTML5 and Java in-browser tests and runs them all three times and puts together an overall score. I love this benchmark because lets be honest, most people are using their browser more than any other game or program. Jetstream gives some interesting results sometimes though. It does tend to favor higher IPC which you can see with the 11900K at the top and the 5600X and 10600K behind that.
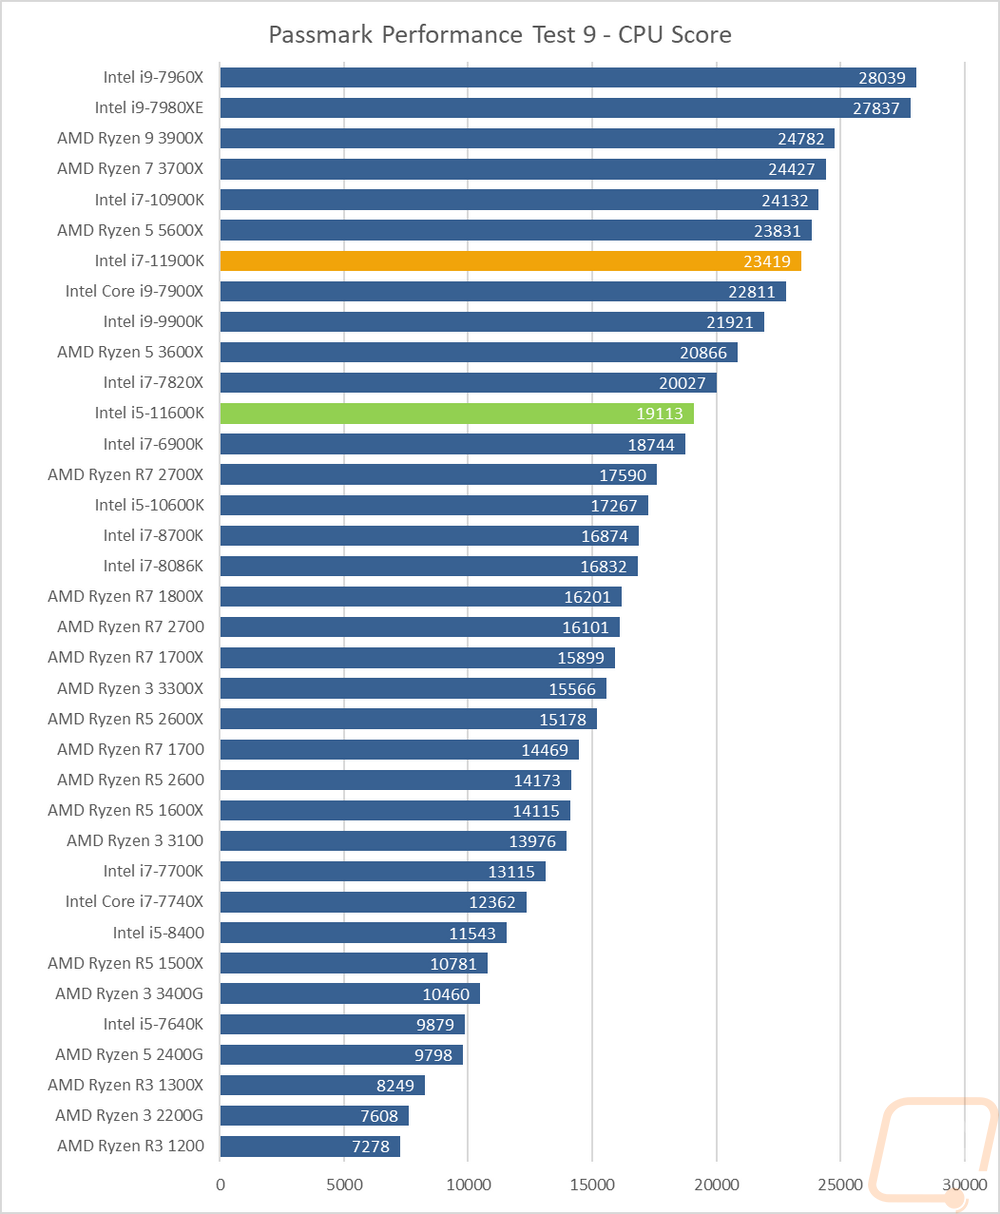
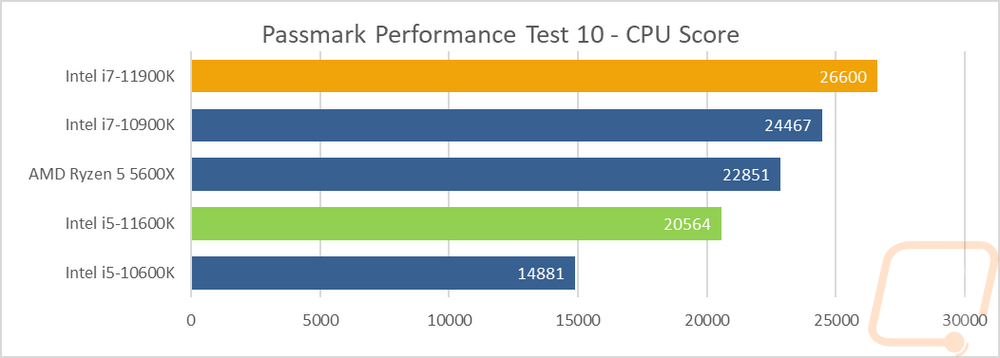
In Passmark performance test, I ran the full CPU benchmark to get a score. I did this using the older 9.0 and the newer 10.0 tests. It isn’t a big surprise however that these like higher core counts with the 10+ core CPUs up top but the 5600X did really well here and is out ahead of the 11900K and the 11600K in Passmark 9. In 10 it favors IPC more with the 11900K out ahead of the 10900K.
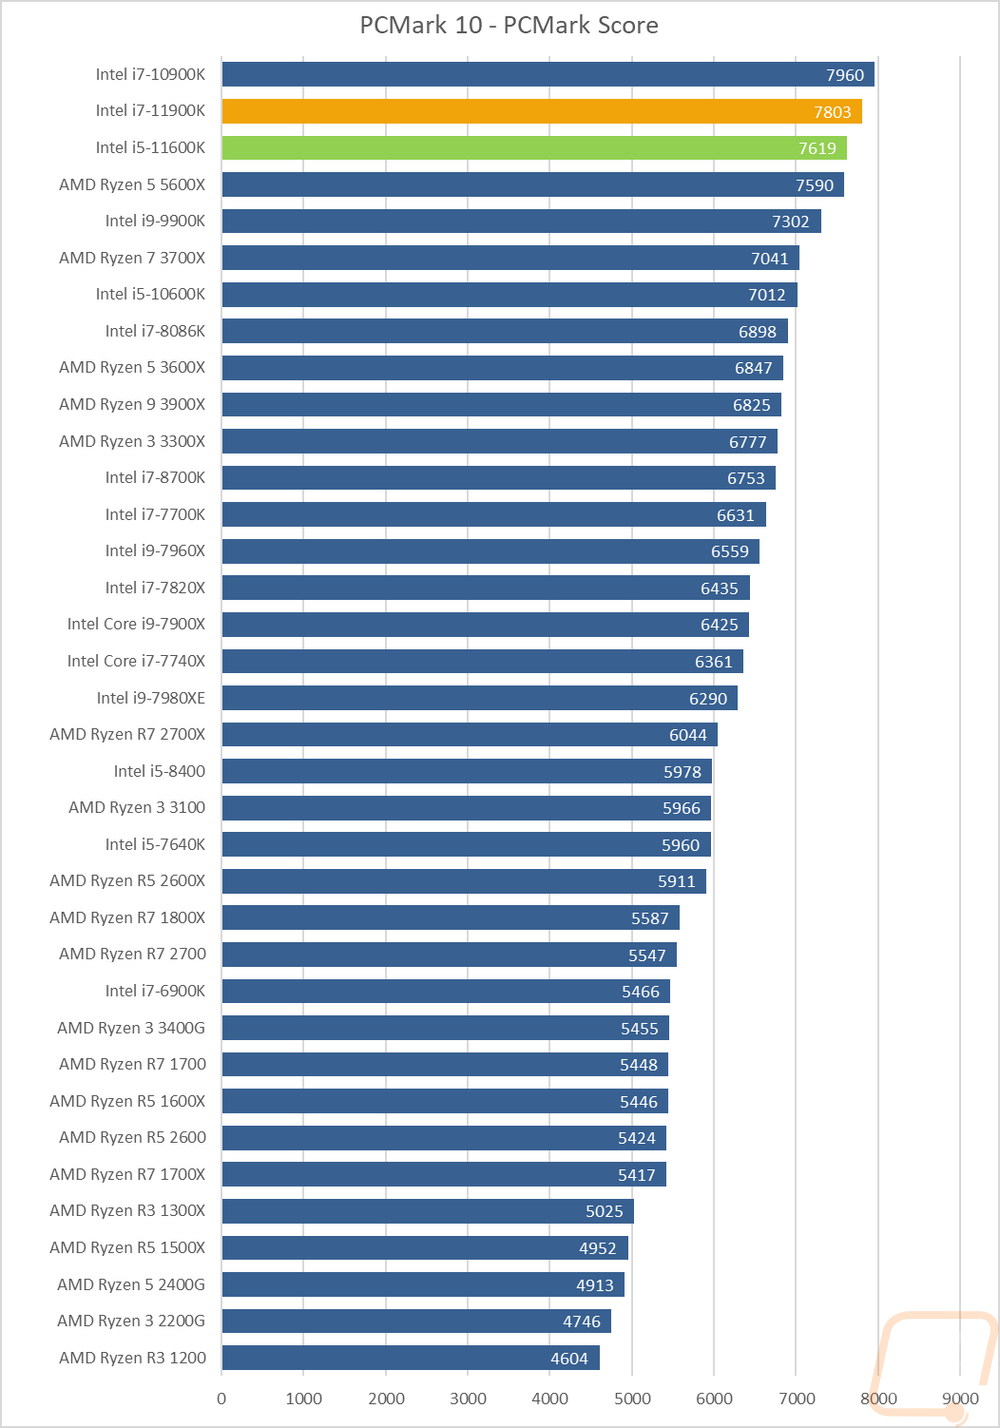
PCMark 10 is a great test because it tests things like video calls, browser performance, excel, and word performance to give an idea of real-world performance. It tends to like higher clock speeds and that is clear when you see the top CPUs but I was surprised that the 11900K came in behind the 10900K here.
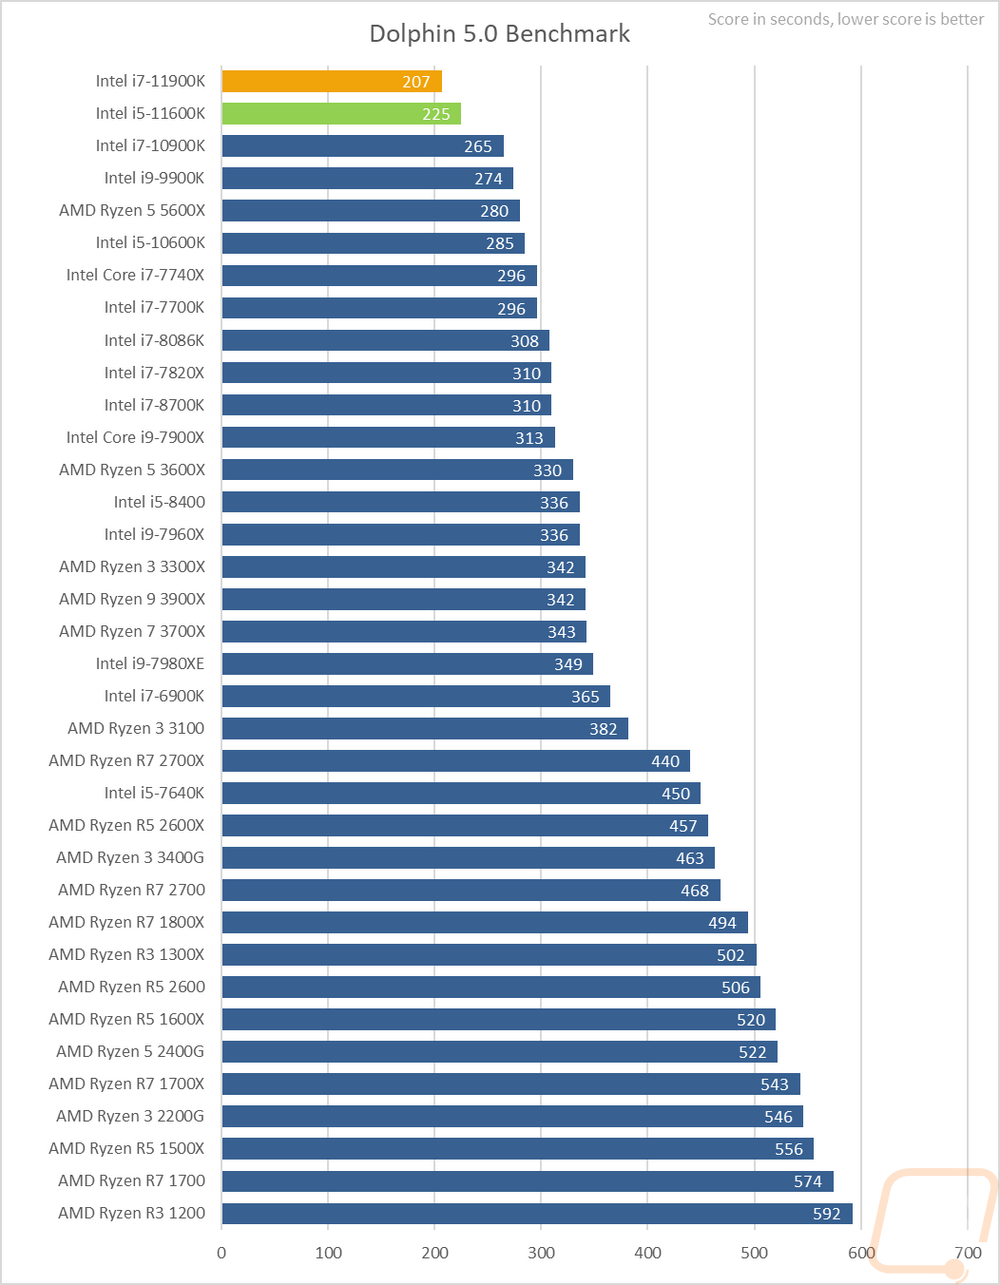
Dolphin 5.0 is a Wii emulator and like most emulators, it doesn’t care about high core counts at all. In fact, it only runs two in total. Clock speeds are king here, in addition to Dolphin favoring Intel in general. The 11900K and the 11600K top the chart here with a big gap between them and even the 10900K.
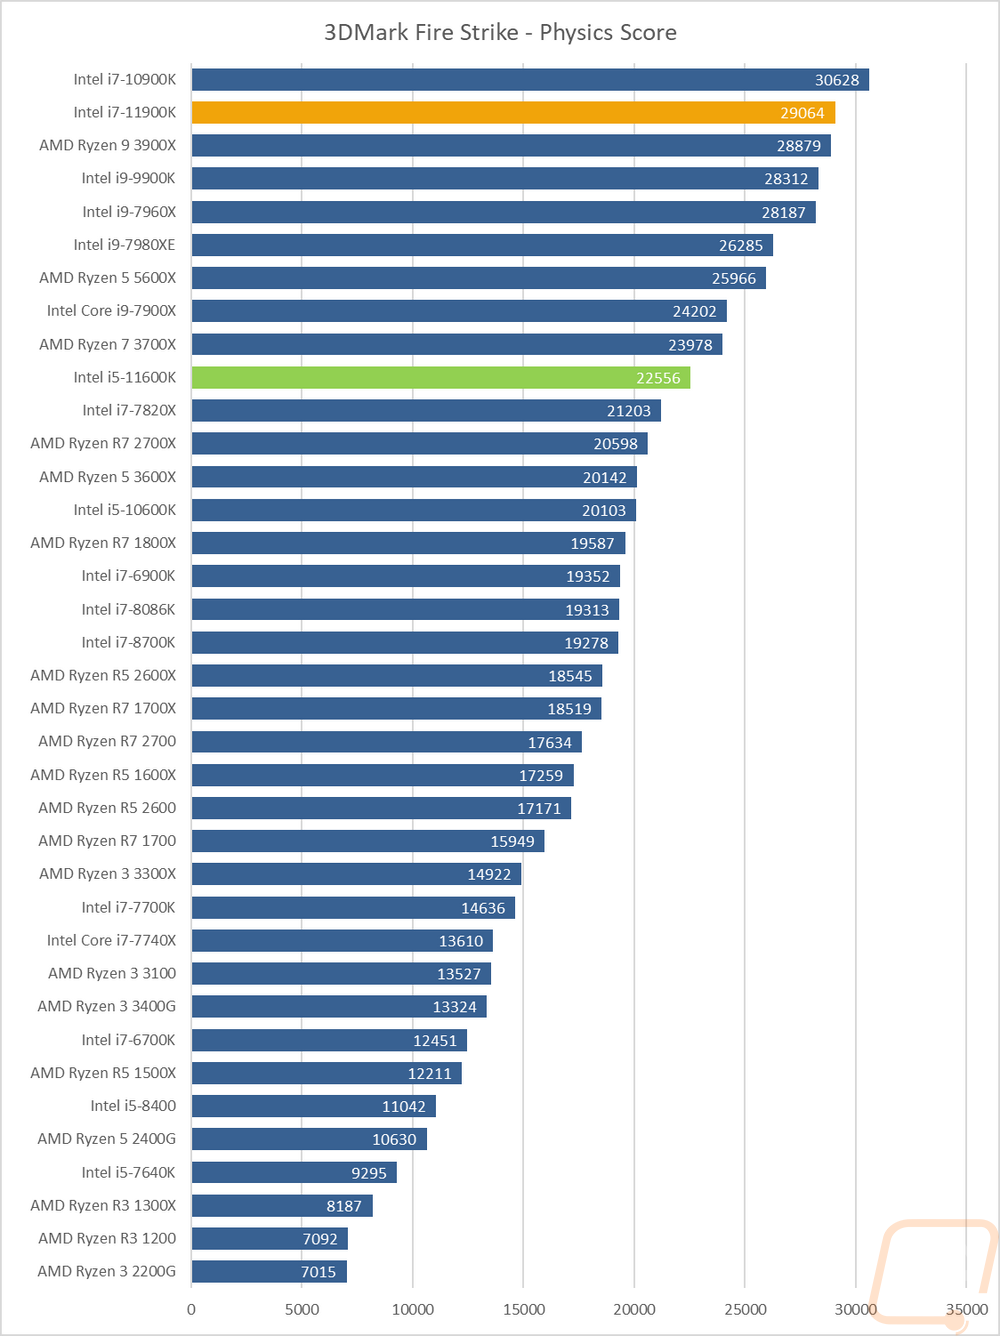
Before diving into game testing I wanted to check out synthetic performance using 3DMark Fire Strike, focusing specifically on the Physics Score which is CPU dependent. The 10900K still tops this chart with its combination of cores and clock speed. The 11900K is behind that but is surprisingly close to the 3900X which uses its four extra cores to make up some ground here.
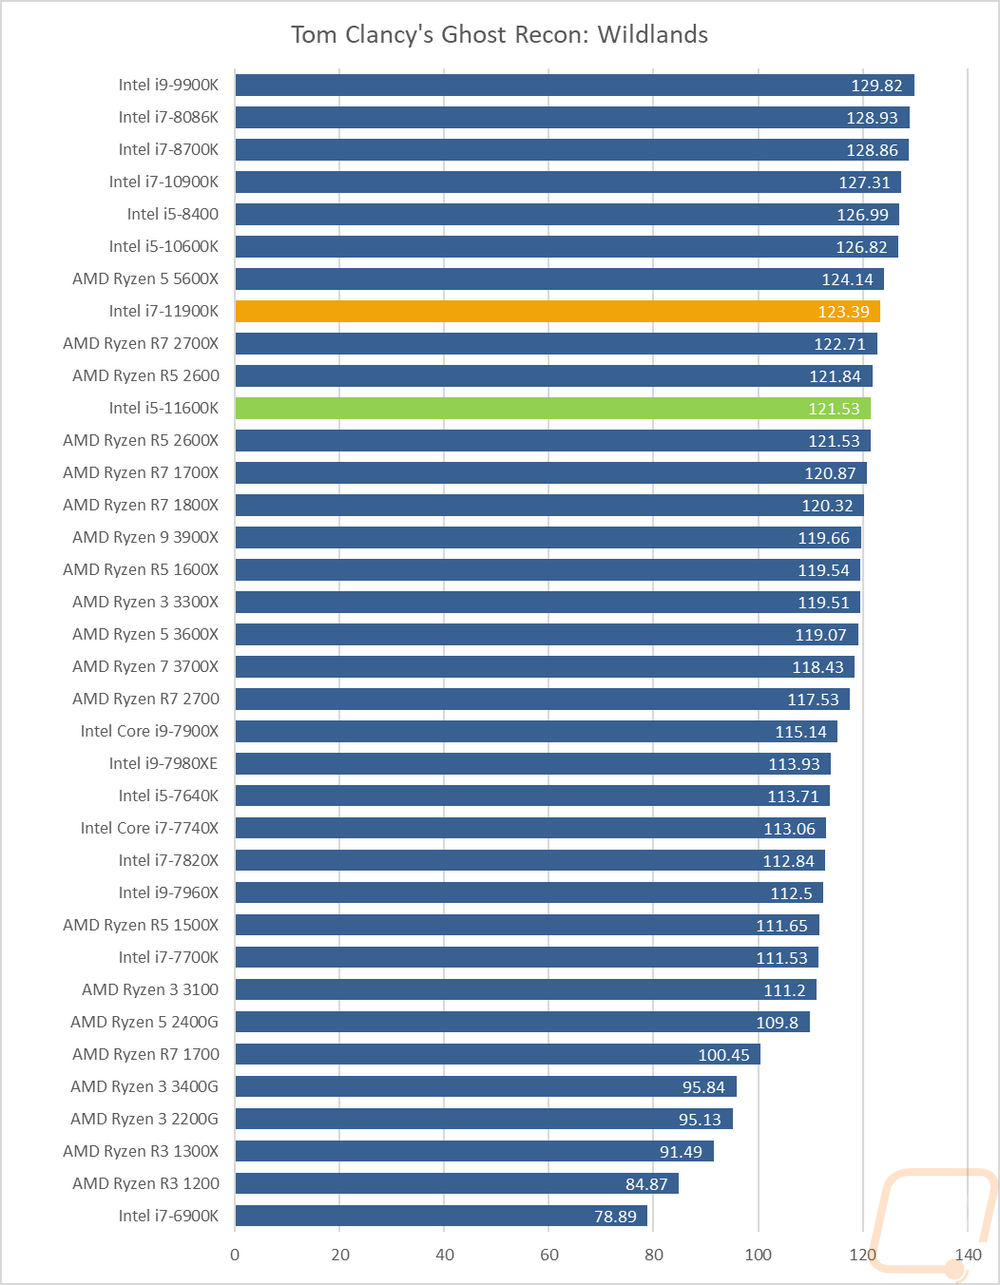
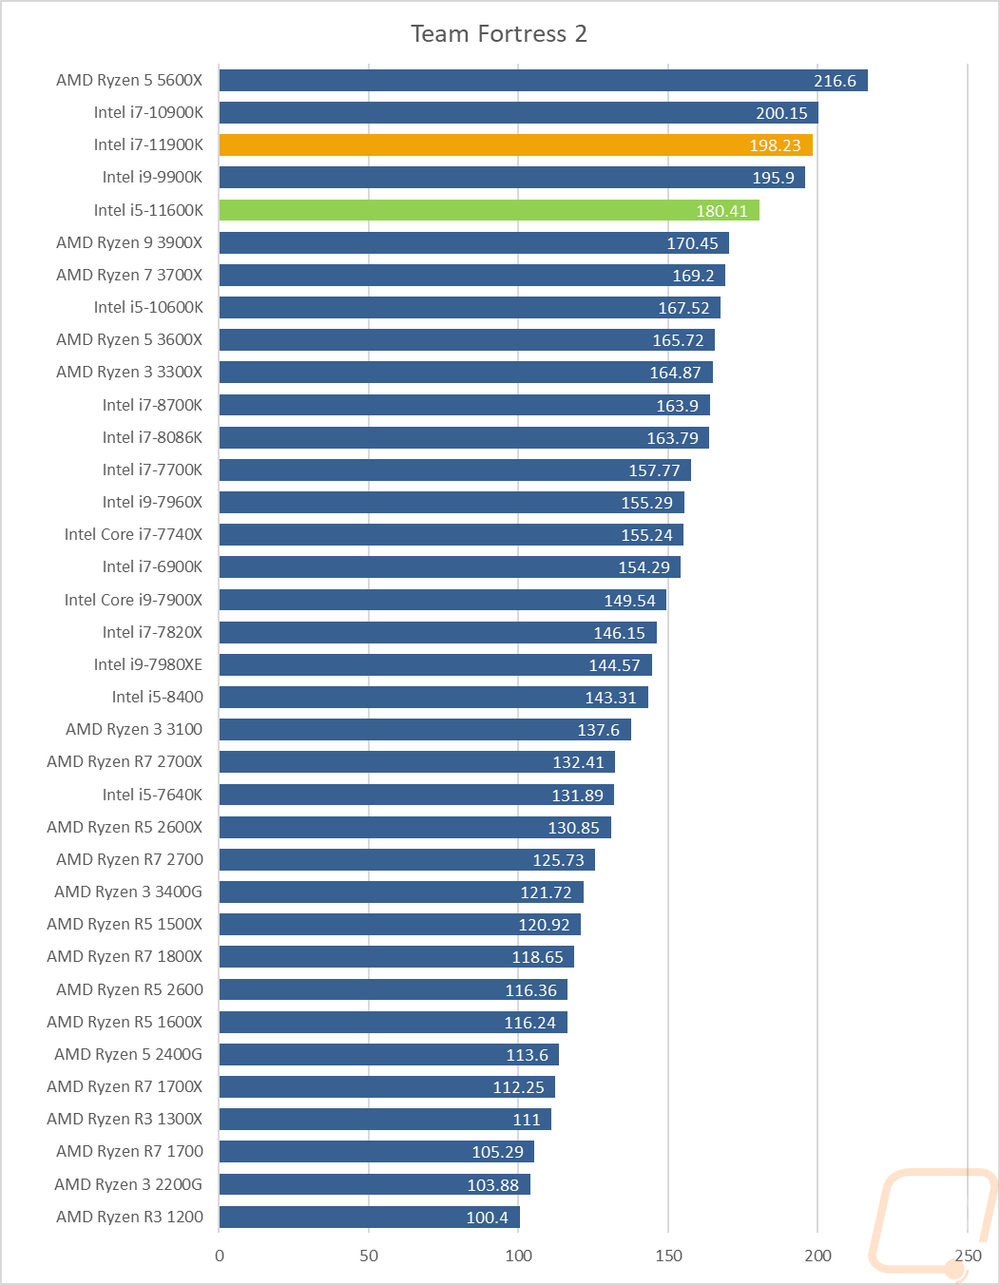
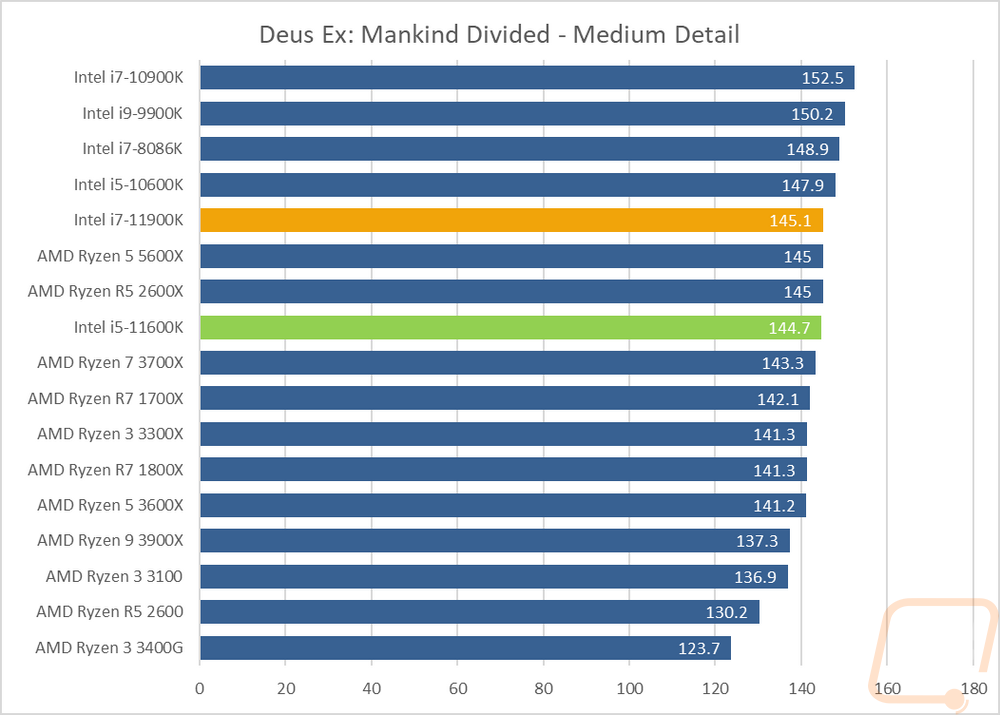
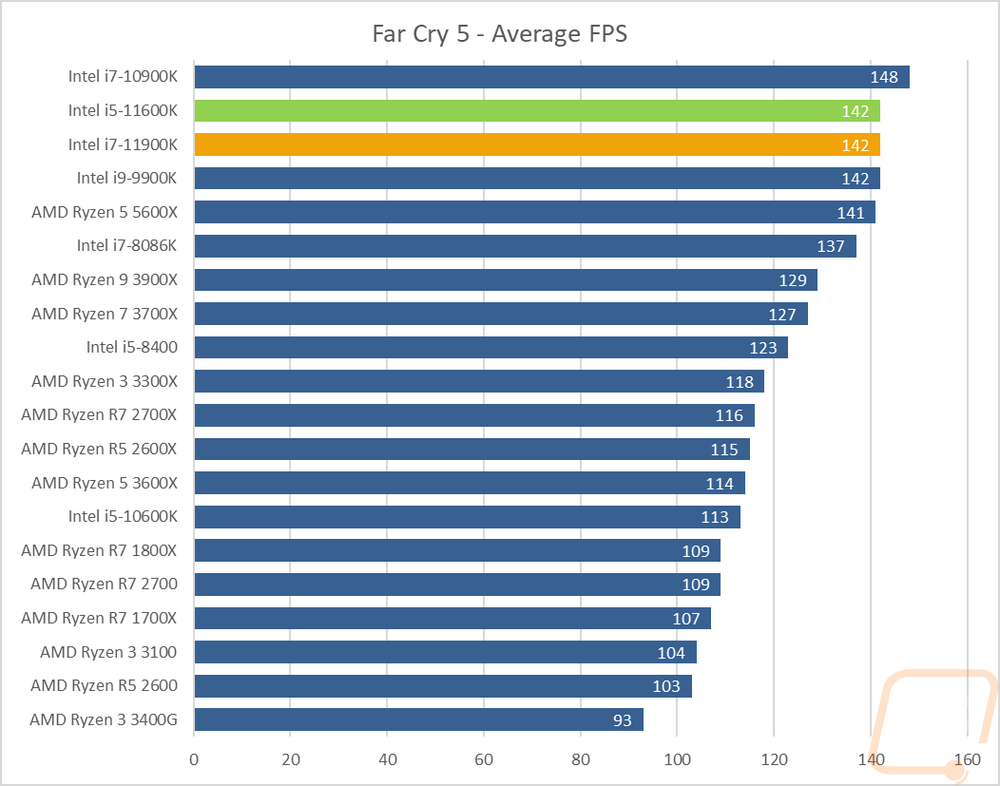
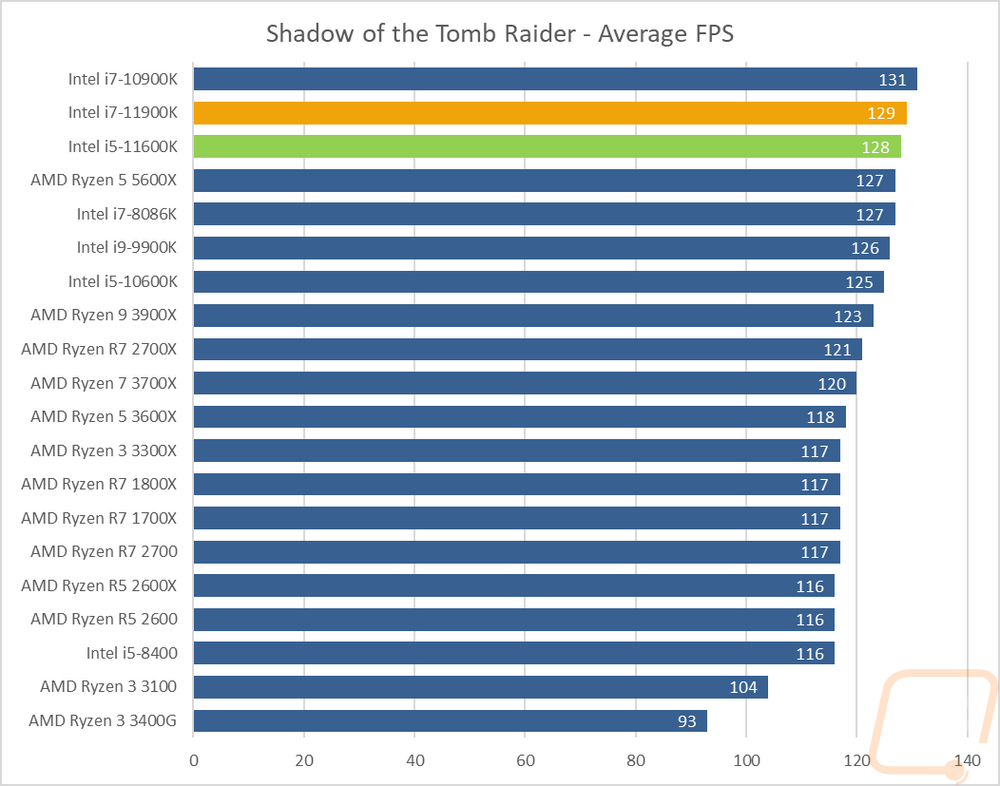
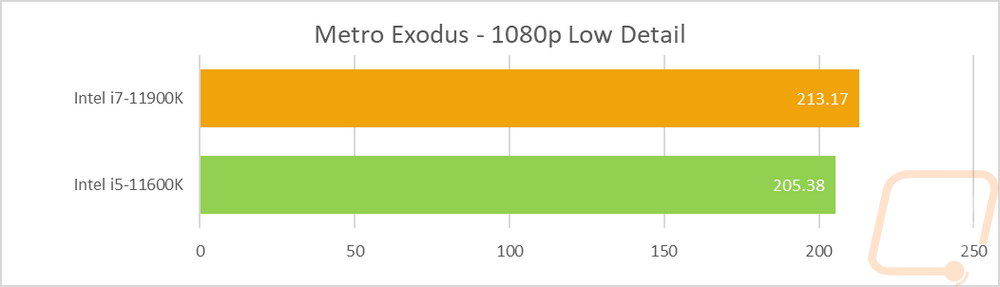
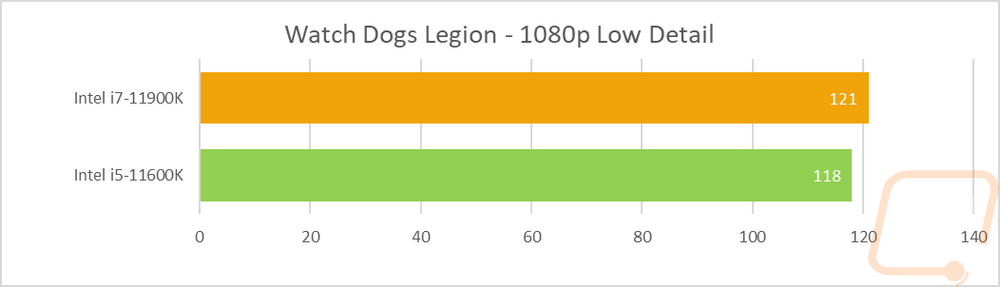
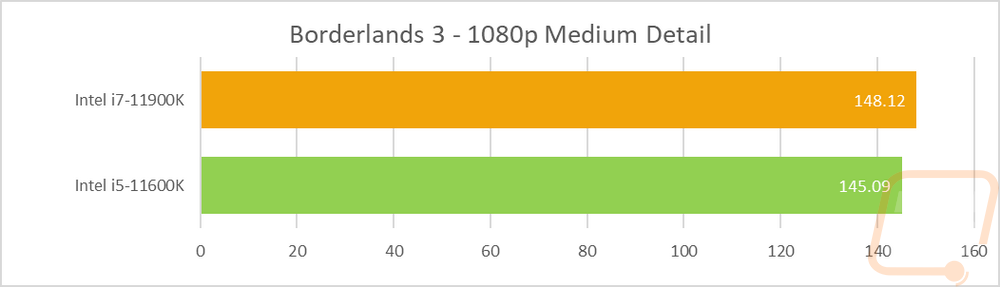
For in-game performance testing on the i9-119000K and the i5-11600K, I ran them through a variety of new and old games. TF2 for example is a very old game at this point that is very CPU-dependent. Ryzen has made big improvements here with the 5600X out ahead. Then behind that the 10900K and 11900K are right with each other and the 9900K then the 11600K. The other games tested were mostly consistent in having the 10900K still out ahead which is interesting. Then behind that the 11900K and the 11600K were right together, showing that the core count or price difference isn’t all that important when it comes to gaming. Down at the end, I also added in a few newer games running at lower detail settings to mix things up as well for future comparisons and to show that even when paired with a now old GPU (1080Ti) that newer games with a solid CPU can still get you high refresh capable performance.
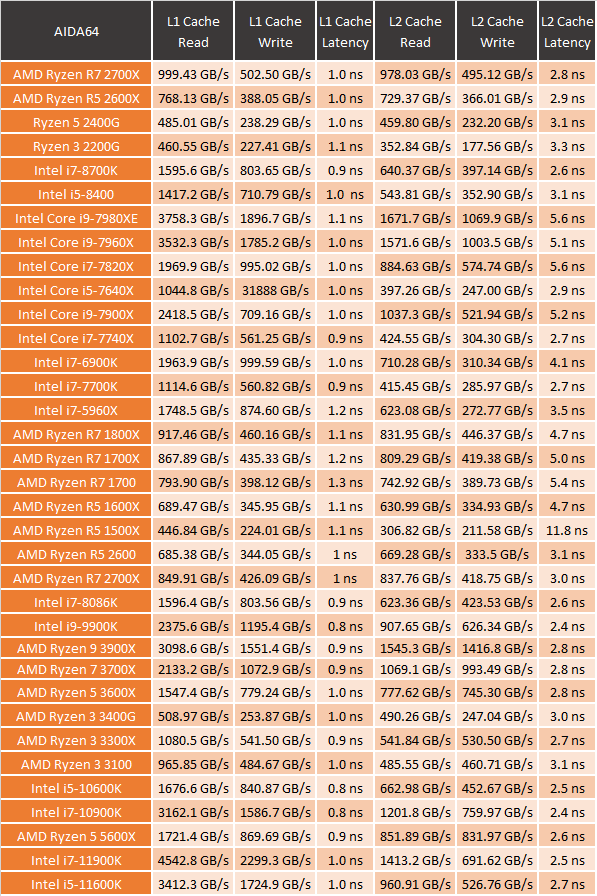
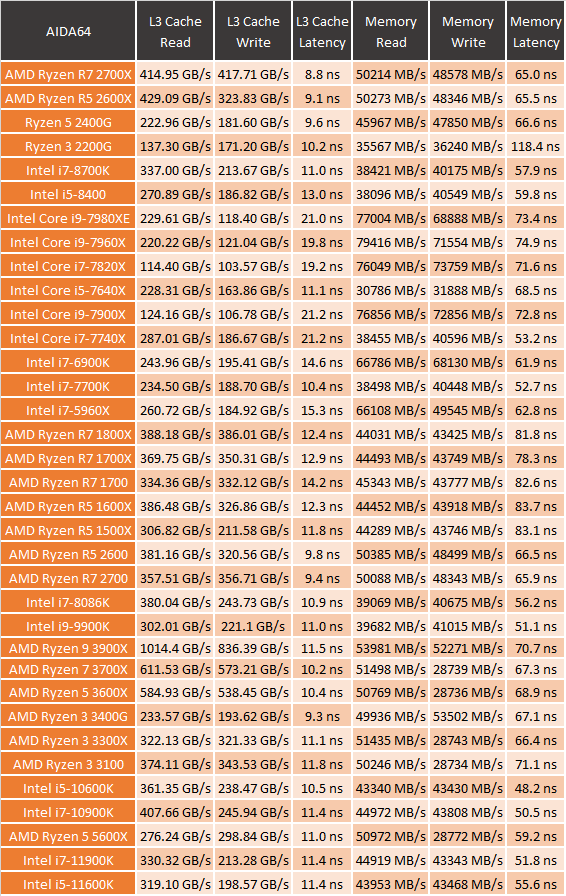
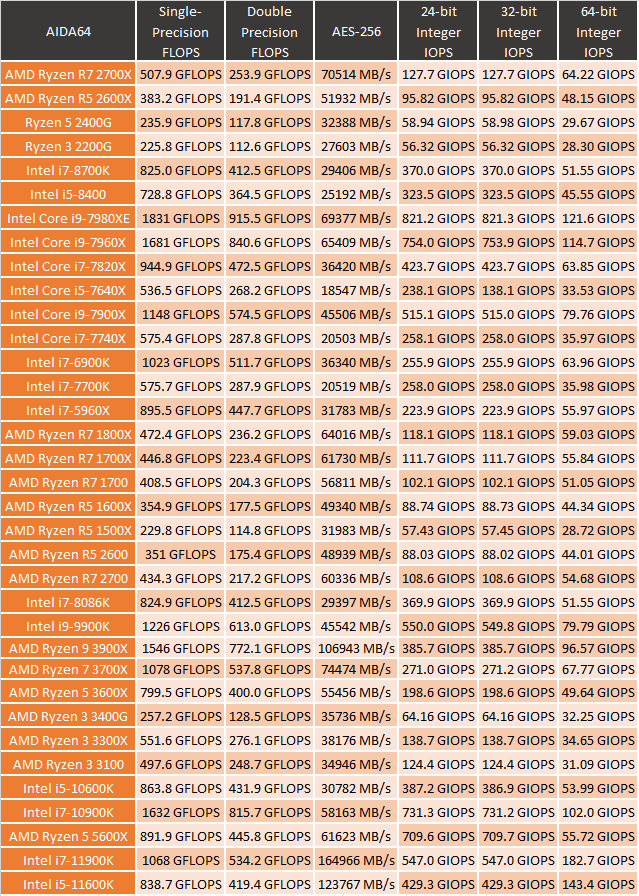
I did also run the whole series of tests in AIDA64 which let us take a look at aspects like memory speeds, latency, and cache performance. There are so many results though I am unable to graph them all and keep them readable. The 11900K does have a big jump in the L1 cache over the 10900K and smaller but still significant improvements with the L2 but L3 was slower for both the 11900K and 11600K. Memory performance was similar from the 10th gen core CPUs to the 11th gen but lower than what the latest Ryzen CPU is getting, at least on the memory reads. Single precision flops are down from the 10900K to the 11900K as well, which are partially from the lower core count. Same for the Integer IOPS as well.
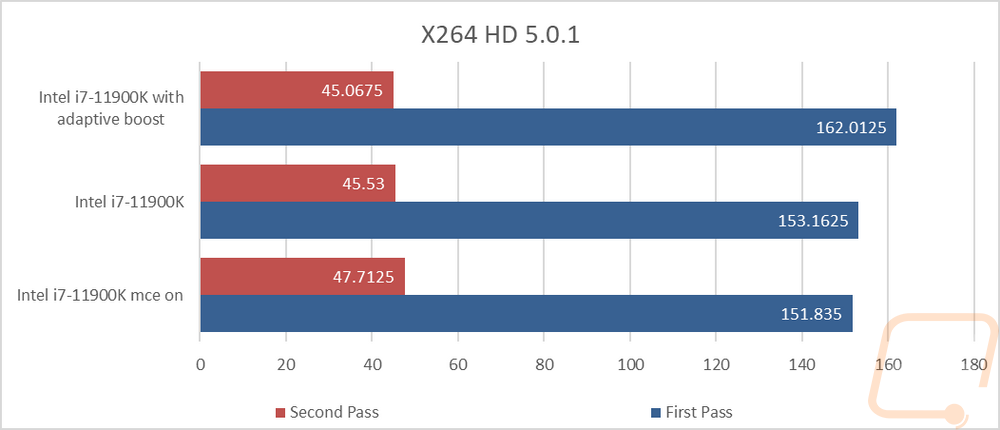
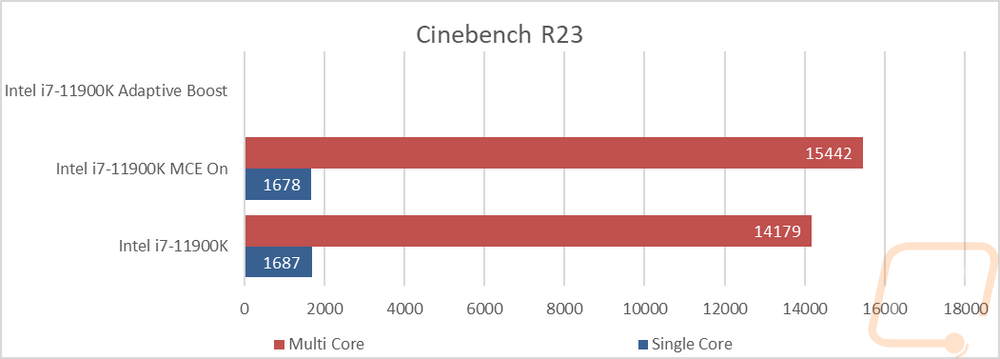
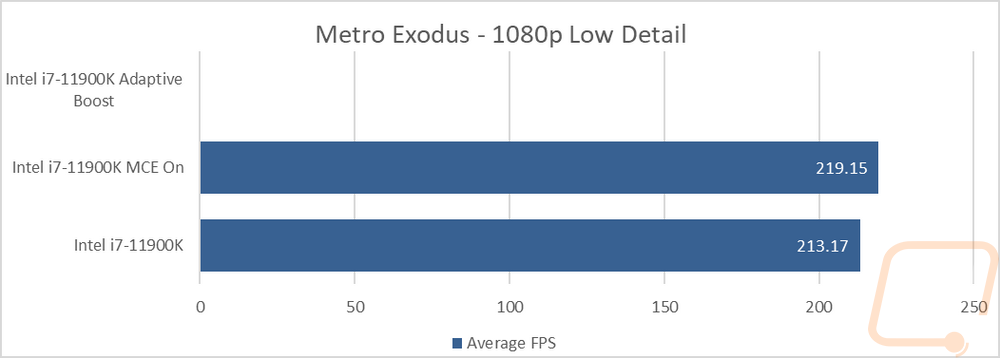
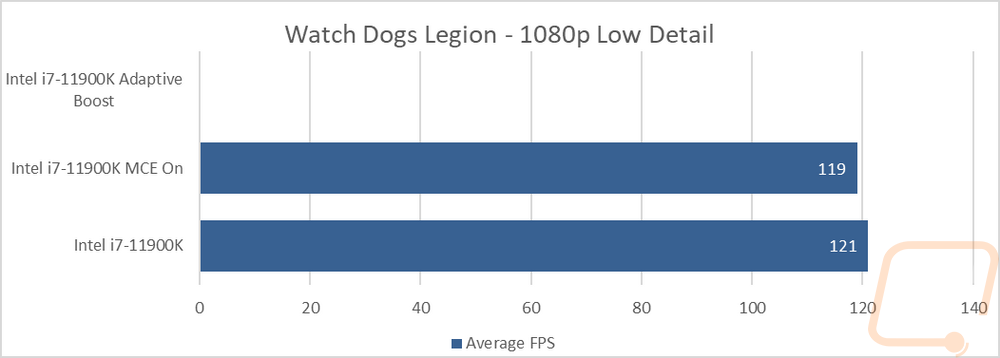
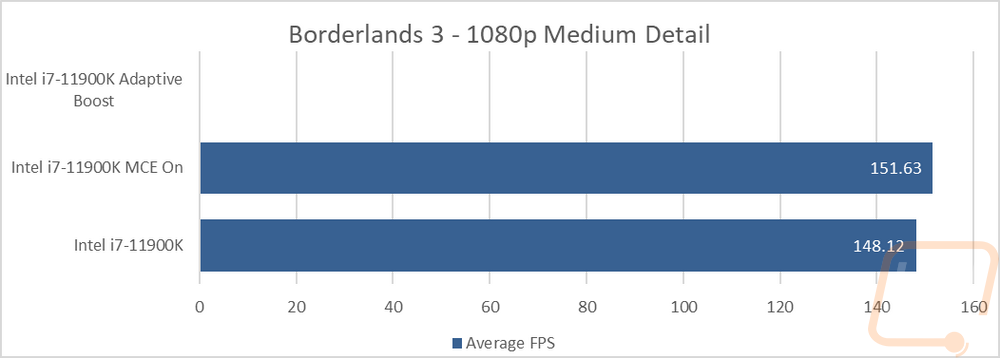
Okay just to get a better look at the performance differences that turning MCE on can show I did some additional testing beyond our normal test suite. I also mixed in Intel’s adaptive boost as well when running with MCE turned off. I did end up running into issues with adaptive boost causing clock watchdog blue screens which sometimes points to overclocking or memory issues. I tested again with other memory but still had the same errors. I suspect that having adaptive boost on with MCE turned on might help with having higher voltage settings on our CPU but ran out of time to get back and test that. So any of the results below with a blank result were because of a blue screen in testing.
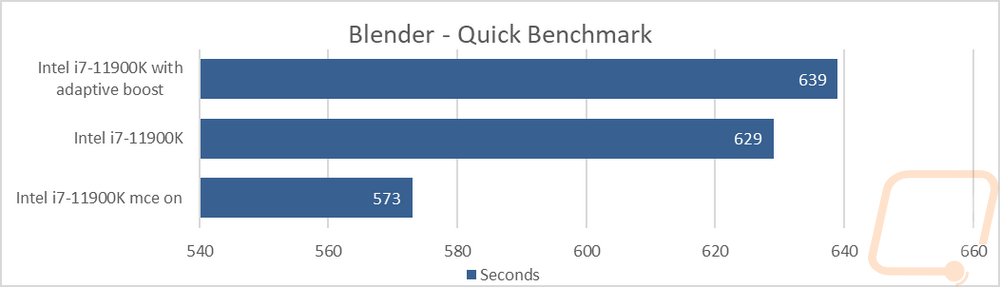
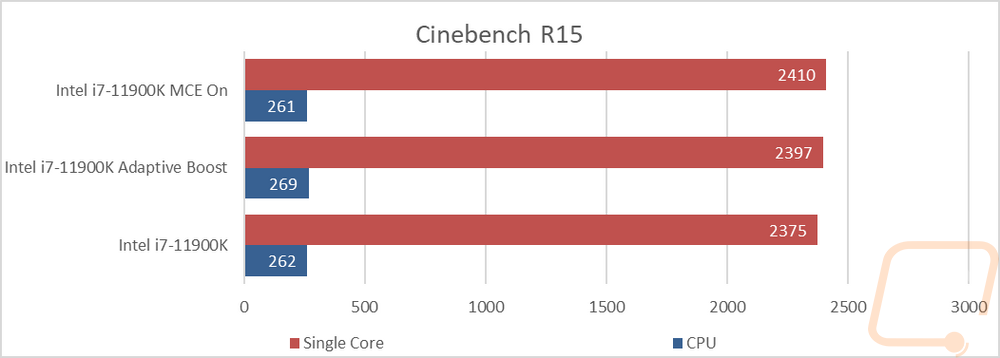
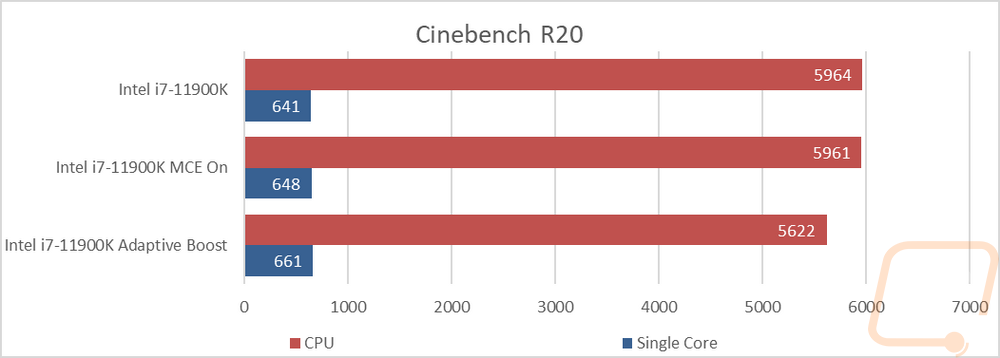
The results were all very interesting though. In the first test for example adaptive boost gave the best performance in the first pass but the lowest of the three in the second pass. MCE on that same test was the opposite. In blender, MCE made a HUGE performance difference where adaptive boost ended up hurting performance. The adaptive boost blue screens were interesting with Cinebench because the issue wasn’t a problem at all in R15 or R20 but was an instant issue when testing in R23.