CPU Performance
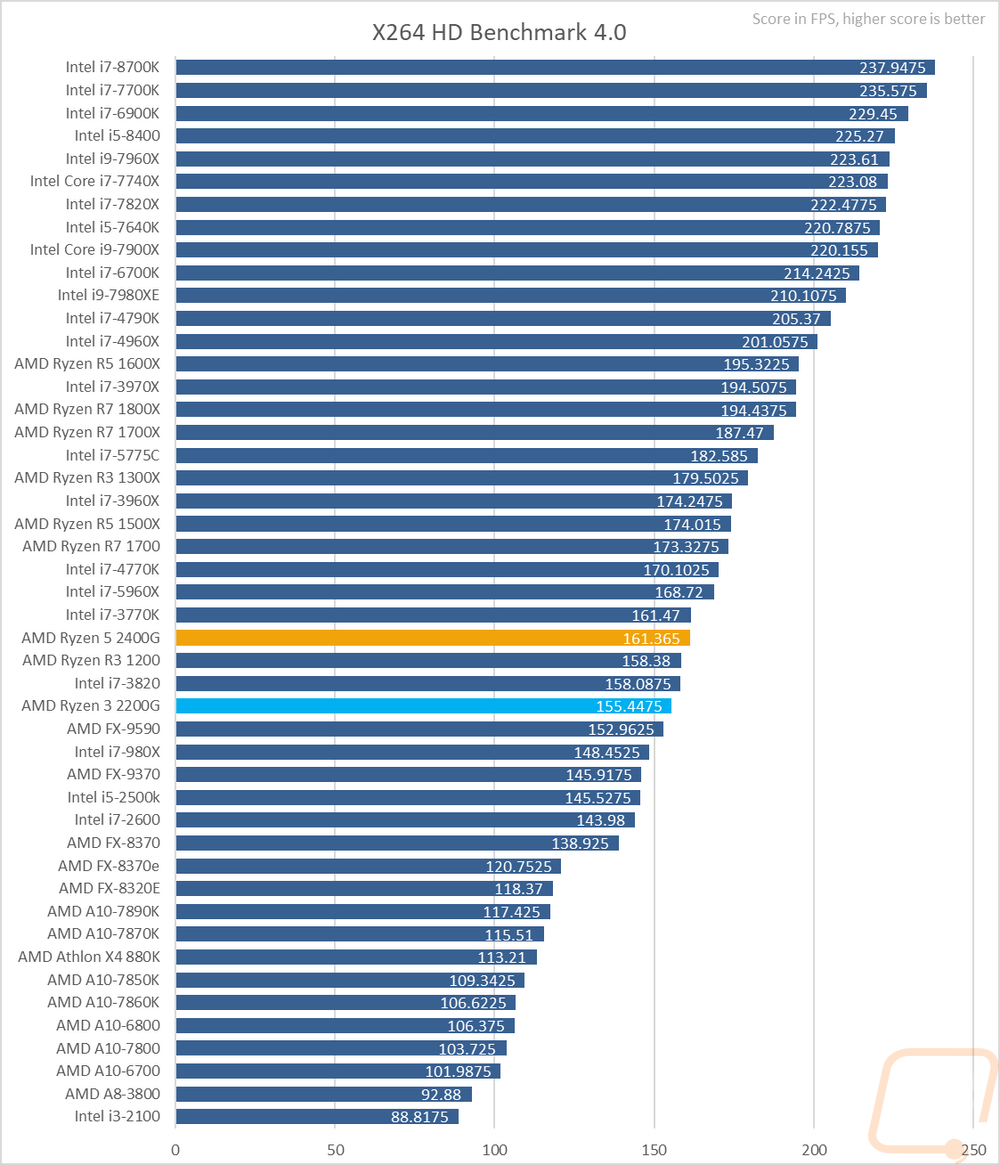
So to start off my testing I jumped in with X264 HD Benchmark 4.0. This one is a little dated but is a great way to check out video encoding performance. The test runs through four times encoding a video and then I take all four FPS averages from the entire encode and average them together. So with the 2400G and 2200G, these are Ryzen 5 and 3 CPUs so I didn’t come in expecting the world from them but being four core 8 threads both of them did well here for what they are. The 2400G came in just below the 3770K and 4770K, both were amazing at the time and aren’t that old really.
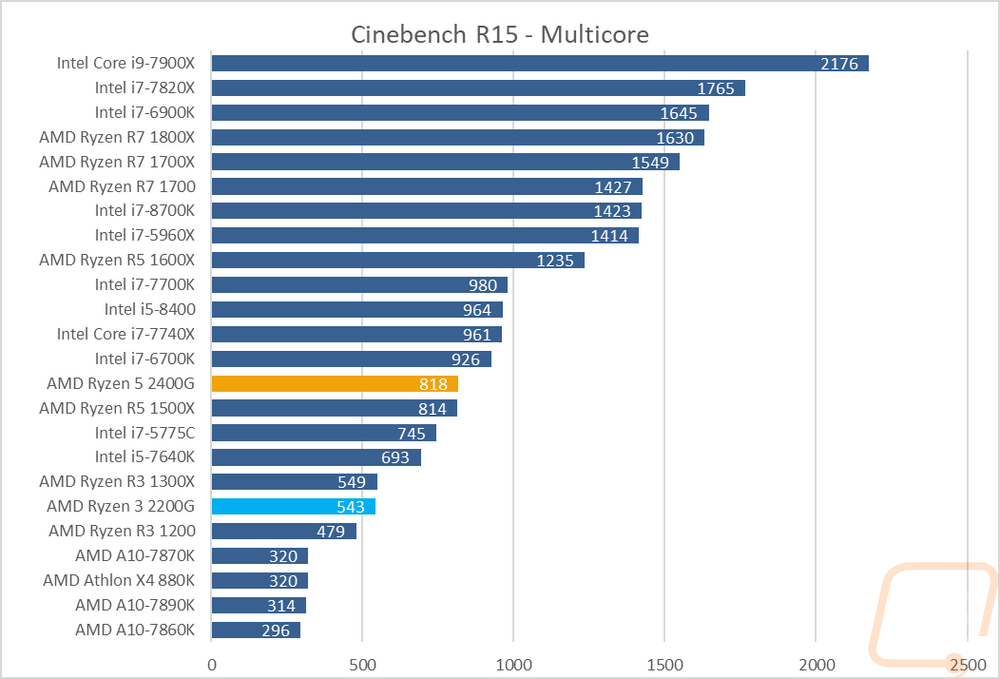
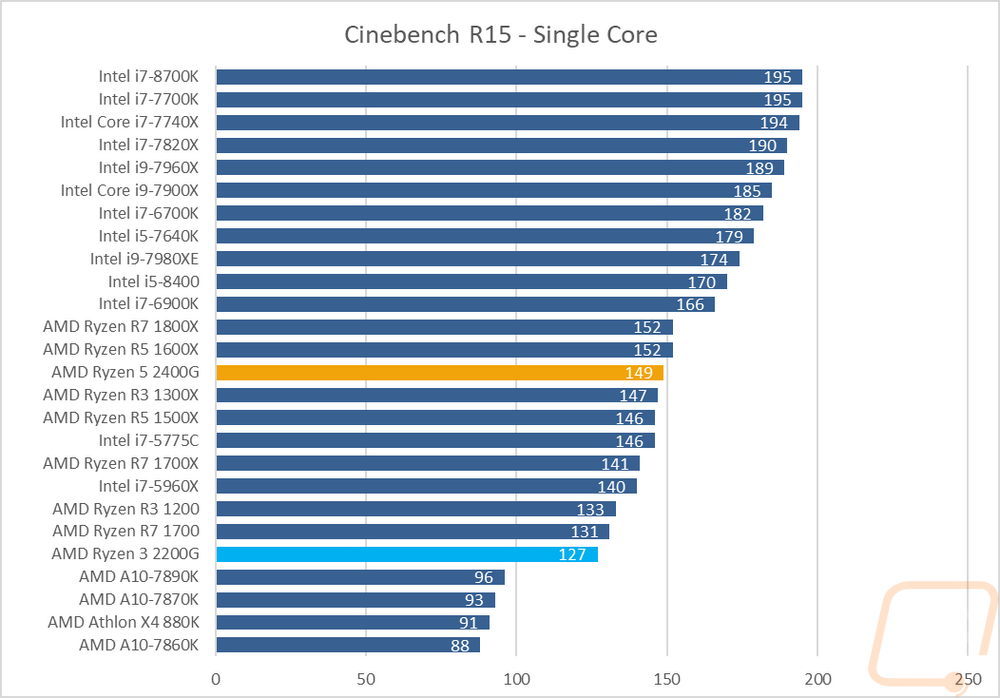
Next, I jumped into my two favorite benchmarks, both in Cinebench R15. I like these because we can check out single core and overall performance together. Single core is important because it gives us a better look at the architecture and clock speeds as well as shows how performance will be affected with older or less optimized software. So in the multicore test, the 2400G did surprisingly well, up with the 1500X and the 6700K was the next closest CPU. The 2200G was down almost completely on par with the 1300X, decent but closer to the bottom of the charts. For single core performance, the results were similar. The 200G was down closer to the bottom and the 1400G was near the middle of the pack with single core performance in between the 1300X and the 1600X.
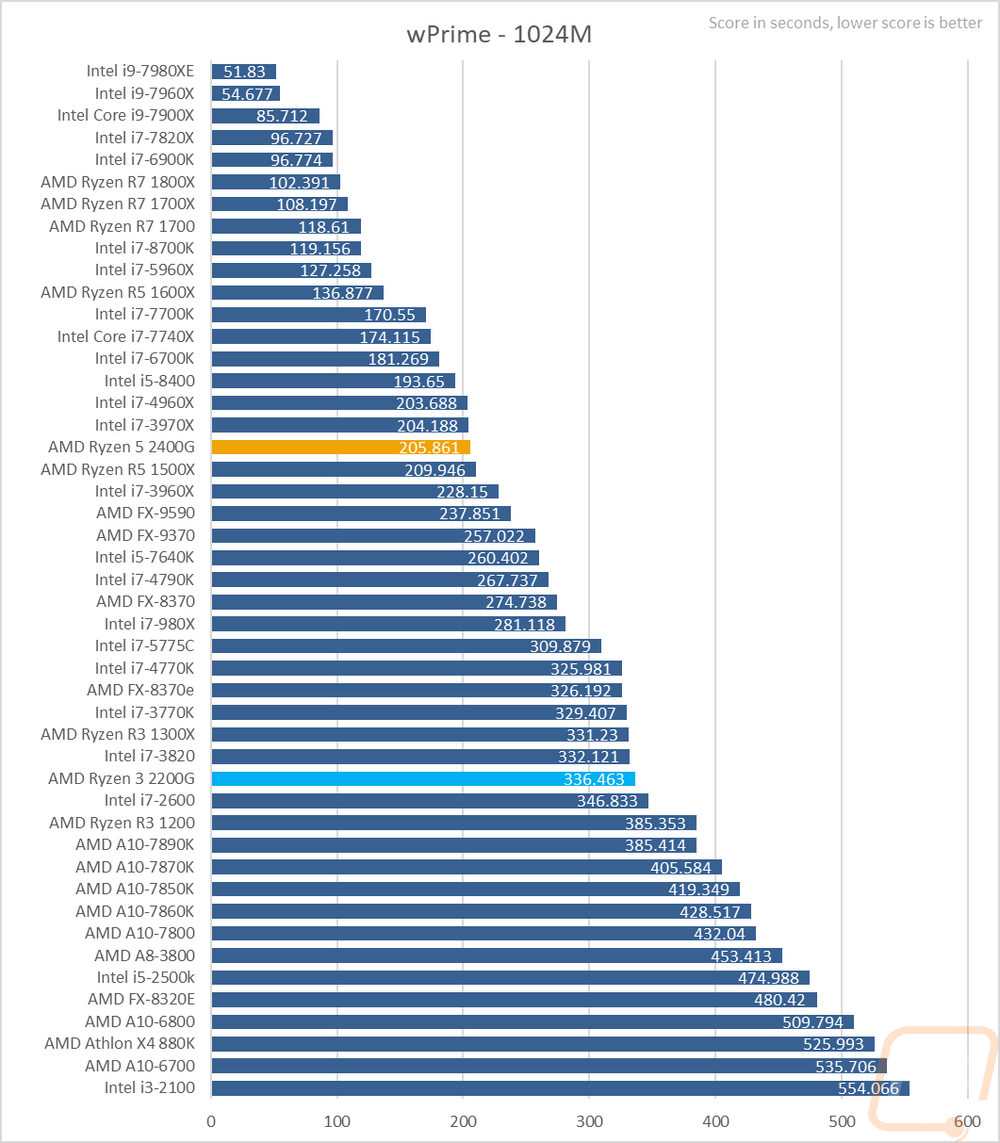
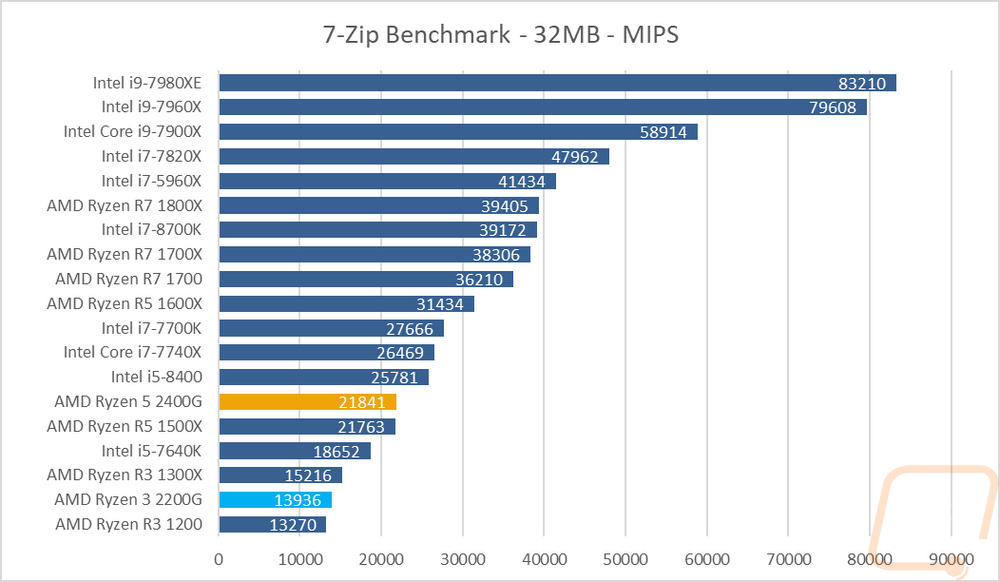
Next, I took a look at two math-focused tests in wPrime and 7Zip. wPrime shows how long it took to compute prime to 1024 million digits and 7-zip just shows performance when compressing files. Again here in wPrime the 2200G didn’t do as well and was close with the older i7-2600 and with the 1300X where the 2400G was with the 1500X and with some of Intel’s older high core count CPUs. 7-Zip, on the other hand, the two CPUs were a lot closer together mostly because it likes higher core count CPUs more.
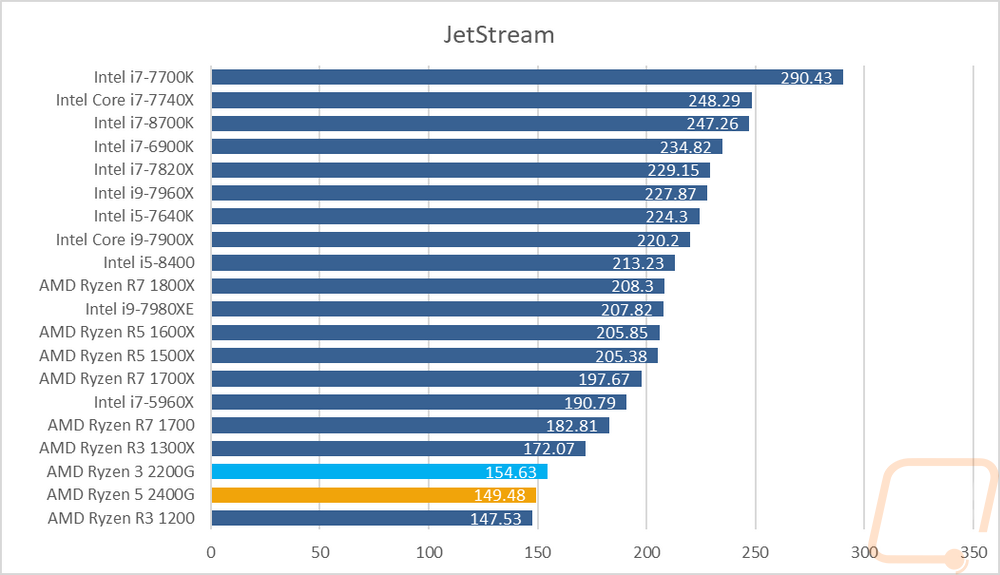
I like to check out what you can expect from browser-based stuff using the browser-based JetStream benchmark. It uses a whole list of benchmarks, runs them three times, then gives you an average score. Ironically even with the multiple tests, this test is always a little weird on the results for me. The 2200G did a little better here but they were both close together and right in line with the 1300X. This was lower down the charts but without the older CPUs included in the previous tests, they look lower than they would be.
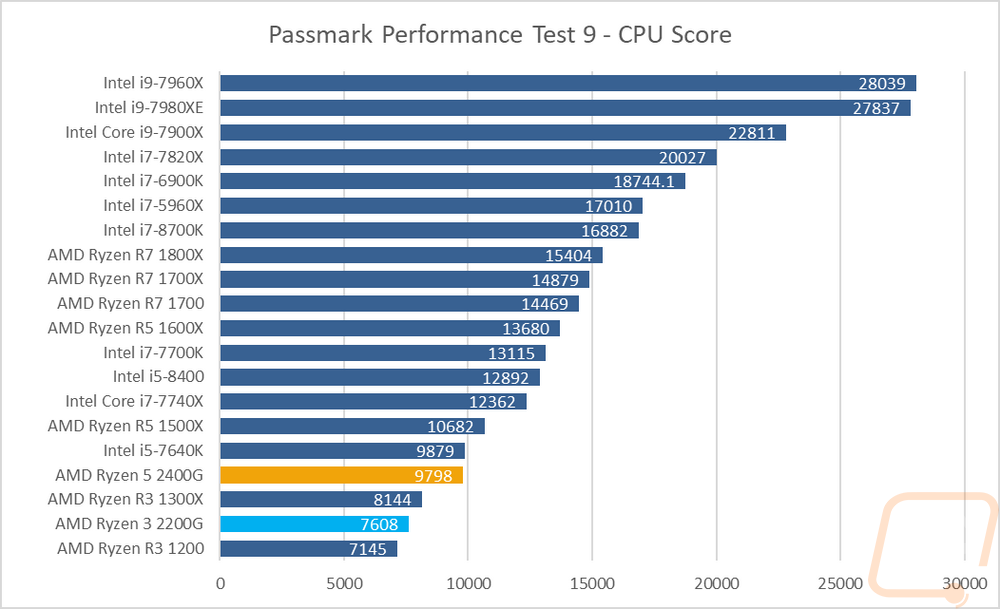
With Passmark Performance Test 9 I just use the CPU score that does a list of CPU compute tasks. I prefer this over including results that focus on the SSD and GPU. Anyhow here the 2400G was just below the i5-7640K and the 2200G was right between the 1300X and 1200, I think this shows the lower L3 cache the most that it is missing over the 1300X.
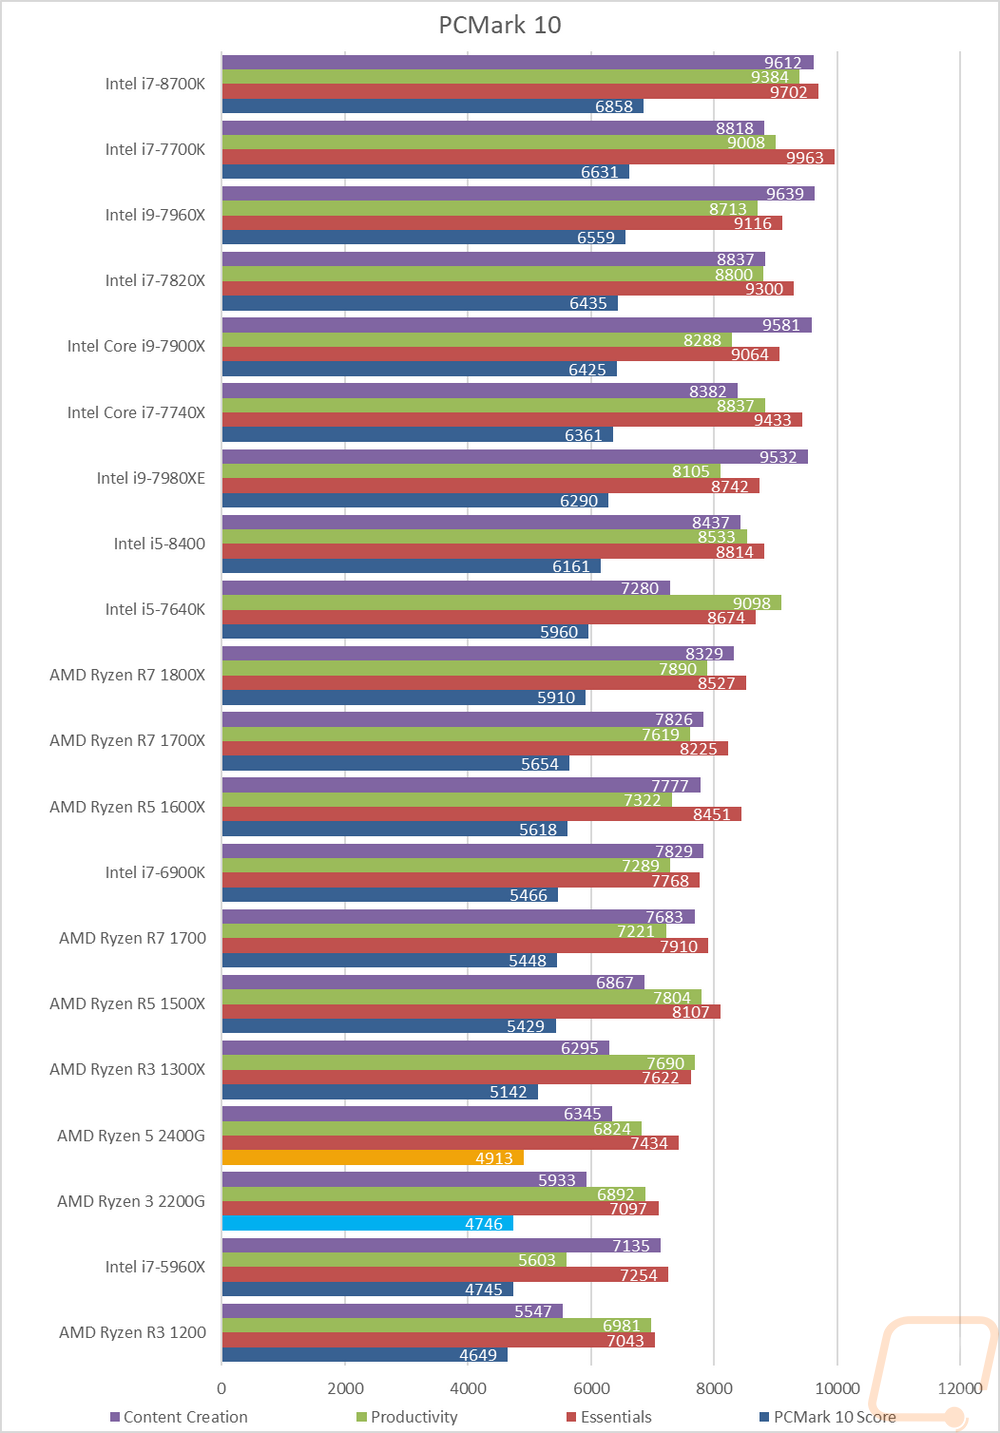
With PCMark 10, I like to run this test because they have integrated a lot of the regular everyday programs like web browsing, video chatting, writing, spreadsheets, photo editing, consuming media, and gaming. Basically everything I use my own PC for. So here the 2400G and the 2200G are both near each other. But the gap is a little farther apart in the essentials and content creation tests. Overall though they are both about comparable to the 1300X.
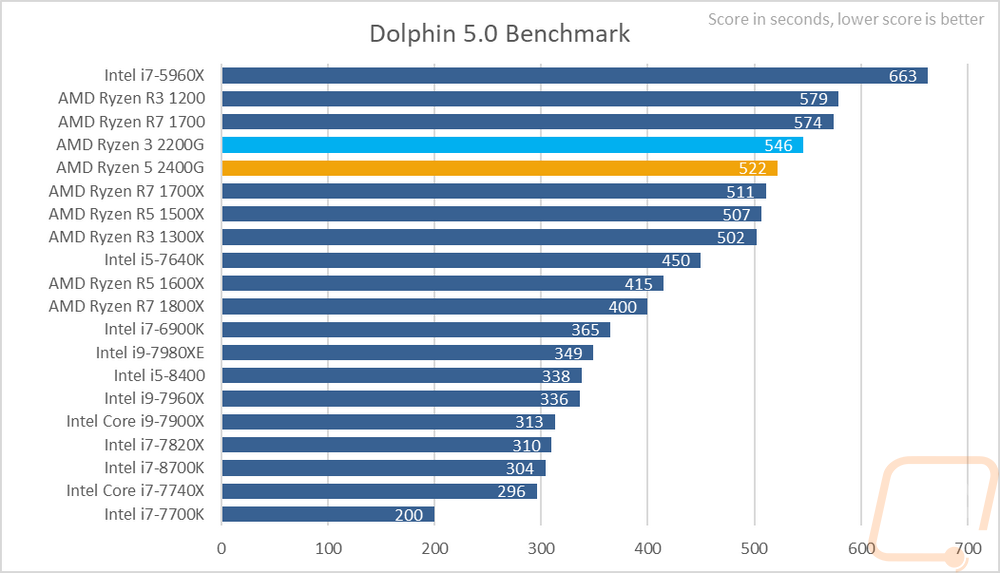
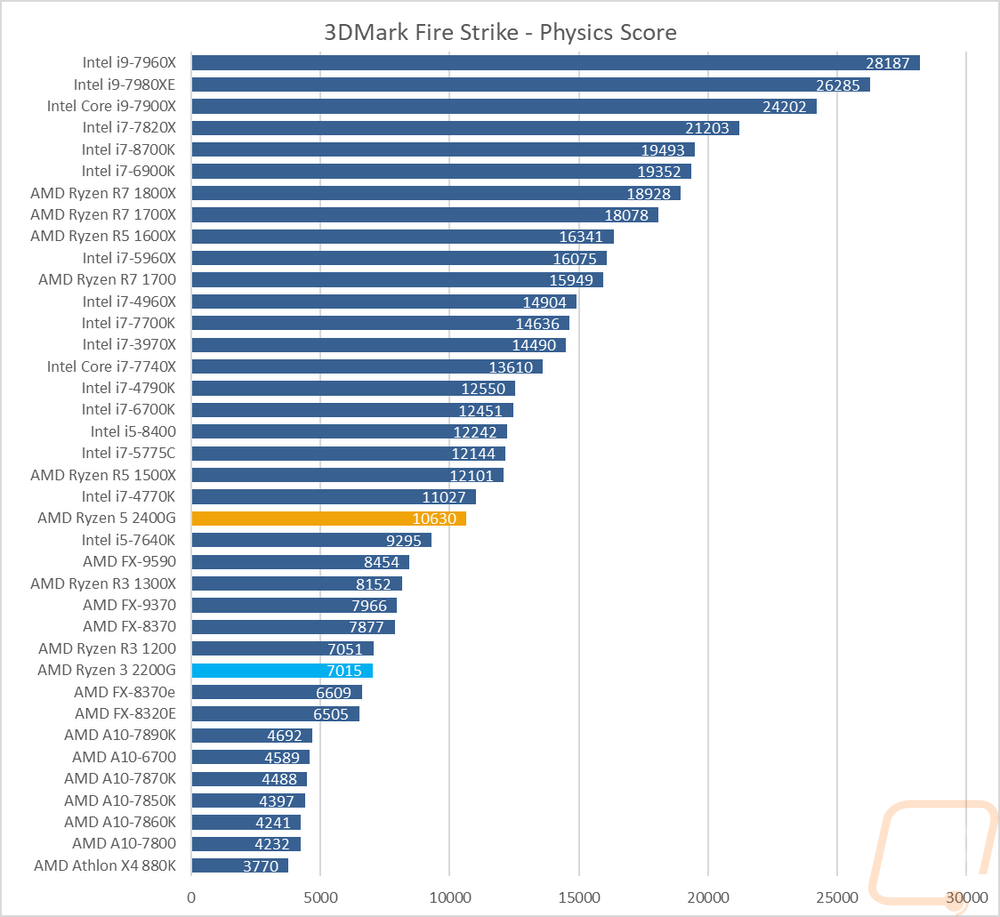
Before getting into in-game benchmarks I also like to take a quick look at 3DMark and Dolphin 5.0. 3DMark most people will know is a synthetic gaming benchmark, I focus on the physics score as it shows the CPU performances while mostly ignoring the graphics card. So here the 2400G and 2200G are much farther apart. The 2200G is down on par with the R3 1200 where the 2400G is up with the i7-4770K and well above the 1300X. Dolphin, on the other hand, is actually a Wii emulator that is known for being very CPU intensive. Here higher numbers are worse and the 200G and 2400G are both up closer to the top and together.
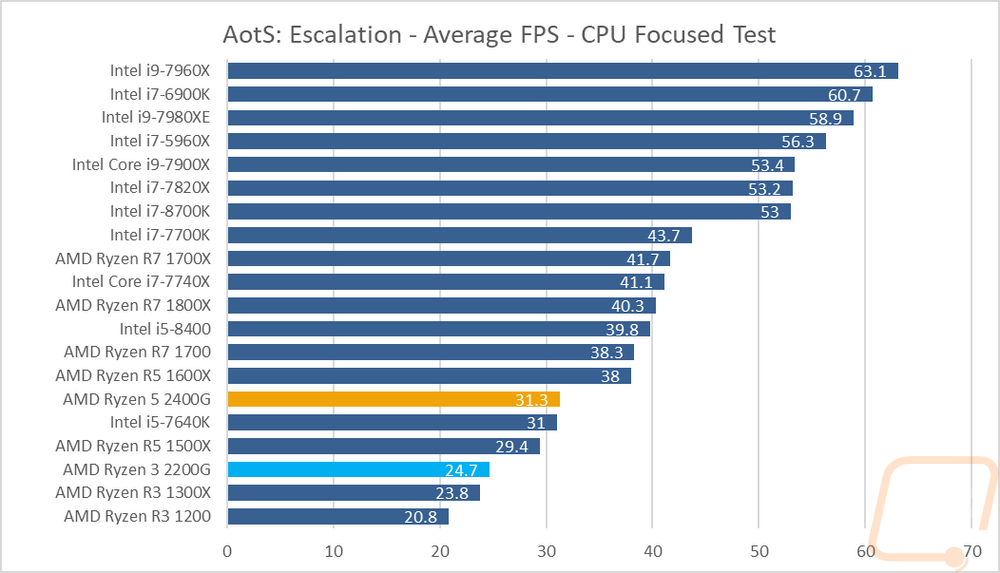
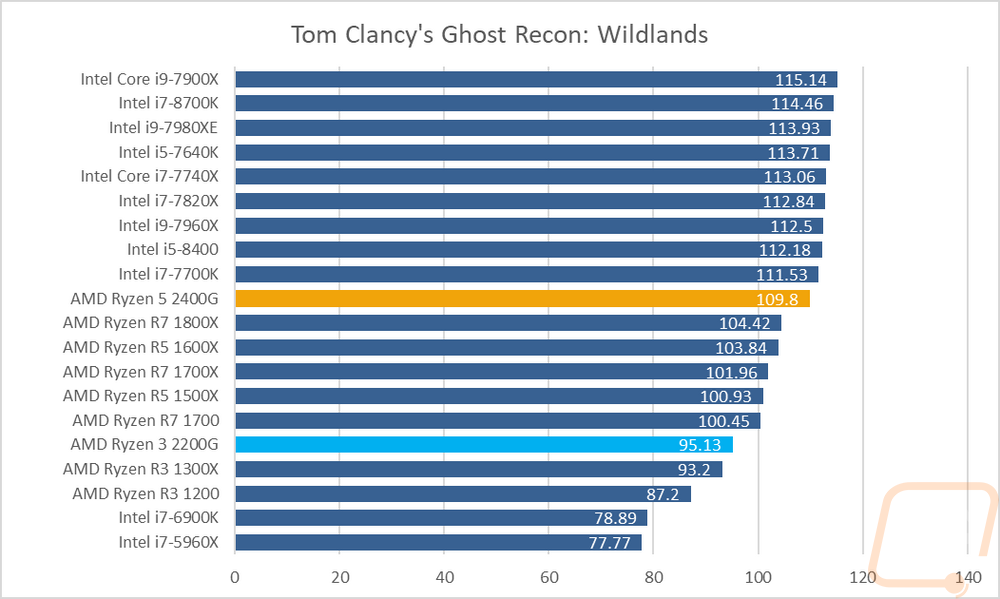
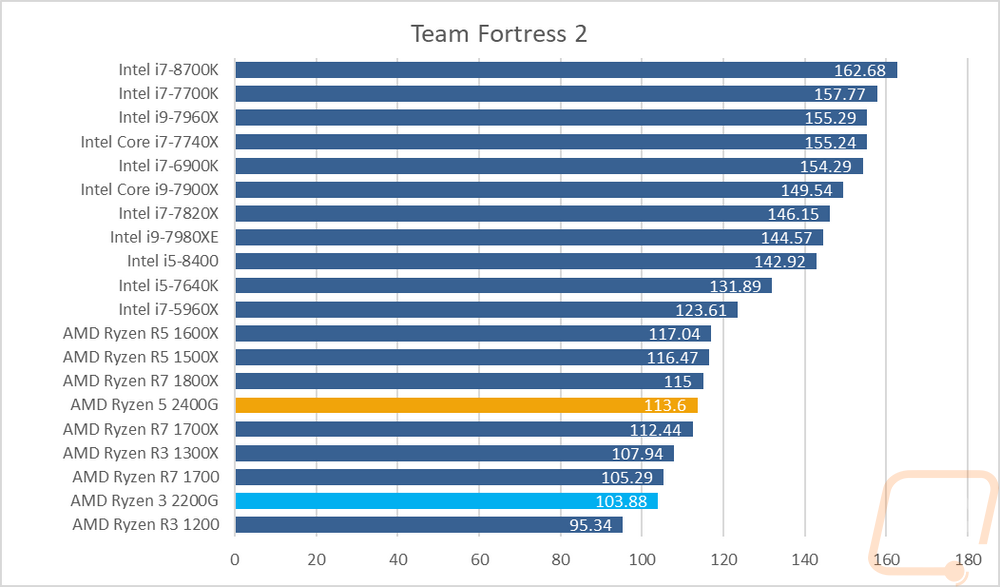
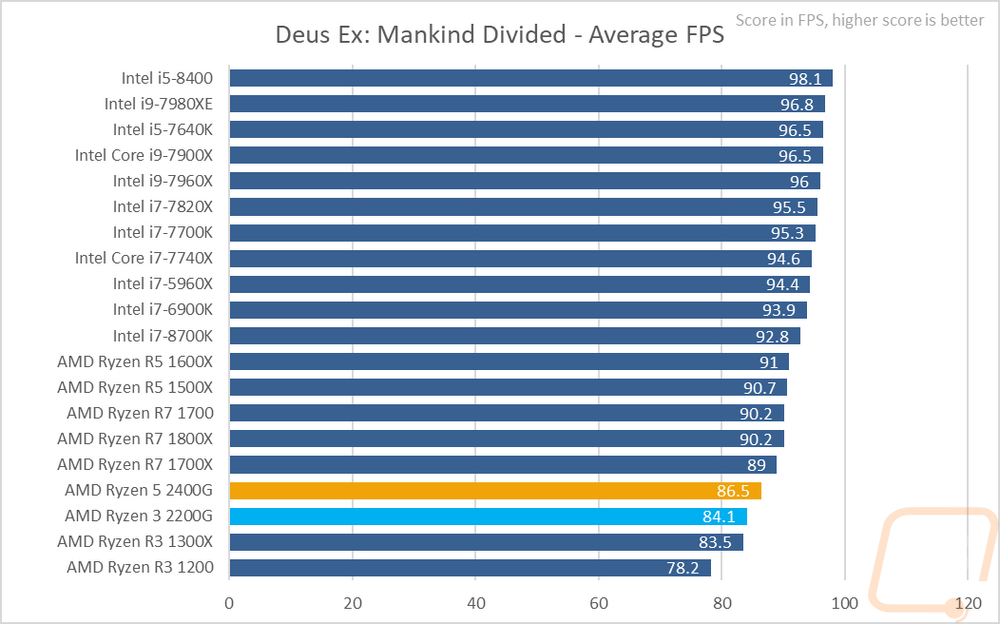
The last few CPU specific tests were all actual in-game performance tests. These are done with the GTX 1080 Ti to prevent a GPU bottleneck. Jump to the next section if you are looking to see how well the onboard GPU performed in game. In the first test, Ashes of the Singularity: Escalation I used the CPU focused test so the gaps between the results are a lot wider than in the GPU focused test. Here the 200G was on par with the 1300X and the 2400G had almost 7 more FPS to be just above the i5-7640K. In ghost recon I found it interesting that the 2400G came in actually at the top for the Ryzen CPUs, I suspect there was some optimization between this test and our original tests but the 14 FPS gap between the 2400G and 2200G is important to note here. Then in TF2, an older CPU limited game, the 2400G was in line with the higher clock speed Ryzen CPUs and the slightly lower clock speeds of the 2200G made a 10 FPS difference. Lastly in Deus Ex: Mankind Divided the 2400G and 200G were a little over 2 FPS apart but near the middle of the Ryzen CPUs, sadly though Intel still dominates in this test.
For my last bit of CPU testing, I ran through a few tests in AIDA64 just to get a look at memory and cache performance. Memory performance with the Flare-X kit was good, not up into the same level as Intel's quad channel CPUs, but on par with the rest of Ryzen. The memory latency was a little high on the 2200G when I tested it though there isn’t any reason that should have happened. Cache performance was good and in line with what is expected and having less L3 cache may also have translated into a little lower latency there as well, or new micro-code updates have improved things.
|
CPU |
Memory Read |
Memory Write |
Memory Latency |
|
Ryzen 5 2400G |
45967 MB/s |
47850 MB/s |
66.6 ns |
|
Ryzen 3 2200G |
35567 MB/s |
36240 MB/s |
118.4 ns |
|
Intel i7-8700K |
38421 MB/s |
40175 MB/s |
57.9 ns |
|
Intel i5-8400 |
38096 MB/s |
40549 MB/s |
59.8 ns |
|
Intel Core i9-7980XE |
77004 MB/s |
68888 MB/s |
73.4 ns |
|
Intel Core i9-7960X |
79416 MB/s |
71554 MB/s |
74.9 ns |
|
Intel Core i7-7820X |
76049 MB/s |
73759 MB/s |
71.6 ns |
|
Intel Core i5-7640X |
30786 MB/s |
31888 MB/s |
68.5 ns |
|
Intel Core i9-7900X |
76856 MB/s |
72856 MB/s |
72.8 ns |
|
Intel Core i7-7740X |
38455 MB/s |
40596 MB/s |
53.2 ns |
|
Intel i7-6900K |
66786 MB/s |
68130 MB/s |
61.9 ns |
|
Intel i7-7700K |
38498 MB/s |
40448 MB/s |
52.7 ns |
|
Intel i7-5960X |
66108 MB/s |
49545 MB/s |
62.8 ns |
|
AMD Ryzen R7 1800X |
44031 MB/s |
43425 MB/s |
81.8 ns |
|
AMD Ryzen R7 1700X |
44493 MB/s |
43749 MB/s |
78.3 ns |
|
AMD Ryzen R7 1700 |
45343 MB/s |
43777 MB/s |
82.6 ns |
|
AMD Ryzen R5 1600X |
44452 MB/s |
43918 MB/s |
83.7 ns |
|
AMD Ryzen R5 1500X |
44289 MB/s |
43746 MB/s |
83.1 ns |
|
|
L1 Cache Read |
L1 Cache Write |
L1 Cache Latency |
|
Ryzen 5 2400G |
485.01 GB/s |
238.29 GB/s |
1.0 ns |
|
Ryzen 3 2200G |
460.55 GB/s |
227.41 GB/s |
1.1 ns |
|
Intel i7-8700K |
1595.6 GB/s |
803.65 GB/s |
0.9 ns |
|
Intel i5-8400 |
1417.2 GB/s |
710.79 GB/s |
1.0 ns |
|
Intel Core i9-7980XE |
3758.3 GB/s |
1896.7 GB/s |
1.1 ns |
|
Intel Core i9-7960X |
3532.3 GB/s |
1785.2 GB/s |
1.0 ns |
|
Intel Core i7-7820X |
1969.9 GB/s |
995.02 GB/s |
1.0 ns |
|
Intel Core i5-7640X |
1044.8 GB/s |
31888 GB/s |
1.0 ns |
|
Intel Core i9-7900X |
2418.5 GB/s |
709.16 GB/s |
1.0 ns |
|
Intel Core i7-7740X |
1102.7 GB/s |
561.25 GB/s |
0.9 ns |
|
Intel i7-6900K |
1963.9 GB/s |
999.59 GB/s |
1.0 ns |
|
Intel i7-7700K |
1114.6 GB/s |
560.82 GB/s |
0.9 ns |
|
Intel i7-5960X |
1748.5 GB/s |
874.60 GB/s |
1.2 ns |
|
AMD Ryzen R7 1800X |
917.46 GB/s |
460.16 GB/s |
1.1 ns |
|
AMD Ryzen R7 1700X |
867.89 GB/s |
435.33 GB/s |
1.2 ns |
|
AMD Ryzen R7 1700 |
793.90 GB/s |
398.12 GB/s |
1.3 ns |
|
AMD Ryzen R5 1600X |
689.47 GB/s |
345.95 GB/s |
1.1 ns |
|
AMD Ryzen R5 1500X |
446.84 GB/s |
224.01 GB/s |
1.1 ns |
|
|
L2 Cache Read |
L2 Cache Write |
L2 Cache Latency |
|
Ryzen 5 2400G |
459.80 GB/s |
232.20 GB/s |
3.1 ns |
|
Ryzen 3 2200G |
352.84 GB/s |
177.56 GB/s |
3.3 ns |
|
Intel i7-8700K |
640.37 GB/s |
397.14 GB/s |
2.6 ns |
|
Intel i5-8400 |
543.81 GB/s |
352.90 GB/s |
3.1 ns |
|
Intel Core i9-7980XE |
1671.7 GB/s |
1069.9 GB/s |
5.6 ns |
|
Intel Core i9-7960X |
1571.6 GB/s |
1003.5 GB/s |
5.1 ns |
|
Intel Core i7-7820X |
884.63 GB/s |
574.74 GB/s |
5.6 ns |
|
Intel Core i5-7640X |
397.26 GB/s |
247.00 GB/s |
2.9 ns |
|
Intel Core i9-7900X |
1037.3 GB/s |
521.94 GB/s |
5.2 ns |
|
Intel Core i7-7740X |
424.55 GB/s |
304.30 GB/s |
2.7 ns |
|
Intel i7-6900K |
710.28 GB/s |
310.34 GB/s |
4.1 ns |
|
Intel i7-7700K |
415.45 GB/s |
285.97 GB/s |
2.7 ns |
|
Intel i7-5960X |
623.08 GB/s |
272.77 GB/s |
3.5 ns |
|
AMD Ryzen R7 1800X |
831.95 GB/s |
446.37 GB/s |
4.7 ns |
|
AMD Ryzen R7 1700X |
809.29 GB/s |
419.38 GB/s |
5.0 ns |
|
AMD Ryzen R7 1700 |
742.92 GB/s |
389.73 GB/s |
5.4 ns |
|
AMD Ryzen R5 1600X |
630.99 GB/s |
334.93 GB/s |
4.7 ns |
|
AMD Ryzen R5 1500X |
306.82 GB/s |
211.58 GB/s |
11.8 ns |
|
|
L3 Cache Read |
L3 Cache Write |
L3 Cache Latency |
|
Ryzen 5 2400G |
222.96 GB/s |
181.60 GB/s |
9.6 |
|
Ryzen 3 2200G |
137.30 GB/s |
171.20 GB/s |
10.2 |
|
Intel i7-8700K |
337.00 GB/s |
213.67 GB/s |
11.0 ns |
|
Intel i5-8400 |
270.89 GB/s |
186.82 GB/s |
13.0 ns |
|
Intel Core i9-7980XE |
229.61 GB/s |
118.40 GB/s |
21.0 ns |
|
Intel Core i9-7960X |
220.22 GB/s |
121.04 GB/s |
19.8 ns |
|
Intel Core i7-7820X |
114.40 GB/s |
103.57 GB/s |
19.2 ns |
|
Intel Core i5-7640X |
228.31 GB/s |
163.86 GB/s |
11.1 ns |
|
Intel Core i9-7900X |
124.16 GB/s |
106.78 GB/s |
21.2 ns |
|
Intel Core i7-7740X |
287.01 GB/s |
186.67 GB/s |
21.2 ns |
|
Intel i7-6900K |
243.96 GB/s |
195.41 GB/s |
14.6 ns |
|
Intel i7-7700K |
234.50 GB/s |
188.70 GB/s |
10.4 ns |
|
Intel i7-5960X |
260.72 GB/s |
184.92 GB/s |
15.3 ns |
|
AMD Ryzen R7 1800X |
388.18 GB/s |
386.01 GB/s |
12.4 ns |
|
AMD Ryzen R7 1700X |
369.75 GB/s |
350.31 GB/s |
12.9 ns |
|
AMD Ryzen R7 1700 |
334.36 GB/s |
332.12 GB/s |
14.2 ns |
|
AMD Ryzen R5 1600X |
386.48 GB/s |
326.86 GB/s |
12.3 ns |
|
AMD Ryzen R5 1500X |
306.82 GB/s |
211.58 GB/s |
11.8 ns |
|
|
Single-Precision FLOPS |
Double Precision FLOPS |
AES-256 |
|
Ryzen 5 2400G |
235.9 GFLOPS |
117.8 GFLOPS |
32388 MB/s |
|
Ryzen 3 2200G |
225.8 GFLOPS |
112.6 GFLOPS |
27603 MB/s |
|
Intel i7-8700K |
825.0 GFLOPS |
412.5 GFLOPS |
29406 MB/s |
|
Intel i5-8400 |
728.8 GFLOPS |
364.5 GFLOPS |
25192 MB/s |
|
Intel Core i9-7980XE |
1831 GFLOPS |
915.5 GFLOPS |
69377 MB/s |
|
Intel Core i9-7960X |
1681 GFLOPS |
840.6 GFLOPS |
65409 MB/s |
|
Intel Core i7-7820X |
944.9 GFLOPS |
472.5 GFLOPS |
36420 MB/s |
|
Intel Core i5-7640X |
536.5 GFLOPS |
268.2 GFLOPS |
18547 MB/s |
|
Intel Core i9-7900X |
1148 GFLOPS |
574.5 GFLOPS |
45506 MB/s |
|
Intel Core i7-7740X |
575.4 GFLOPS |
287.8 GFLOPS |
20503 MB/s |
|
Intel i7-6900K |
1023 GFLOPS |
511.7 GFLOPS |
36340 MB/s |
|
Intel i7-7700K |
575.7 GFLOPS |
287.9 GFLOPS |
20519 MB/s |
|
Intel i7-5960X |
895.5 GFLOPS |
447.7 GFLOPS |
31783 MB/s |
|
AMD Ryzen R7 1800X |
472.4 GFLOPS |
236.2 GFLOPS |
64016 MB/s |
|
AMD Ryzen R7 1700X |
446.8 GFLOPS |
223.4 GFLOPS |
61730 MB/s |
|
AMD Ryzen R7 1700 |
408.5 GFLOPS |
204.3 GFLOPS |
56811 MB/s |
|
AMD Ryzen R5 1600X |
354.9 GFLOPS |
177.5 GFLOPS |
49340 MB/s |
|
AMD Ryzen R5 1500X |
229.8 GFLOPS |
114.8 GFLOPS |
31983 MB/s |
|
|
24-bit Integer IOPS |
32-bit Integer IOPS |
64-bit Integer IOPS |
|
Ryzen 5 2400G |
58.94 GIOPS |
58.98 GIOPS |
29.67 GIOPS |
|
Ryzen 3 2200G |
56.32 GIOPS |
56.32 GIOPS |
28.30 GIOPS |
|
Intel i7-8700K |
370.0 GIOPS |
370.0 GIOPS |
51.55 GIOPS |
|
Intel i5-8400 |
323.5 GIOPS |
323.5 GIOPS |
45.55 GIOPS |
|
Intel Core i9-7980XE |
821.2 GIOPS |
821.3 GIOPS |
121.6 GIOPS |
|
Intel Core i9-7960X |
754.0 GIOPS |
753.9 GIOPS |
114.7 GIOPS |
|
Intel Core i7-7820X |
423.7 GIOPS |
423.7 GIOPS |
63.85 GIOPS |
|
Intel Core i5-7640X |
238.1 GIOPS |
138.1 GIOPS |
33.53 GIOPS |
|
Intel Core i9-7900X |
515.1 GIOPS |
515.0 GIOPS |
79.76 GIOPS |
|
Intel Core i7-7740X |
258.1 GIOPS |
258.0 GIOPS |
35.97 GIOPS |
|
Intel i7-6900K |
255.9 GIOPS |
255.9 GIOPS |
63.96 GIOPS |
|
Intel i7-7700K |
258.0 GIOPS |
258.0 GIOPS |
35.98 GIOPS |
|
Intel i7-5960X |
223.9 GIOPS |
223.9 GIOPS |
55.97 GIOPS |
|
AMD Ryzen R7 1800X |
118.1 GIOPS |
118.1 GIOPS |
59.03 GIOPS |
|
AMD Ryzen R7 1700X |
111.7 GIOPS |
111.7 GIOPS |
55.84 GIOPS |
|
AMD Ryzen R7 1700 |
102.1 GIOPS |
102.1 GIOPS |
51.05 GIOPS |
|
AMD Ryzen R5 1600X |
88.74 GIOPS |
88.73 GIOPS |
44.34 GIOPS |
|
AMD Ryzen R5 1500X |
57.43 GIOPS |
57.45 GIOPS |
28.72 GIOPS |
