CPU Performance
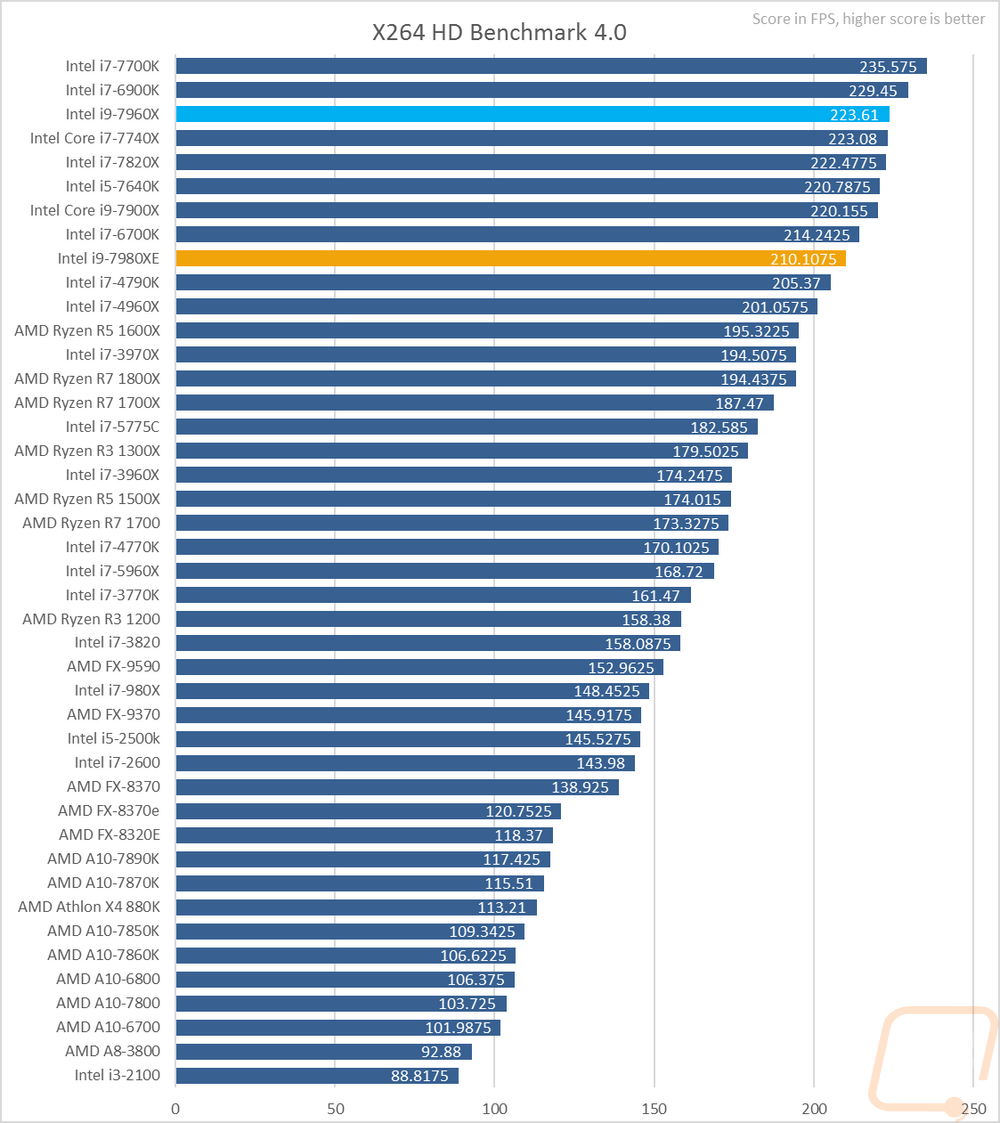
For performance testing, I tested both the 7980XE and the 7960X against all of the CPUs that I have recently tested. This includes almost the entire Ryzen range with the exception of the Threadripper CPUs and past and present Intel CPUs as well including most of the Core-X lineup all the way down to the i5. To start my testing off I tested how both CPUs performed in X264 HD Benchmark as it encoded video. The results are the frame rate in which they encode so the higher the score the better. The 7960X is in light blue and the 7890XE is in orange. As you can see this benchmark does like additional cores up to a point, but in the end clock speeds still dominate so the lower overall base clock on both CPUs hurt their scores with the 7980XE coming in lower than the 7960X even.
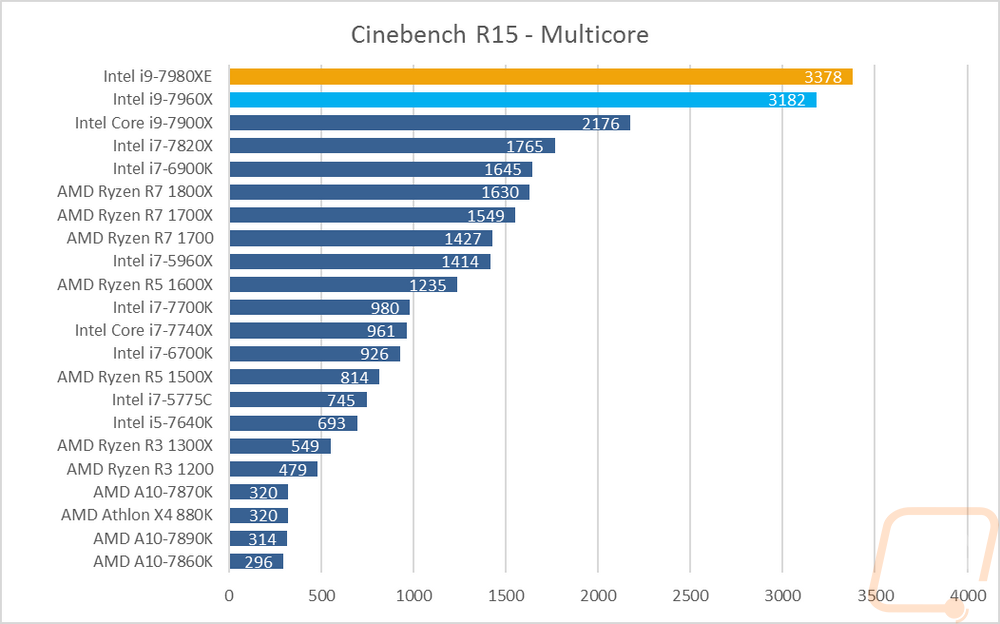
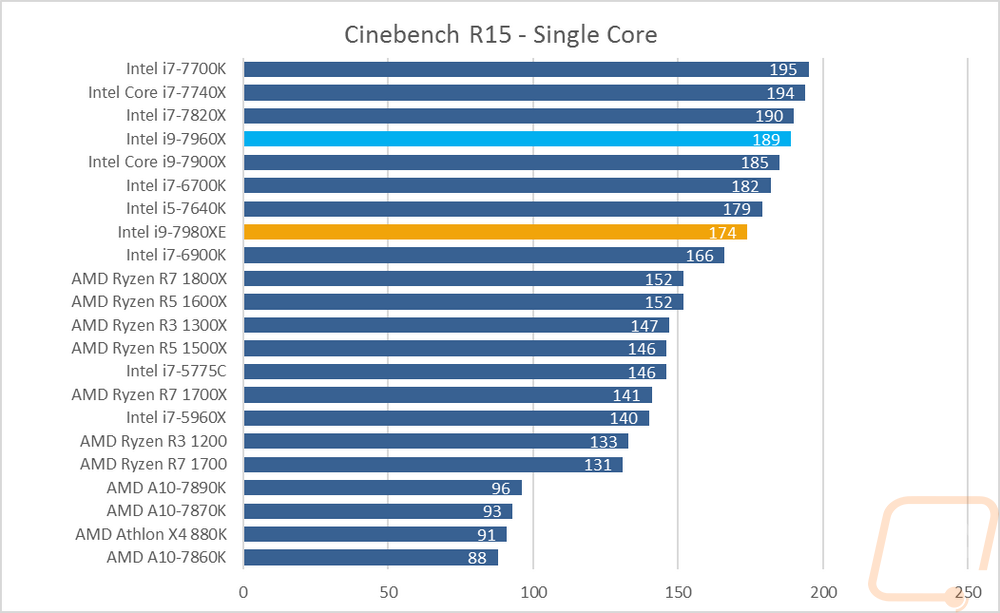
My next test was Cinebench R15, these are always my favorite benchmarks because it is the only test that tests both multi-core performance along with single core performance. In the single-core test the higher clock speed of the 7960X helped put it up higher in the charts but the now old 7700K Is still at the top of the charts here. The 7980XE was all the way down below just about every other current Intel SKU but still above all of the Ryzen CPUs. The Multi-Core performance though really blew my mind. It's not often that new scores completely skew the charts but look just how far ahead both the 7980XE and the 7960X are ahead of the rest of the CPUs tested. Given that both still had fast per core scores they really dominated when they could take advantage of their 16 and 18 cores. Even the 7900X looks slow in comparison.
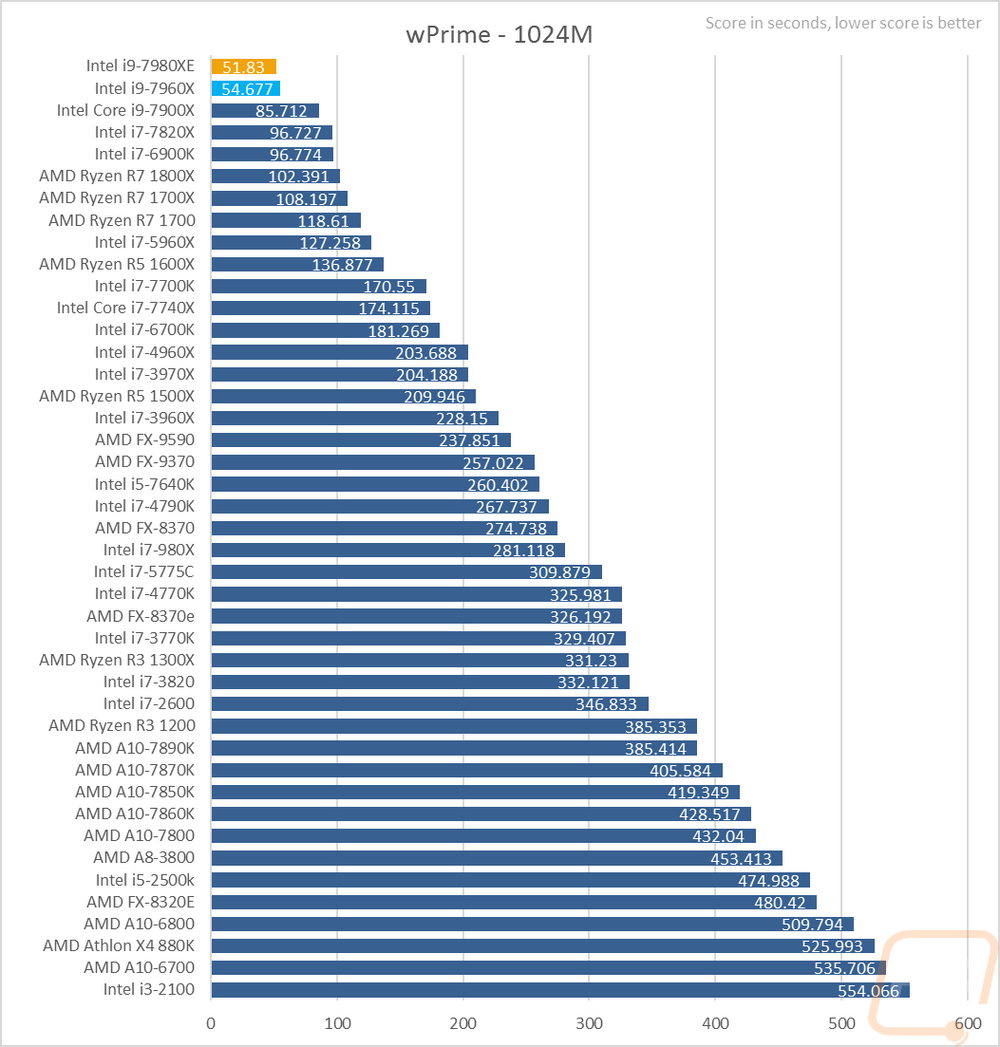
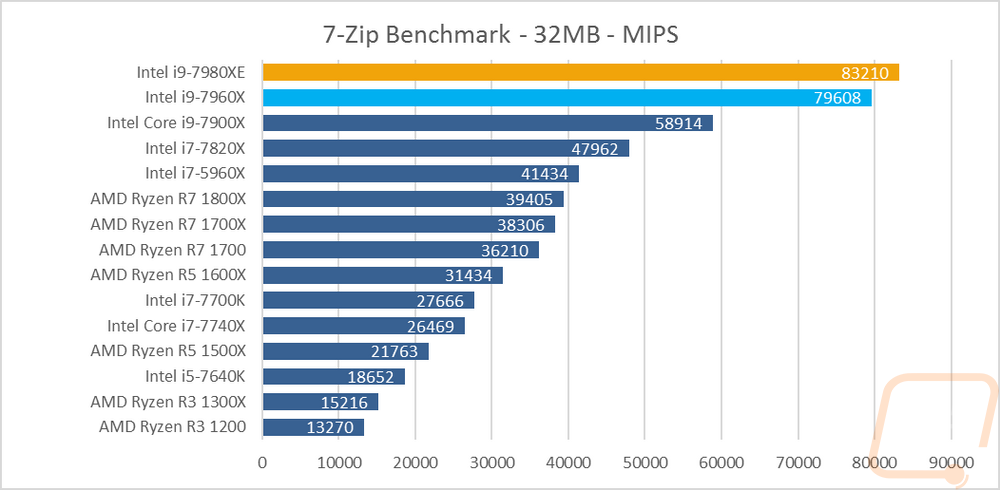
My next two tests seem a little different but are both math based. wPrime tests how quickly you can computer Pi, in this case to 1.024 billion decimals. Once again the high core count puts both CPUs in their own class, even when compared to the rest of the Core-X CPUs. Then in 7-Zip, we are checking encoding and decoding performance at a 32MB file size (the stock setting). This is also a highly multi-threaded workload and it shows, once again completely skewing the charts with both the 7890XE and 7960X towering above everything else.
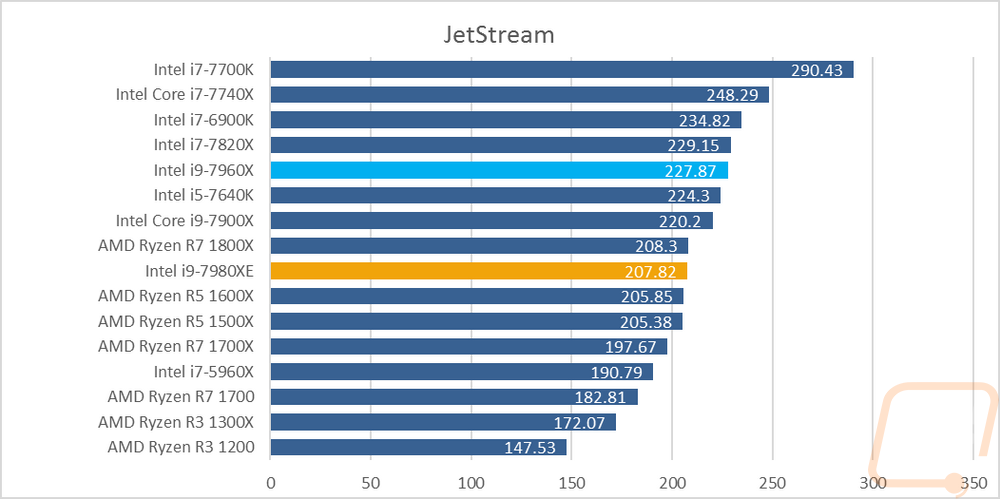
Now moving on to more real world loads I tested using the browser based JetStream benchmark that tests various HTML5 and Java loads and averages everything together. As you can see, browsing is going to be more clock speed dependent. So while the 7960X didn’t too bad the 7980XE fell behind and the 7700K is still the top dog here.
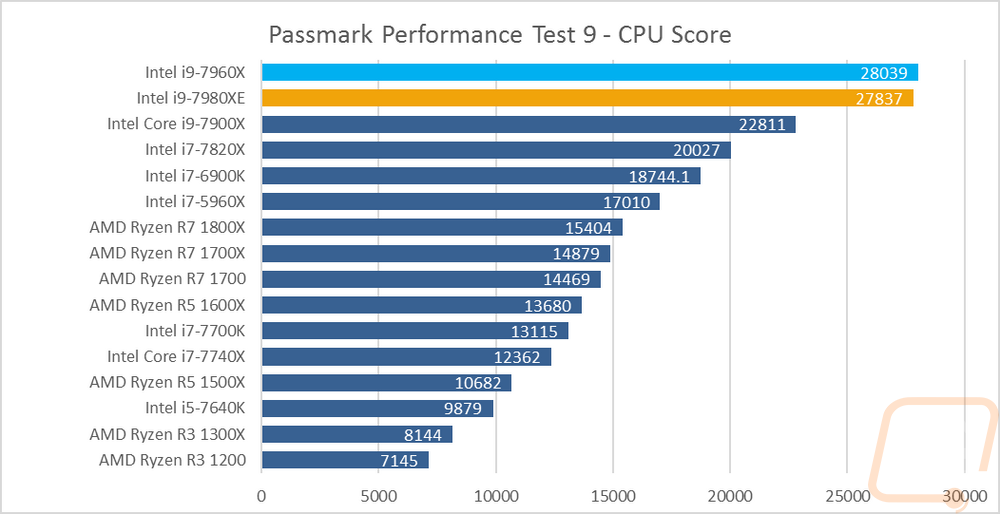
For my next test I wanted to get one last synthetic test in, but one that tests every aspect and averages it all out so I ran them through Passmarks Performance Test 9 for just the CPU score. Some of these benchmarks are core count favoring and others favor clock speeds but on average the 7980XE and 7960X came in nearly the same and up above everything else.
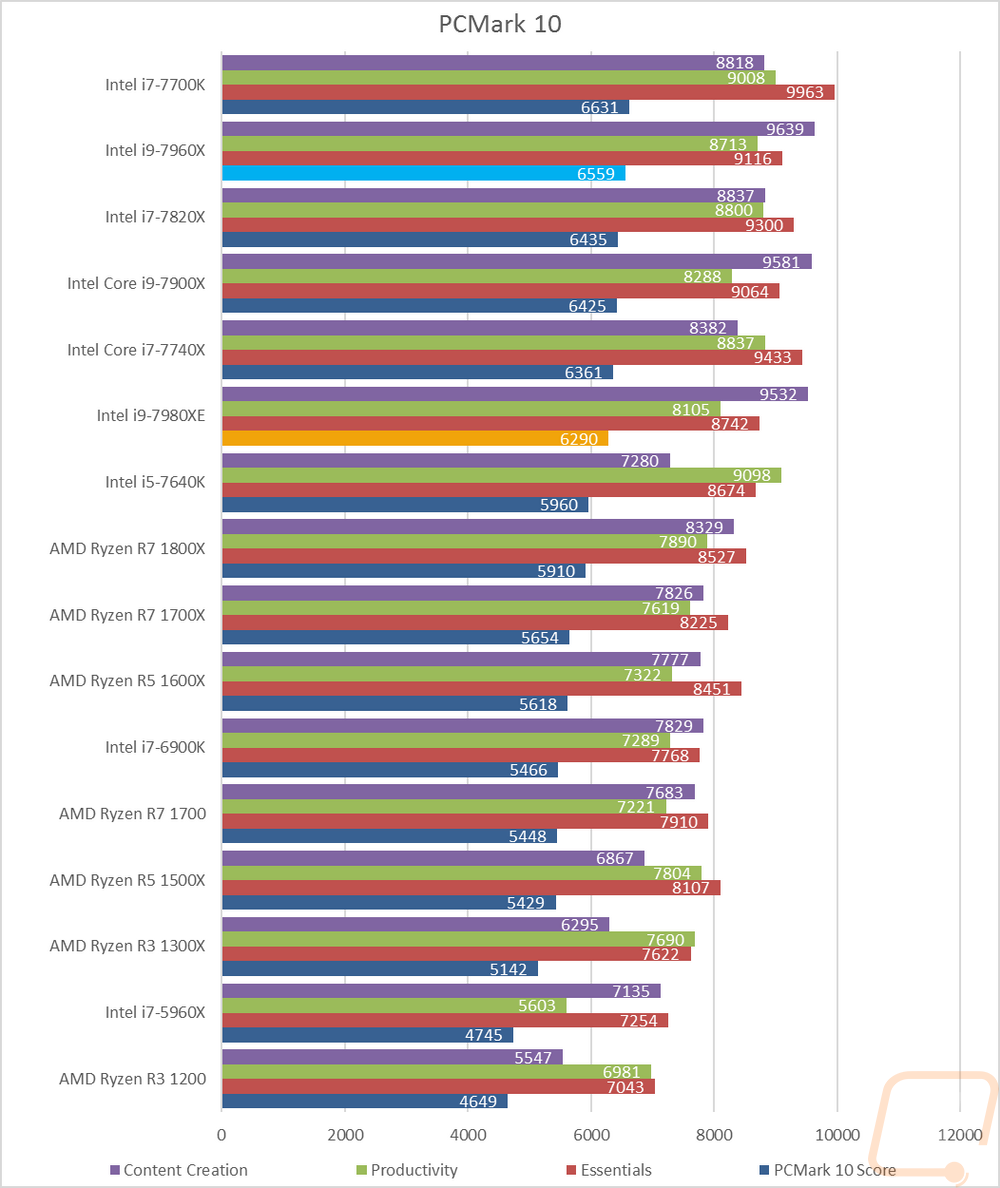
Then back to real-world uses I really like PCMark 10’s testing. They test using real programs that most people use every day to get their scores. Tests include the internet, videos, word and excel, photo editing, etc. Here, like in our browser test, the higher base clock speeds of the 7960X helped push it up higher than the 7980XE putting it just behind the 7700K.
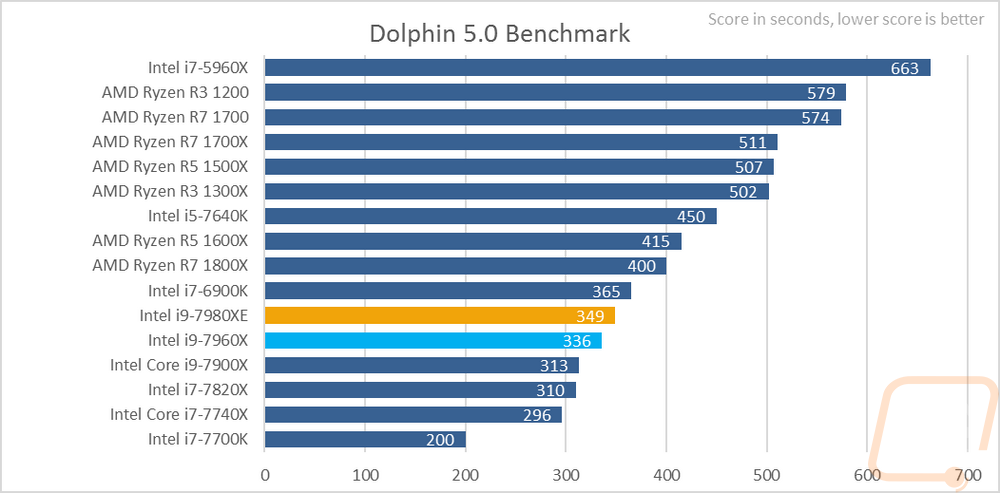
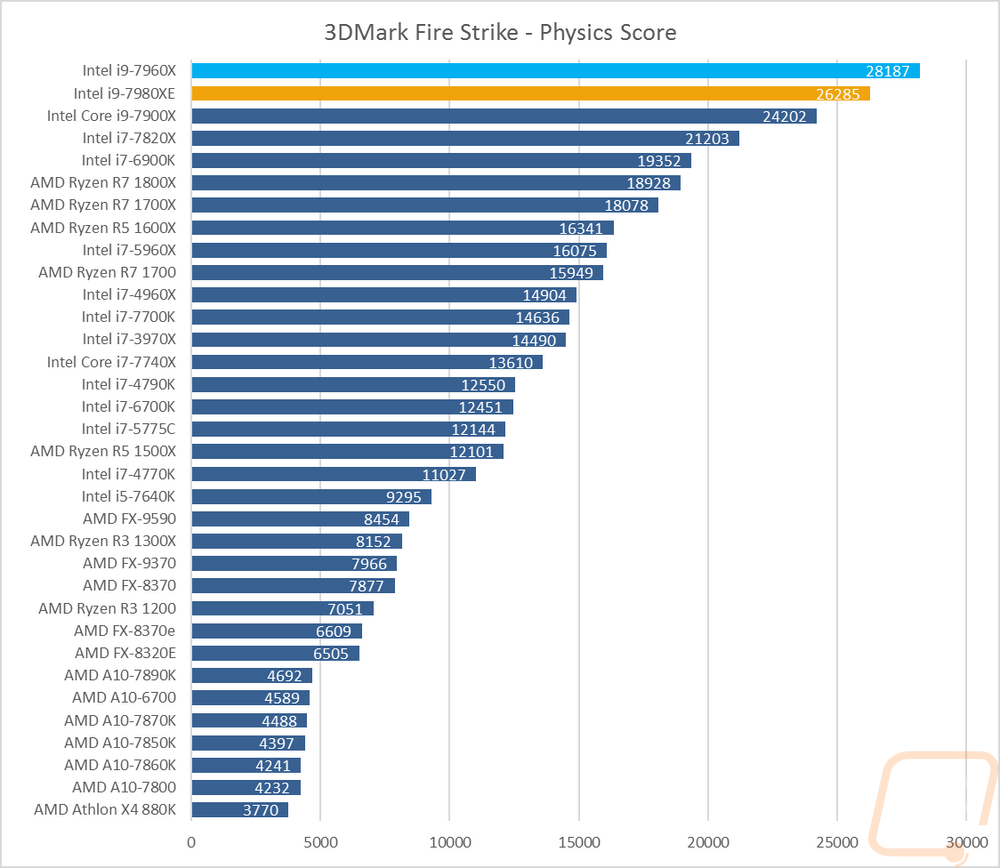
To start off gaming testing I used two synthetic loads. Dolphin 5.0 Benchmark, a Wii emulator and then 3DMark Fire Strike. In Dolphin 5.0 a lower score is better as it is the number of seconds it took to complete the test. Once again this is a test that favors clock speeds and because of that, the 7960X did better than the 7980XE as did most of the lower end Core-X CPUs and the 7700K. Even then they were still much better than the Ryzen scores. In 3DMark core count helps more, putting both CPUs up top though I was still surprised to see the 7960X out ahead of the 7980XE on this one. It seems the 7960X higher base clock combined with being very close in core count seems to average out better in tests that like high clock speeds but still support more cores.
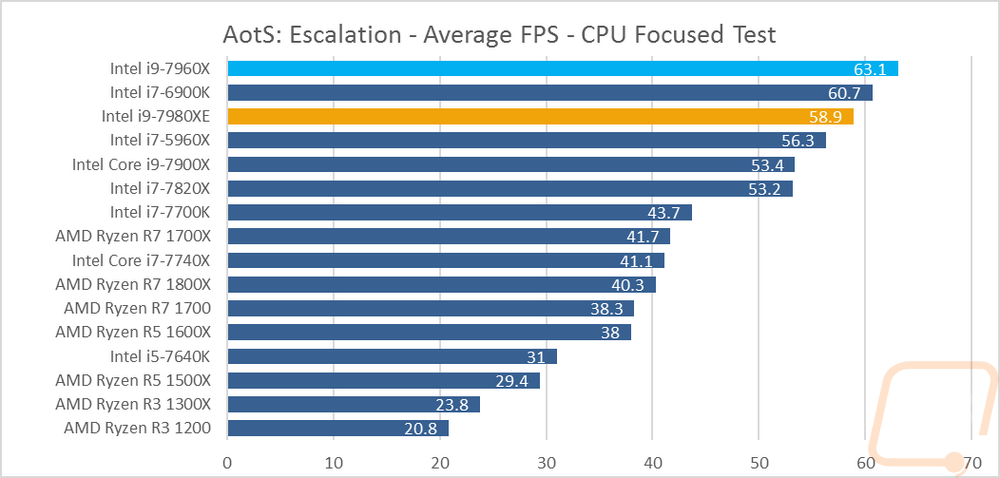
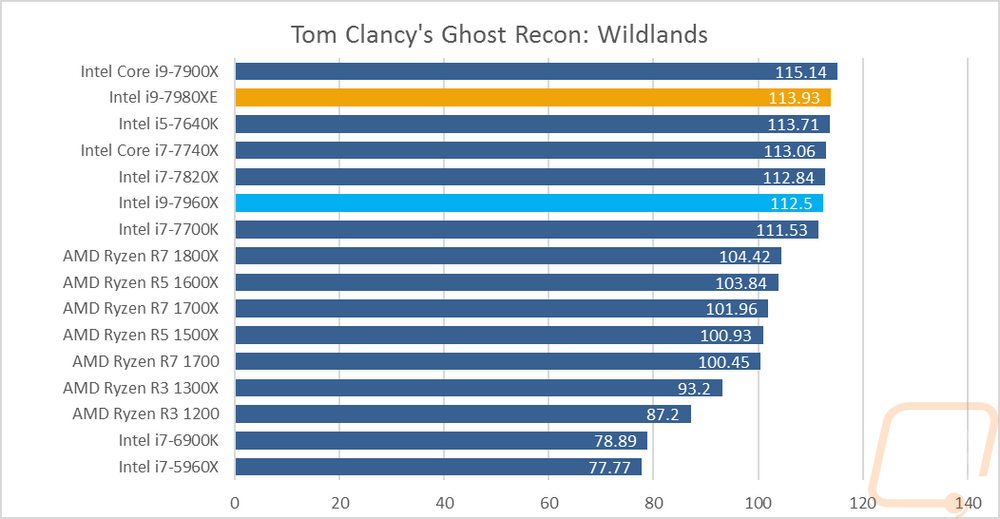
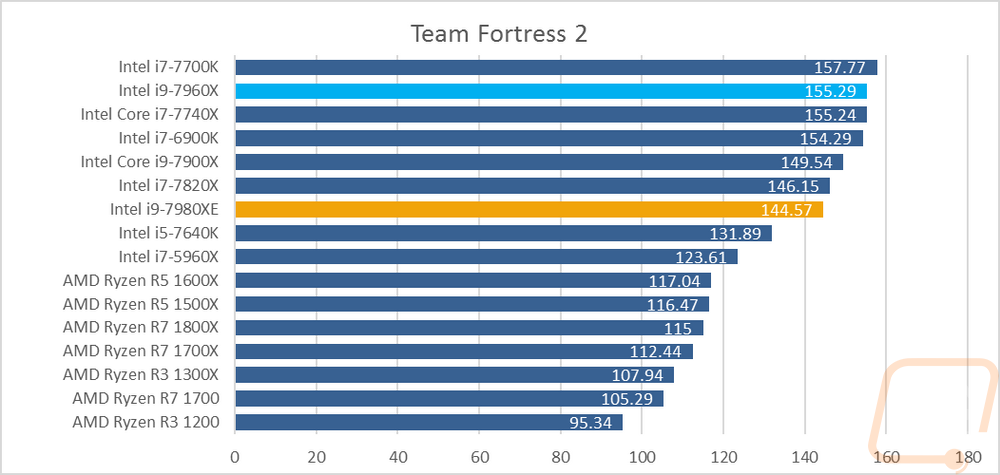
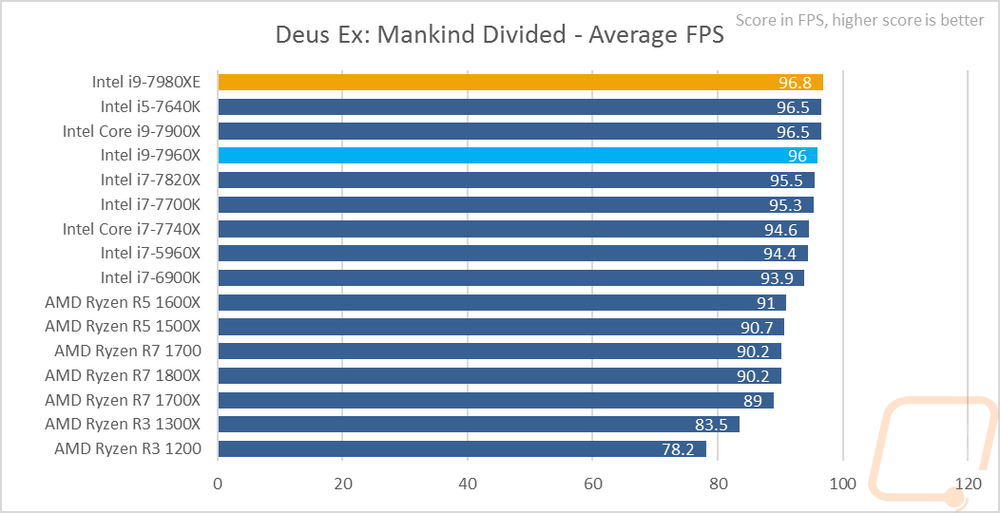
My last few tests were just taking a look at a mix of games for in game performance. I didn’t cover the same range of games that I test with video card reviews, but I did mix things up with Ashes of the Singularity that is highly CPU dependent and new, a less CPU dependent game with Ghost Recon: Wildlands, the old but still popular TF2, and then Deus Ex: Mankind Divided. This way I had old and new games and CPU dependent and non-dependent games. The end result was both being up near the top of the charts in AotS but the 7960X once again slipping into the lead. Ghost Recon: Wildlands showed that the performance gap between current Intel CPUs was very small but Ryzen is still behind. TF2 just loved clock speeds, especially from the Intel CPUs where you see a big range in FPS depending on what CPU you have. Then with Deus Ex, the gap is really small, even down to the slowest CPUs. Ryzen is still slower and the 7980XE is king here but the difference isn’t worth worrying about. In the end, it really depends on the game you are playing but overall Intel CPUs did really well with the higher clock speed CPUs normally being the better bet for gaming.
My last batch of testing was in ADI64 and frankly even just from the two CPUs I ended up with more data than I could graph so I put everything together in the table below. Dig through it at your own risk. When combined with all of the other CPUs I have tested in the last two months it ends up being WAY too much to sort through. To keep things short, the Core-X CPUs that support quad channel memory have great memory read and write speeds and Ryzen CPUs do better than Intel’s dual channel memory CPUs in that regard. The Cache performance of the 7980XE and 7960X are especially impressive due to their increased cache size. The same goes for their compute performance in every single one of those tests, in some cases being three or more times ahead of the 7700K and all of the Ryzen CPUs. Hell, the 7980XE is almost double the already fast 7900X.
|
CPU |
Memory Read |
Memory Write |
Memory Latency |
|
Intel Core i9-7980XE |
77004 MB/s |
68888 MB/s |
73.4 ns |
|
Intel Core i9-7960X |
79416 MB/s |
71554 MB/s |
74.9 ns |
|
Intel Core i7-7820X |
76049 MB/s |
73759 MB/s |
71.6 ns |
|
Intel Core i5-7640X |
30786 MB/s |
31888 MB/s |
68.5 ns |
|
Intel Core i9-7900X |
76856 MB/s |
72856 MB/s |
72.8 ns |
|
Intel Core i7-7740X |
38455 MB/s |
40596 MB/s |
53.2 ns |
|
Intel i7-6900K |
66786 MB/s |
68130 MB/s |
61.9 ns |
|
Intel i7-7700K |
38498 MB/s |
40448 MB/s |
52.7 ns |
|
Intel i7-5960X |
66108 MB/s |
49545 MB/s |
62.8 ns |
|
AMD Ryzen R7 1800X |
44031 MB/s |
43425 MB/s |
81.8 ns |
|
AMD Ryzen R7 1700X |
44493 MB/s |
43749 MB/s |
78.3 ns |
|
AMD Ryzen R7 1700 |
45343 MB/s |
43777 MB/s |
82.6 ns |
|
AMD Ryzen R5 1600X |
44452 MB/s |
43918 MB/s |
83.7 ns |
|
AMD Ryzen R5 1500X |
44289 MB/s |
43746 MB/s |
83.1 ns |
|
|
L1 Cache Read |
L1 Cache Write |
L1 Cache Latency |
|
Intel Core i9-7980XE |
3758.3 GB/s |
1896.7 GB/s |
1.1 ns |
|
Intel Core i9-7960X |
3532.3 GB/s |
1785.2 GB/s |
1.0 ns |
|
Intel Core i7-7820X |
1969.9 GB/s |
995.02 GB/s |
1.0 ns |
|
Intel Core i5-7640X |
1044.8 GB/s |
31888 GB/s |
1.0 ns |
|
Intel Core i9-7900X |
2418.5 GB/s |
709.16 GB/s |
1.0 ns |
|
Intel Core i7-7740X |
1102.7 GB/s |
561.25 GB/s |
0.9 ns |
|
Intel i7-6900K |
1963.9 GB/s |
999.59 GB/s |
1.0 ns |
|
Intel i7-7700K |
1114.6 GB/s |
560.82 GB/s |
0.9 ns |
|
Intel i7-5960X |
1748.5 GB/s |
874.60 GB/s |
1.2 ns |
|
AMD Ryzen R7 1800X |
917.46 GB/s |
460.16 GB/s |
1.1 ns |
|
AMD Ryzen R7 1700X |
867.89 GB/s |
435.33 GB/s |
1.2 ns |
|
AMD Ryzen R7 1700 |
793.90 GB/s |
398.12 GB/s |
1.3 ns |
|
AMD Ryzen R5 1600X |
689.47 GB/s |
345.95 GB/s |
1.1 ns |
|
AMD Ryzen R5 1500X |
446.84 GB/s |
224.01 GB/s |
1.1 ns |
|
|
L2 Cache Read |
L2 Cache Write |
L2 Cache Latency |
|
Intel Core i9-7980XE |
1671.7 GB/s |
1069.9 GB/s |
5.6 ns |
|
Intel Core i9-7960X |
1571.6 GB/s |
1003.5 GB/s |
5.1 ns |
|
Intel Core i7-7820X |
884.63 GB/s |
574.74 GB/s |
5.6 ns |
|
Intel Core i5-7640X |
397.26 GB/s |
247.00 GB/s |
2.9 ns |
|
Intel Core i9-7900X |
1037.3 GB/s |
521.94 GB/s |
5.2 ns |
|
Intel Core i7-7740X |
424.55 GB/s |
304.30 GB/s |
2.7 ns |
|
Intel i7-6900K |
710.28 GB/s |
310.34 GB/s |
4.1 ns |
|
Intel i7-7700K |
415.45 GB/s |
285.97 GB/s |
2.7 ns |
|
Intel i7-5960X |
623.08 GB/s |
272.77 GB/s |
3.5 ns |
|
AMD Ryzen R7 1800X |
831.95 GB/s |
446.37 GB/s |
4.7 ns |
|
AMD Ryzen R7 1700X |
809.29 GB/s |
419.38 GB/s |
5.0 ns |
|
AMD Ryzen R7 1700 |
742.92 GB/s |
389.73 GB/s |
5.4 ns |
|
AMD Ryzen R5 1600X |
630.99 GB/s |
334.93 GB/s |
4.7 ns |
|
AMD Ryzen R5 1500X |
306.82 GB/s |
211.58 GB/s |
11.8 ns |
|
|
L3 Cache Read |
L3 Cache Write |
L3 Cache Latency |
|
Intel Core i9-7980XE |
229.61 GB/s |
118.40 GB/s |
21.0 ns |
|
Intel Core i9-7960X |
220.22 GB/s |
121.04 GB/s |
19.8 ns |
|
Intel Core i7-7820X |
114.40 GB/s |
103.57 GB/s |
19.2 ns |
|
Intel Core i5-7640X |
228.31 GB/s |
163.86 GB/s |
11.1 ns |
|
Intel Core i9-7900X |
124.16 GB/s |
106.78 GB/s |
21.2 ns |
|
Intel Core i7-7740X |
287.01 GB/s |
186.67 GB/s |
21.2 ns |
|
Intel i7-6900K |
243.96 GB/s |
195.41 GB/s |
14.6 ns |
|
Intel i7-7700K |
234.50 GB/s |
188.70 GB/s |
10.4 ns |
|
Intel i7-5960X |
260.72 GB/s |
184.92 GB/s |
15.3 ns |
|
AMD Ryzen R7 1800X |
388.18 GB/s |
386.01 GB/s |
12.4 ns |
|
AMD Ryzen R7 1700X |
369.75 GB/s |
350.31 GB/s |
12.9 ns |
|
AMD Ryzen R7 1700 |
334.36 GB/s |
332.12 GB/s |
14.2 ns |
|
AMD Ryzen R5 1600X |
386.48 GB/s |
326.86 GB/s |
12.3 ns |
|
AMD Ryzen R5 1500X |
306.82 GB/s |
211.58 GB/s |
11.8 ns |
|
|
Single-Precision FLOPS |
Double Precision FLOPS |
AES-256 |
|
Intel Core i9-7980XE |
1831 GFLOPS |
915.5 GFLOPS |
69377 MB/s |
|
Intel Core i9-7960X |
1681 GFLOPS |
840.6 GFLOPS |
65409 MB/s |
|
Intel Core i7-7820X |
944.9 GFLOPS |
472.5 GFLOPS |
36420 MB/s |
|
Intel Core i5-7640X |
536.5 GFLOPS |
268.2 GFLOPS |
18547 MB/s |
|
Intel Core i9-7900X |
1148 GFLOPS |
574.5 GFLOPS |
45506 MB/s |
|
Intel Core i7-7740X |
575.4 GFLOPS |
287.8 GFLOPS |
20503 MB/s |
|
Intel i7-6900K |
1023 GFLOPS |
511.7 GFLOPS |
36340 MB/s |
|
Intel i7-7700K |
575.7 GFLOPS |
287.9 GFLOPS |
20519 MB/s |
|
Intel i7-5960X |
895.5 GFLOPS |
447.7 GFLOPS |
31783 MB/s |
|
AMD Ryzen R7 1800X |
472.4 GFLOPS |
236.2 GFLOPS |
64016 MB/s |
|
AMD Ryzen R7 1700X |
446.8 GFLOPS |
223.4 GFLOPS |
61730 MB/s |
|
AMD Ryzen R7 1700 |
408.5 GFLOPS |
204.3 GFLOPS |
56811 MB/s |
|
AMD Ryzen R5 1600X |
354.9 GFLOPS |
177.5 GFLOPS |
49340 MB/s |
|
AMD Ryzen R5 1500X |
229.8 GFLOPS |
114.8 GFLOPS |
31983 MB/s |
|
|
24-bit Integer IOPS |
32-bit Integer IOPS |
64-bit Integer IOPS |
|
Intel Core i9-7980XE |
821.2 GIOPS |
821.3 GIOPS |
121.6 GIOPS |
|
Intel Core i9-7960X |
754.0 GIOPS |
753.9 GIOPS |
114.7 GIOPS |
|
Intel Core i7-7820X |
423.7 GIOPS |
423.7 GIOPS |
63.85 GIOPS |
|
Intel Core i5-7640X |
238.1 GIOPS |
138.1 GIOPS |
33.53 GIOPS |
|
Intel Core i9-7900X |
515.1 GIOPS |
515.0 GIOPS |
79.76 GIOPS |
|
Intel Core i7-7740X |
258.1 GIOPS |
258.0 GIOPS |
35.97 GIOPS |
|
Intel i7-6900K |
255.9 GIOPS |
255.9 GIOPS |
63.96 GIOPS |
|
Intel i7-7700K |
258.0 GIOPS |
258.0 GIOPS |
35.98 GIOPS |
|
Intel i7-5960X |
223.9 GIOPS |
223.9 GIOPS |
55.97 GIOPS |
|
AMD Ryzen R7 1800X |
118.1 GIOPS |
118.1 GIOPS |
59.03 GIOPS |
|
AMD Ryzen R7 1700X |
111.7 GIOPS |
111.7 GIOPS |
55.84 GIOPS |
|
AMD Ryzen R7 1700 |
102.1 GIOPS |
102.1 GIOPS |
51.05 GIOPS |
|
AMD Ryzen R5 1600X |
88.74 GIOPS |
88.73 GIOPS |
44.34 GIOPS |
|
AMD Ryzen R5 1500X |
57.43 GIOPS |
57.45 GIOPS |
28.72 GIOPS |
