CPU Performance
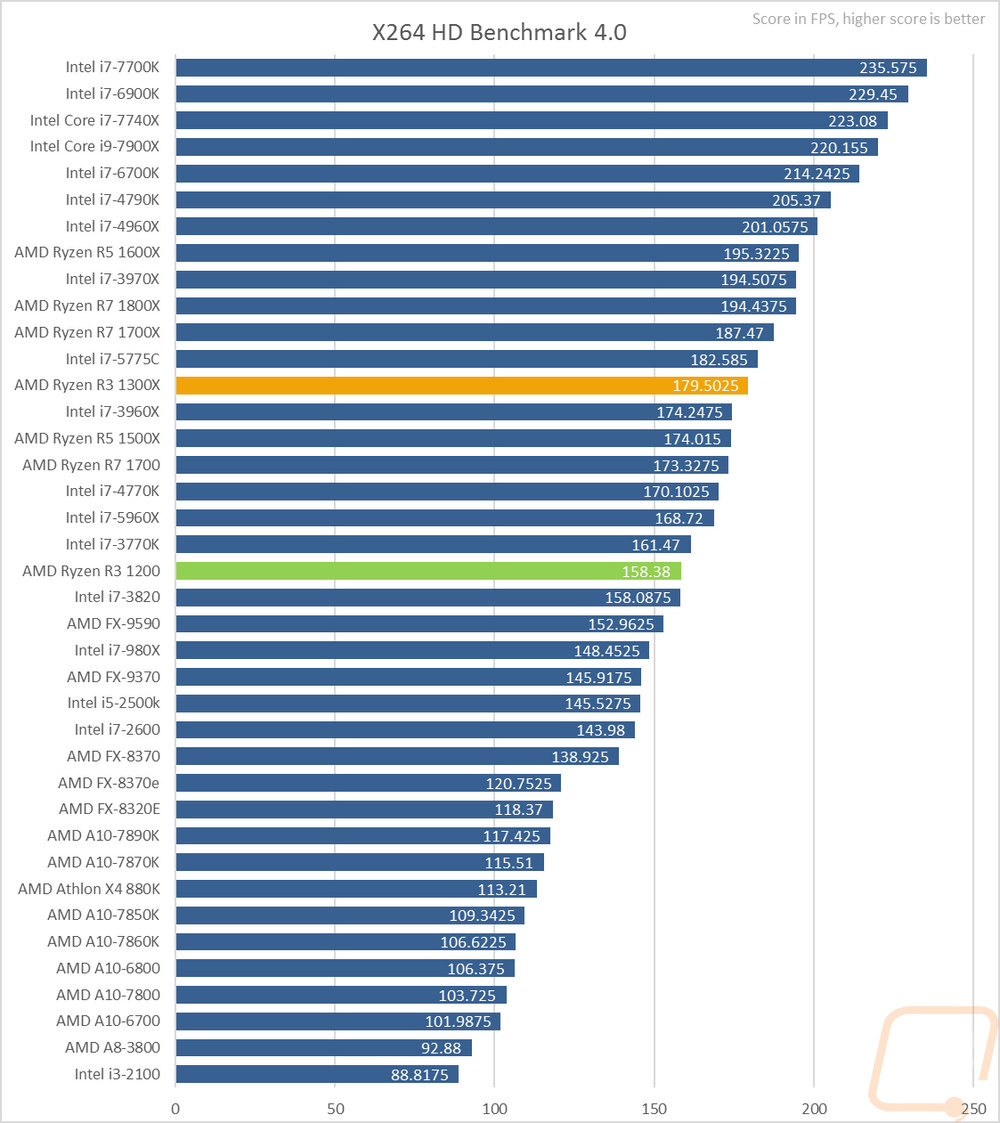
For performance testing, I busted out our AM4 test platform with its Asus Crosshair VI Hero motherboard, Noctua cooler, and Corsair memory (you can find out more details on the previous page) and got started. Our testing includes a range of situational benchmarks, overall benchmarks, and gaming benchmarks to get a feel for the overall performance. Sadly I don’t have any of Intel’s lower end CPUs for comparison but we do have past generation benchmarks as well as a mix of the current generations CPUs as well as nearly everything from the Ryzen lineup. I started my testing off with a classic, X264 HD Benchmark 4.0. This tests the average FPS of the encoding speed. With the two Ryzen 3 CPUs having quad cores they did really well here with the 1300X out performing a few of Intel’s high-end CPUs from just a generation or two ago like the 4770K and the always an oddball 5775C. The R2 1200 with its lower clock speeds came in lower but still above the high end FX-9590, a great example of how far things have come.
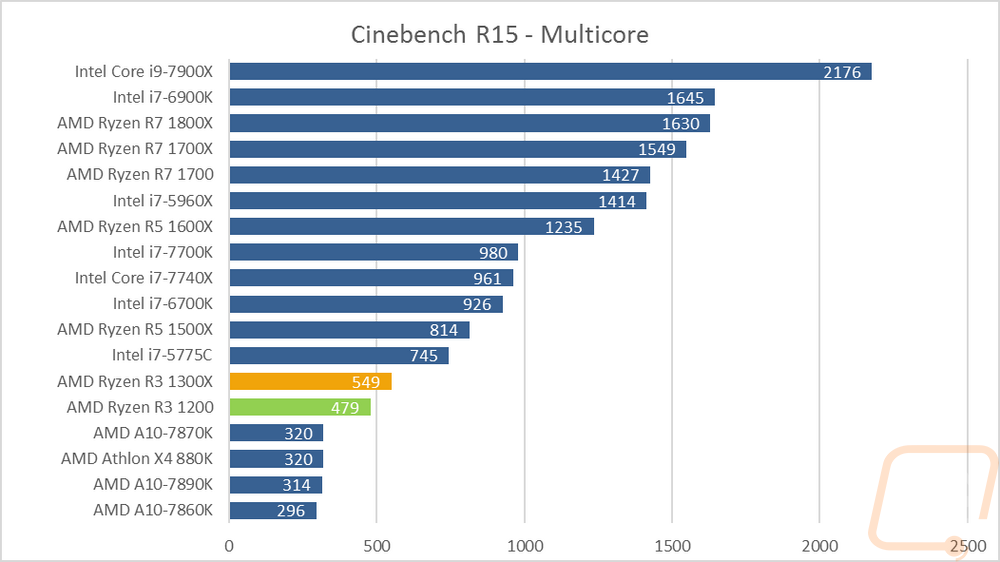
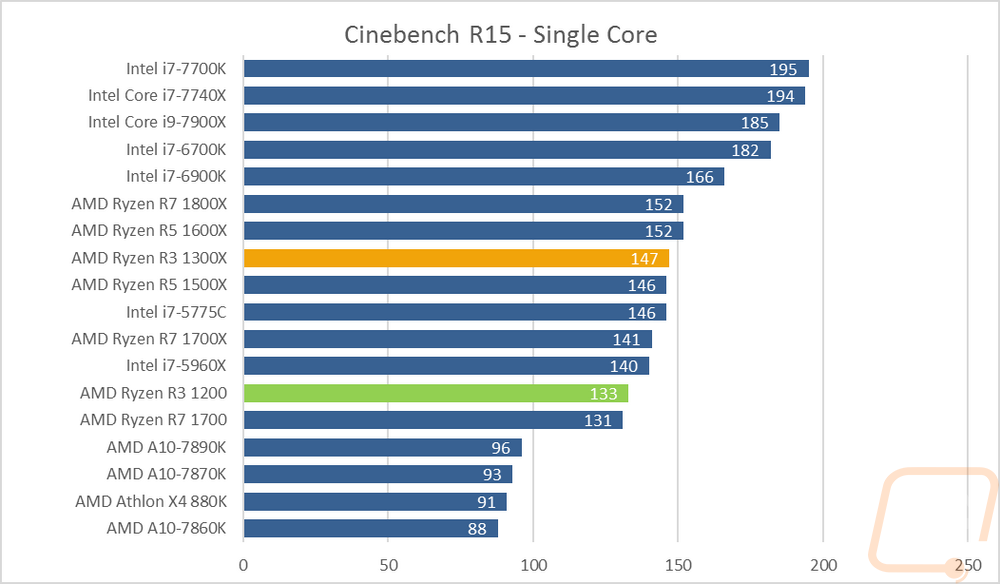
I then moved on to my favorite benchmark, Cinebench R15. I don’t specifically care about this test because of the content. It is focused on rendering performance, not something as important with a lower end CPU, but I love that it tests both multi-core performance and single core to get a look it as well. In the multicore tests, the two quad cores did already but still struggled to keep up with even the 5775C, mind you that was a high-end CPU just two generations ago so it is understandable. In the single core test, the 3.7 boost clock of the 1300X really excelled putting it right up in the middle of the R5’s. This isn’t a huge surprise though considering the 1500X and the 1300X share the same clock speeds.
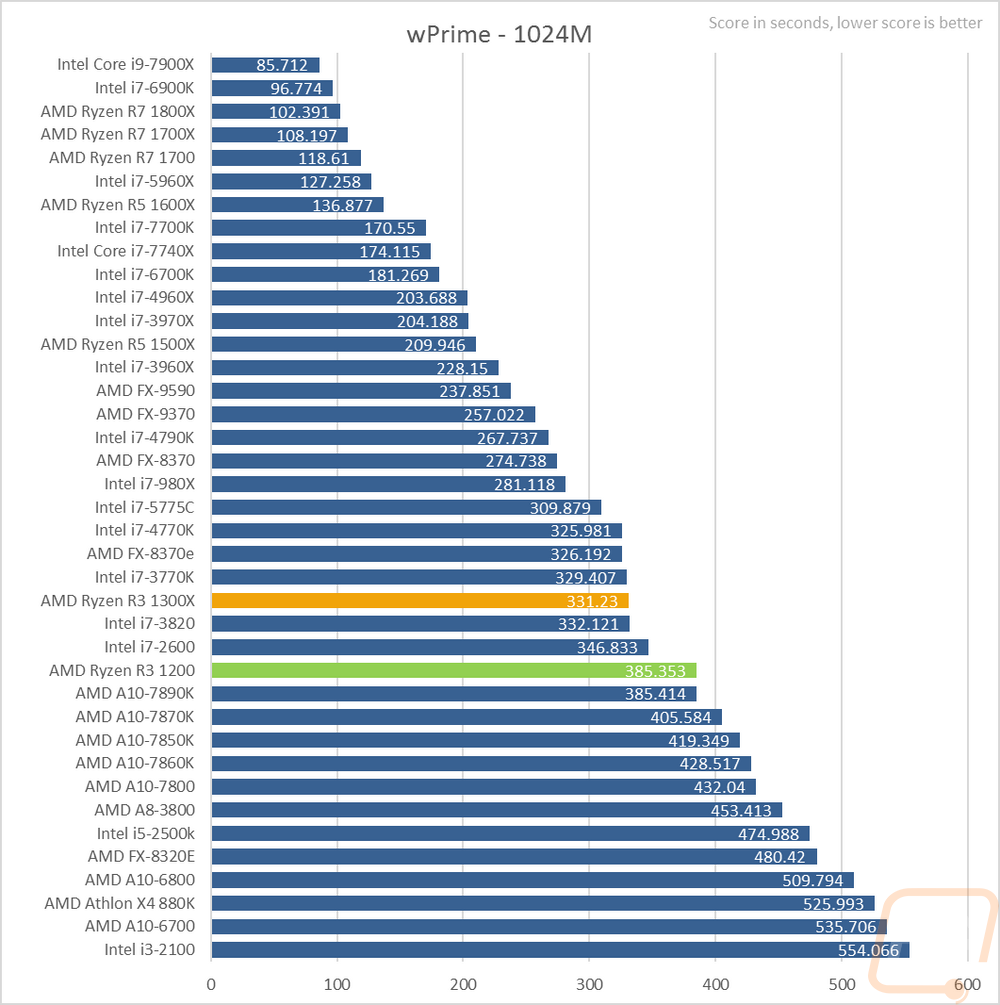
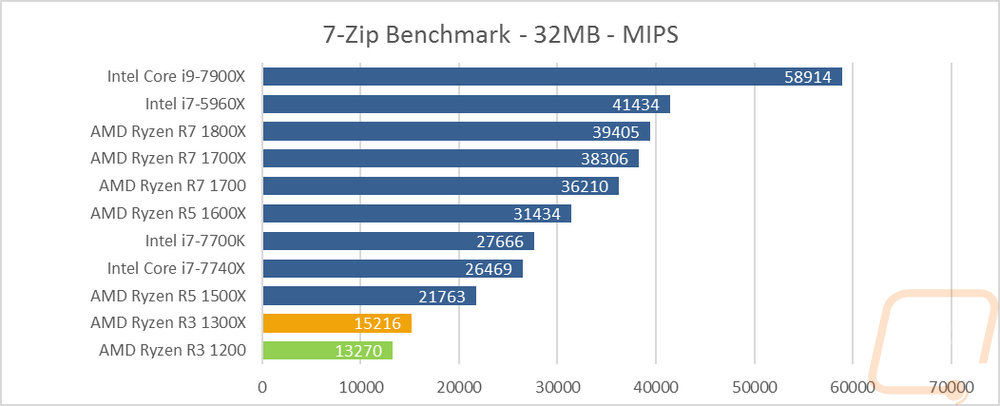
The next two tests are more math focused. wPrime shows the speed to calculate prime and 7-Zip shows compressing performance. In wPrime our goal is to get the lowest number because it is time based. This test favors high core counts and although we have four cores not having the 8 threads hurts here. The 1500X was 130 seconds faster than the 1300X and both CPUs ended up right with the i7-2600K, a very old CPU that is still popular today because in a lot of situations it still has the power needed to get the job done. 7-Zip is also multi-core focused and you can see it again in the numbers with a big gap between the 1300X and the 1500X. Of course, every CPU tested, in that case, costs a LOT more as well.
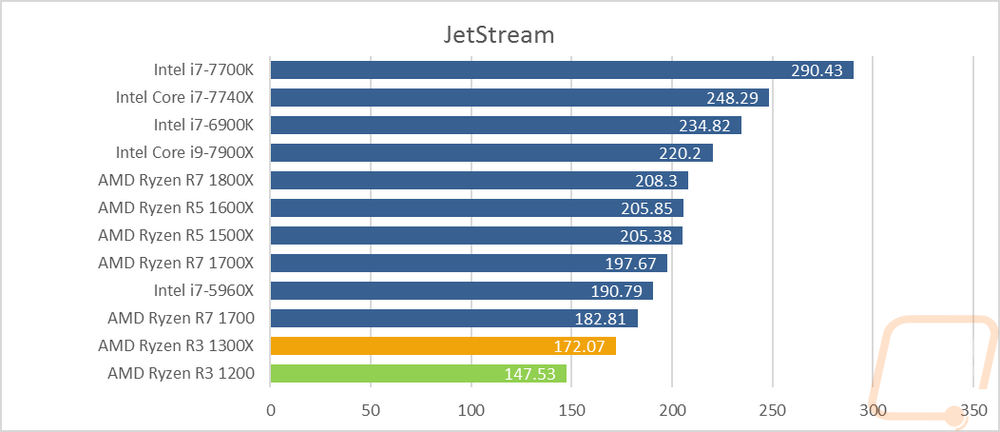
Because most people still spend a majority of their PC time browsing the internet, I like to include a browser based benchmark as well. This is tested in Chrome so the results would vary a little between the other browsers but they are comparable between CPUs. The test averages across a whole series of tests, run three times for consistency. The 1300X does really well here, coming in a lot closer than expected to the higher end CPUs with the R3 1200 lacking but still not doing too bad.
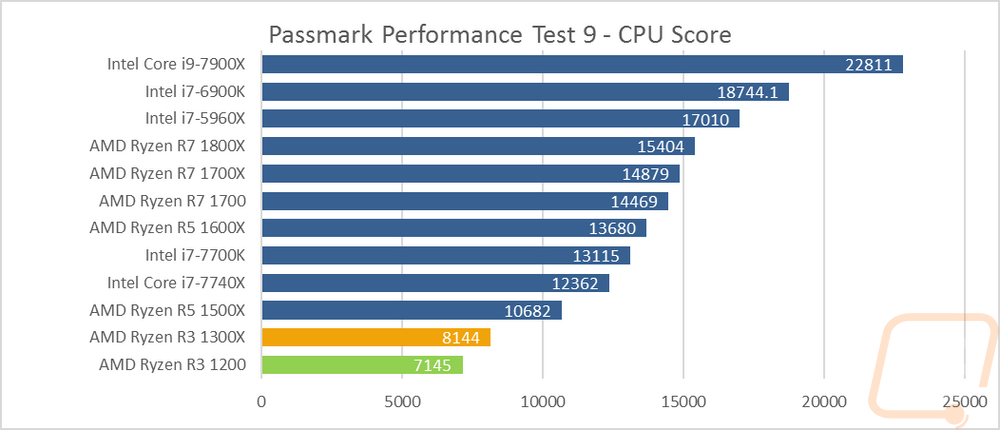
Getting into the more general benchmarks I used Passmarks Performance Test 9 with just the CPU benchmark. This tests Mathematical operations, compression, encryption, and physics across a few different tests then creates a score. Both scores may look low compared to what I have tested recently, but have a look at Passmarks other scores HERE for high-end CPUs and HERE for mid range CPUs. The 1200 is competing with current generation i5’s and the 1300X is getting up there with some of the i7’s. Those extra cores really help here.
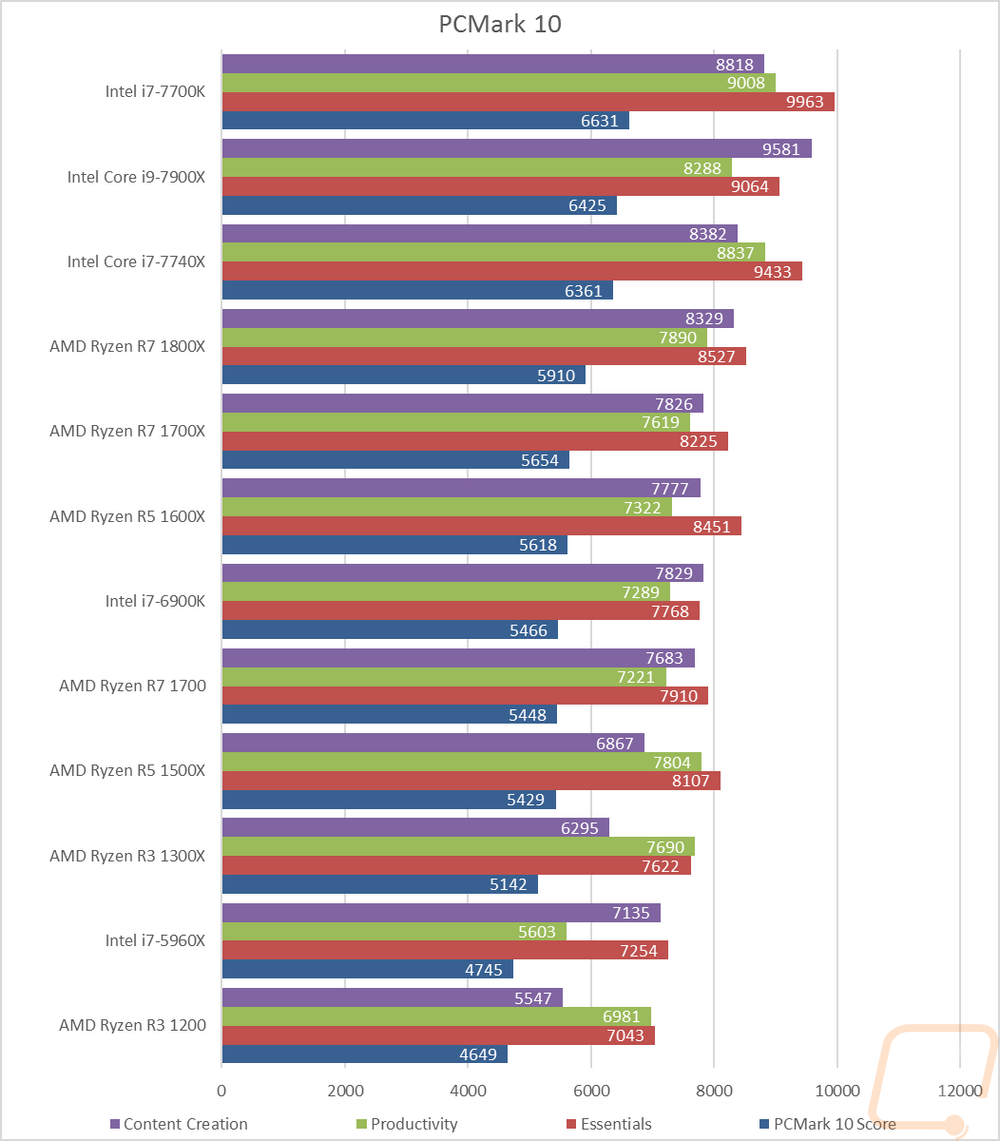
Then for a general look at the performance I like PCMark 10 where it tests using normally used programs like your browser, photo editing, videos, and office programs like excel and word. In these tests, the 1300X and 1200 both have lower overall scores but are surprisingly close in things like productivity and the essentials.
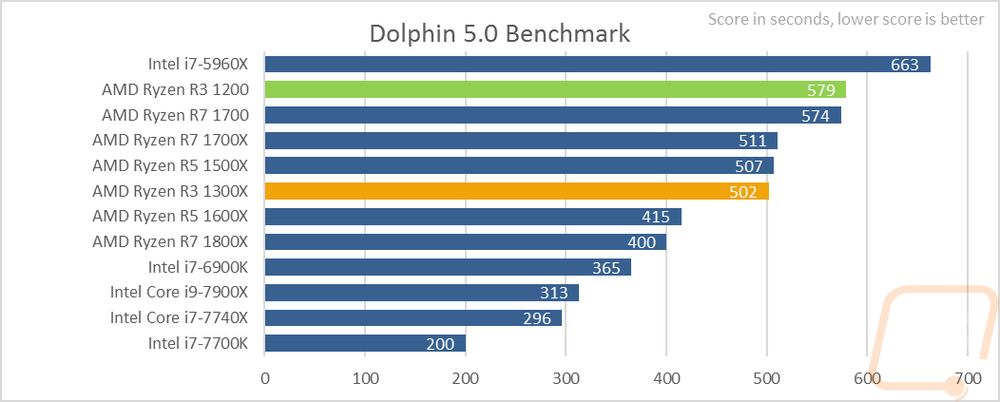
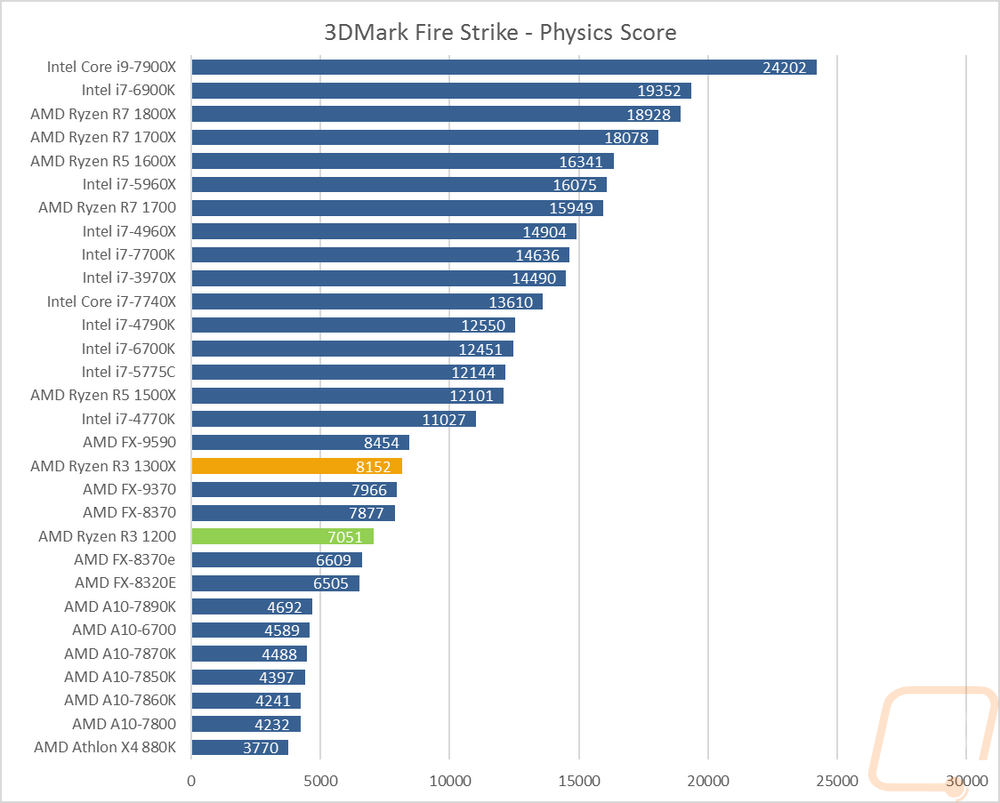
Moving into the more gaming focused tests I started things off with Dolphin 5.0 an emulator that relies heavily on CPU power. This is time based so lower scores are the goal. So the R3 1200 didn’t do as well as the 1300X, but it still hung in there with all of the Ryzen CPUs. Of course, the higher IPC Intel’s still did better though. Then I tested using 3DMark Fire Strike, focusing on the Physics score that is CPU focused. Here the 1300X was near the old FX-9590 but still needs the additional threads and cache of the 1500X to start performing with the 4770K and higher. The two Ryzen 3 CPUs did still stomp almost everything from the previous high end from AMD and should do really well compared to Intel’s lower end as well.
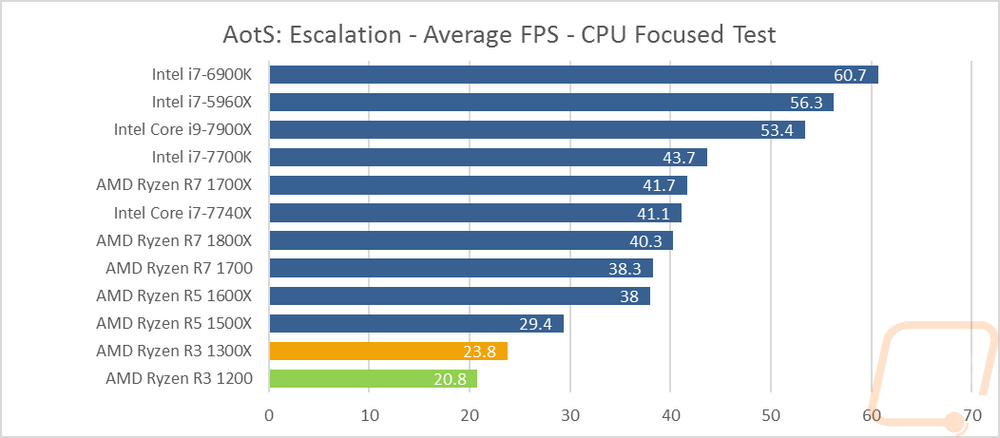
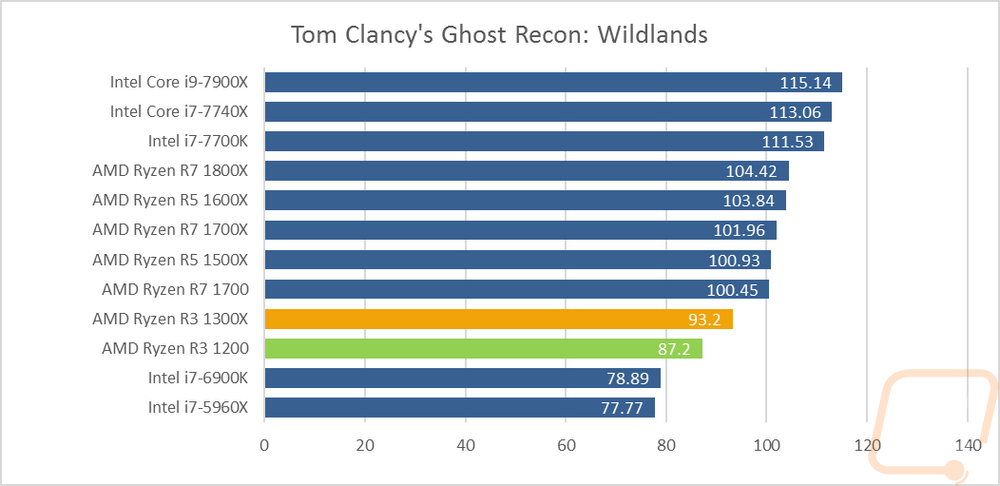
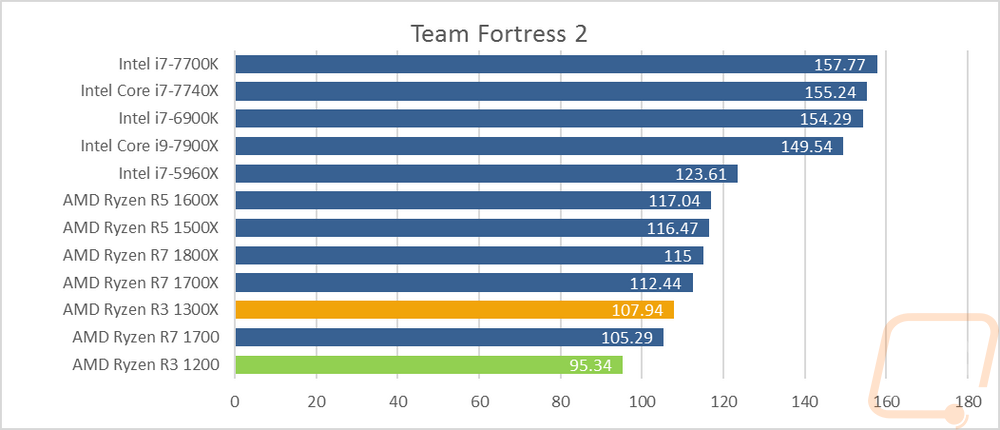
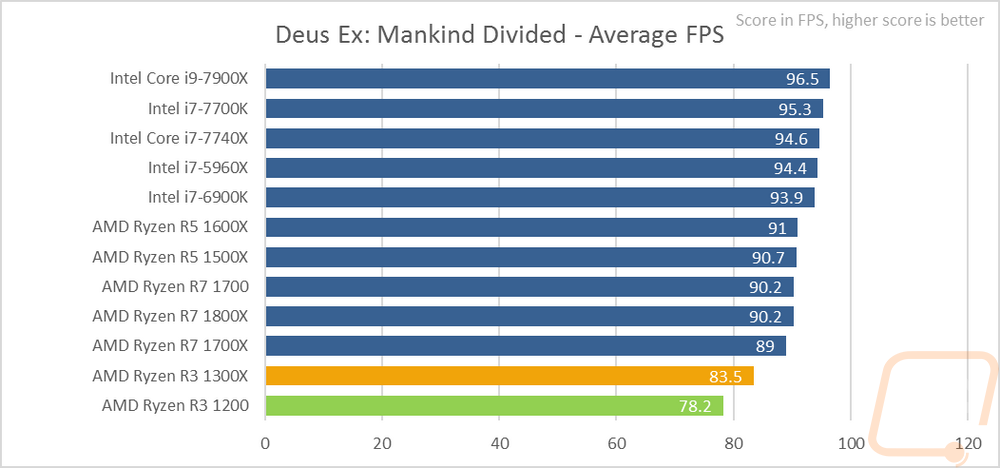
Then I finally got into actual gaming performance. Really this was what I was most curious about. Am I going to see noticeable increases in gaming performance by skipping out on the Ryzen 3 and going with much more expensive CPUs? The answer is complicated, but the short answer is it will depend on the game. In Deus Ex, most of the CPUs are within 5 FPS of each other but the two Ryzen 3 CPUs do lag behind. TF2 doesn’t have as big of a gap between the Ryzen CPUs, instead all of the higher IPC CPUs from Intel are faster here and given the age of the title that isn’t a big surprise, it is very CPU limited. Ghost Recon Wildlands had a few levels of performance, but the Ryzen 3’s still came in faster than a few of Intel’s high end $1000 CPUs and I don’t mean old out of date models. There is still a big gap in the Ryzen lineup and I suspect the lower Cache plays a big role in that. Then in Ashes of the Singularity, this is a Ryzen optimized title but when run in the CPU focused benchmark like we did here it is extremely demanding and the Ryzen 3 CPUs did drop to the bottom of the list.
For my last batch of testing, I busted out AIDA64 and ran through their memory and cache benchmark as well as their FLOPs testing. Together this was far too much to try to pack into a graph so we have this large table below to sort through. Memory read and write speeds of all of the Ryzen CPUs are all about the same, same with the memory latency. Of course, the higher end X299 and X99 Intel platforms dominate here with their quad channel memory but the lower memory latency on the Intel side is what stood out to me. I wonder if Ryzen struggle with this a little with the infinity fabric design. All of the cache performance is about the same, Ryzen CPUs have slower cache performance than those high-end Intel platforms. The 8MB L3 cache Ryzen CPUs have a noticeable drop in performance and overall the performance goes up as the clock speeds go up, so the 1600X, for example, does really well compared to the other Ryzen CPUs. IOPS performance across Ryzen is less than half that of the mainstream Intel CPUs and even less in the high end, between the Ryzen CPUs the IOPS go up depending on the base number of cores, so the 1500X, 1300X, and 1200 are all close together. The FLOPs are similar but the higher clock speeds play a big role leaving the R3 1200 down at the bottom. AES-256 is really the only benchmark here where Ryzen sees’s an advantage. The R3 1200 is even up above the i7-7770K and the higher end Ryzen CPUs pull ahead of the much more expensive Intel CPUs.
|
CPU |
Memory Read |
Memory Write |
Memory Latency |
|
Intel Core i9-7900X |
76856 MB/s |
72856 MB/s |
72.8 ns |
|
Intel Core i7-7740X |
38455 MB/s |
40596 MB/s |
53.2 ns |
|
Intel i7-6900K |
66786 MB/s |
68130 MB/s |
61.9 ns |
|
Intel i7-7700K |
38498 MB/s |
40448 MB/s |
52.7 ns |
|
Intel i7-5960X |
66108 MB/s |
49545 MB/s |
62.8 ns |
|
AMD Ryzen R7 1800X |
44031 MB/s |
43425 MB/s |
81.8 ns |
|
AMD Ryzen R7 1700X |
44493 MB/s |
43749 MB/s |
78.3 ns |
|
AMD Ryzen R7 1700 |
45343 MB/s |
43777 MB/s |
82.6 ns |
|
AMD Ryzen R5 1600X |
44452 MB/s |
43918 MB/s |
83.7 ns |
|
AMD Ryzen R5 1500X |
44289 MB/s |
43746 MB/s |
83.1 ns |
|
AMD Ryzen R3 1300X |
44301 MB/s |
44294 MB/s |
83.5 ns |
|
AMD Ryzen R3 1200 |
44312 MB/s |
44299 MB/s |
86.0 ns |
|
|
L1 Cache Read |
L1 Cache Write |
L1 Cache Latency |
|
Intel Core i9-7900X |
2418.5 GB/s |
709.16 GB/s |
1.0 ns |
|
Intel Core i7-7740X |
1102.7 GB/s |
561.25 GB/s |
0.9 ns |
|
Intel i7-6900K |
1963.9 GB/s |
999.59 GB/s |
1.0 ns |
|
Intel i7-7700K |
1114.6 GB/s |
560.82 GB/s |
0.9 ns |
|
Intel i7-5960X |
1748.5 GB/s |
874.60 GB/s |
1.2 ns |
|
AMD Ryzen R7 1800X |
917.46 GB/s |
460.16 GB/s |
1.1 ns |
|
AMD Ryzen R7 1700X |
867.89 GB/s |
435.33 GB/s |
1.2 ns |
|
AMD Ryzen R7 1700 |
793.90 GB/s |
398.12 GB/s |
1.3 ns |
|
AMD Ryzen R5 1600X |
689.47 GB/s |
345.95 GB/s |
1.1 ns |
|
AMD Ryzen R5 1500X |
446.84 GB/s |
224.01 GB/s |
1.1 ns |
|
AMD Ryzen R3 1300X |
446.59 GB/s |
223.99 GB/s |
1.1 ns |
|
AMD Ryzen R3 1200 |
384.78 GB/s |
192.89 GB/s |
1.2 ns |
|
|
L2 Cache Read |
L2 Cache Write |
L2 Cache Latency |
|
Intel Core i9-7900X |
1037.3 GB/s |
521.94 GB/s |
5.2 ns |
|
Intel Core i7-7740X |
424.55 GB/s |
304.30 GB/s |
2.7 ns |
|
Intel i7-6900K |
710.28 GB/s |
310.34 GB/s |
4.1 ns |
|
Intel i7-7700K |
415.45 GB/s |
285.97 GB/s |
2.7 ns |
|
Intel i7-5960X |
623.08 GB/s |
272.77 GB/s |
3.5 ns |
|
AMD Ryzen R7 1800X |
831.95 GB/s |
446.37 GB/s |
4.7 ns |
|
AMD Ryzen R7 1700X |
809.29 GB/s |
419.38 GB/s |
5.0 ns |
|
AMD Ryzen R7 1700 |
742.92 GB/s |
389.73 GB/s |
5.4 ns |
|
AMD Ryzen R5 1600X |
630.99 GB/s |
334.93 GB/s |
4.7 ns |
|
AMD Ryzen R5 1500X |
306.82 GB/s |
211.58 GB/s |
11.8 ns |
|
AMD Ryzen R3 1300X |
350.76 GB/s |
220.75 GB/s |
4.5 ns |
|
AMD Ryzen R3 1200 |
301.38 GB/s |
183.59 GB/s |
5.2 ns |
|
|
L3 Cache Read |
L3 Cache Write |
L3 Cache Latency |
|
Intel Core i9-7900X |
124.16 GB/s |
106.78 GB/s |
21.2 ns |
|
Intel Core i7-7740X |
287.01 GB/s |
186.67 GB/s |
21.2 ns |
|
Intel i7-6900K |
243.96 GB/s |
195.41 GB/s |
14.6 ns |
|
Intel i7-7700K |
234.50 GB/s |
188.70 GB/s |
10.4 ns |
|
Intel i7-5960X |
260.72 GB/s |
184.92 GB/s |
15.3 ns |
|
AMD Ryzen R7 1800X |
388.18 GB/s |
386.01 GB/s |
12.4 ns |
|
AMD Ryzen R7 1700X |
369.75 GB/s |
350.31 GB/s |
12.9 ns |
|
AMD Ryzen R7 1700 |
334.36 GB/s |
332.12 GB/s |
14.2 ns |
|
AMD Ryzen R5 1600X |
386.48 GB/s |
326.86 GB/s |
12.3 ns |
|
AMD Ryzen R5 1500X |
306.82 GB/s |
211.58 GB/s |
11.8 ns |
|
AMD Ryzen R3 1300X |
232.44 GB/s |
124.18 GB/s |
11.5 ns |
|
AMD Ryzen R3 1200 |
216.71 GB/s |
175.64 GB/s |
13.2 ns |
|
|
Single-Precision FLOPS |
Double Precision FLOPS |
AES-256 |
|
Intel Core i9-7900X |
1148 GFLOPS |
574.5 GFLOPS |
45506 MB/s |
|
Intel Core i7-7740X |
575.4 GFLOPS |
287.8 GFLOPS |
20503 MB/s |
|
Intel i7-6900K |
1023 GFLOPS |
511.7 GFLOPS |
36340 MB/s |
|
Intel i7-7700K |
575.7 GFLOPS |
287.9 GFLOPS |
20519 MB/s |
|
Intel i7-5960X |
895.5 GFLOPS |
447.7 GFLOPS |
31783 MB/s |
|
AMD Ryzen R7 1800X |
472.4 GFLOPS |
236.2 GFLOPS |
64016 MB/s |
|
AMD Ryzen R7 1700X |
446.8 GFLOPS |
223.4 GFLOPS |
61730 MB/s |
|
AMD Ryzen R7 1700 |
408.5 GFLOPS |
204.3 GFLOPS |
56811 MB/s |
|
AMD Ryzen R5 1600X |
354.9 GFLOPS |
177.5 GFLOPS |
49340 MB/s |
|
AMD Ryzen R5 1500X |
229.8 GFLOPS |
114.8 GFLOPS |
31983 MB/s |
|
AMD Ryzen R3 1300X |
229.4 GFLOPS |
114.7 GFLOPS |
28177 MB/s |
|
AMD Ryzen R3 1200 |
197.4 GFLOPS |
98.74 GFLOPS |
24263 MB/s |
|
|
24-bit Integer IOPS |
32-bit Integer IOPS |
64-bit Integer IOPS |
|
Intel Core i9-7900X |
515.1 GIOPS |
515.0 GIOPS |
79.76 GIOPS |
|
Intel Core i7-7740X |
258.1 GIOPS |
258.0 GIOPS |
35.97 GIOPS |
|
Intel i7-6900K |
255.9 GIOPS |
255.9 GIOPS |
63.96 GIOPS |
|
Intel i7-7700K |
258.0 GIOPS |
258.0 GIOPS |
35.98 GIOPS |
|
Intel i7-5960X |
223.9 GIOPS |
223.9 GIOPS |
55.97 GIOPS |
|
AMD Ryzen R7 1800X |
118.1 GIOPS |
118.1 GIOPS |
59.03 GIOPS |
|
AMD Ryzen R7 1700X |
111.7 GIOPS |
111.7 GIOPS |
55.84 GIOPS |
|
AMD Ryzen R7 1700 |
102.1 GIOPS |
102.1 GIOPS |
51.05 GIOPS |
|
AMD Ryzen R5 1600X |
88.74 GIOPS |
88.73 GIOPS |
44.34 GIOPS |
|
AMD Ryzen R5 1500X |
57.43 GIOPS |
57.45 GIOPS |
28.72 GIOPS |
|
AMD Ryzen R3 1300X |
57.35 GIOPS |
57.34 GIOPS |
28.67 GIOPS |
|
AMD Ryzen R3 1200 |
49.38 GIOPS |
49.38 GIOPS |
24.68 GIOPS |
