CPU Performance
To test out both of the new CPUs I setup our new X299 testbench with the Asus Prime X299 Deluxe along with a GTX 1080 Ti. Then for tests, I went through our test suite that I updated for the Ryzen launch and made a few changes. Then, of course, I went back and retested for days all of the Ryzen CPUs, the Intel i7-7700K, and the older i7-5960X and the i7-6900K as well. This gave me the chance to retest Ryzen with a higher clock speed memory that it benefits from and to update numbers now that the platform is more up to date. The mix of CPUs covered all of AMDs current offerings, older and newer X99 CPUs, and Intel’s current flagship mainstream CPUs as well. Our test suite includes a variety of CPU specific benchmarks, games, overall PC benchmarks, and a few deep level benchmarks that look at things like the Memory and Cache speeds and latencies.
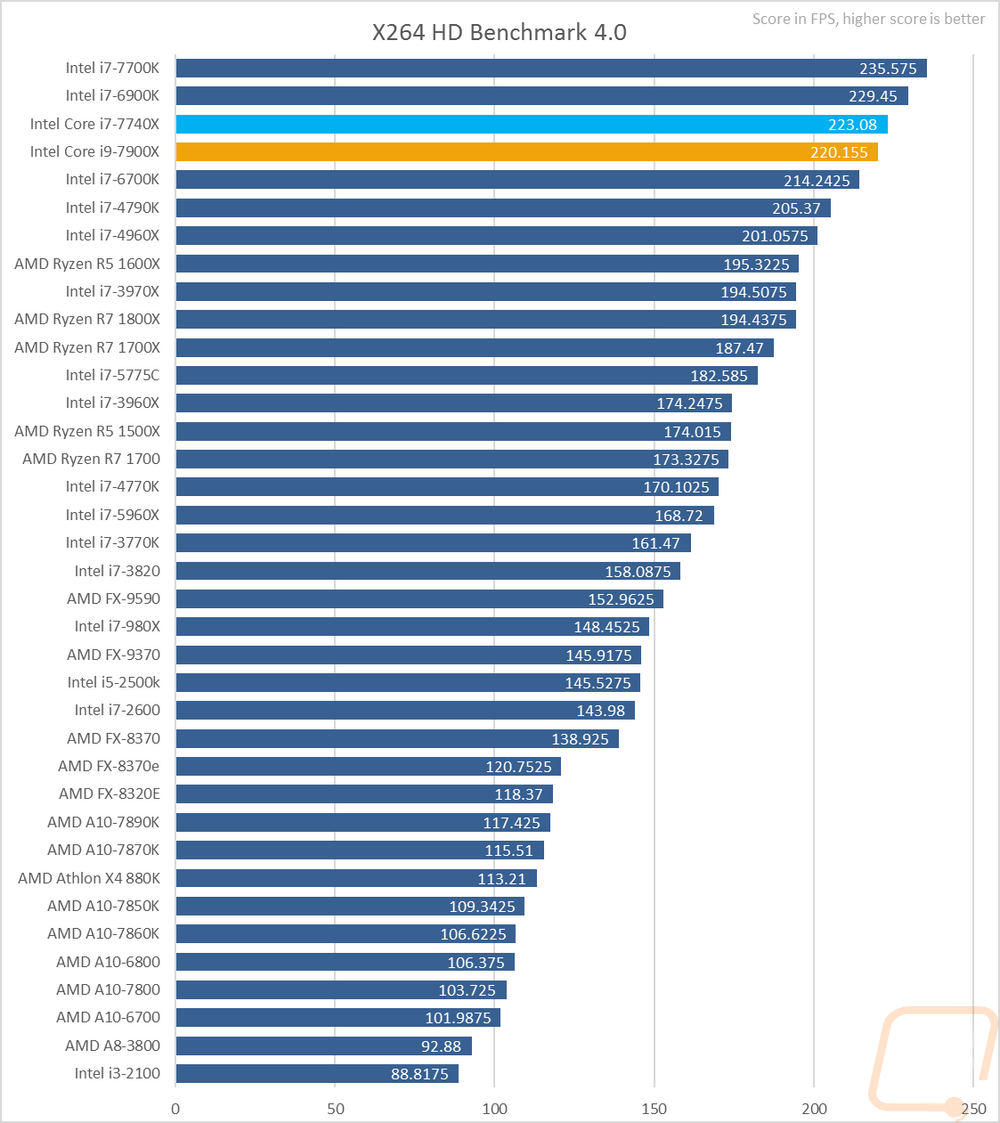
For the first test, I tested x264 encoding with the older but still solid x264 HD Benchmark 4.0. The results are in frames per second that the CPU could encode. The test is run four times then averaged out to give these results. The Kaby Lake based 7740X performed better here with the 7900X being just behind it. Both were well above the Ryzen CPUs but oddly enough the i7-6900K was also faster as well with the always extremely fast 7700K being the fastest.
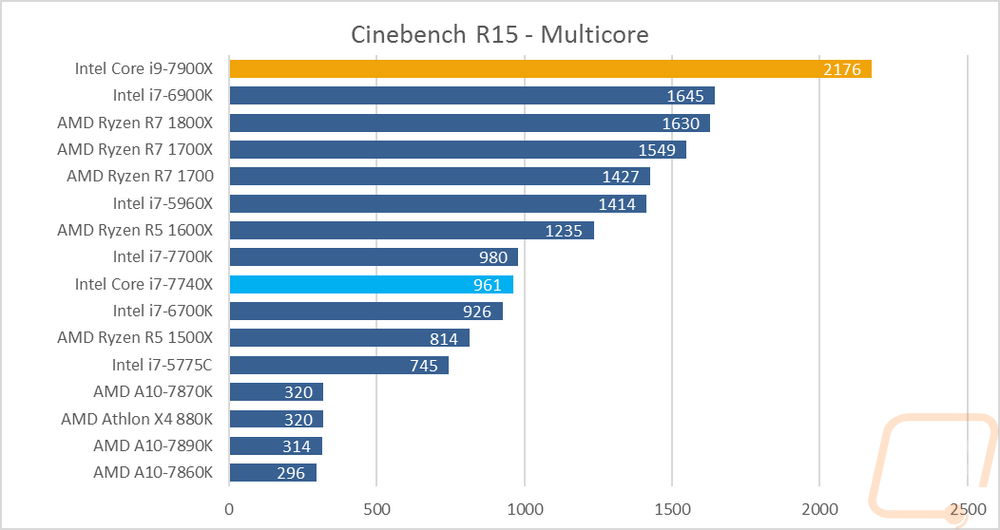
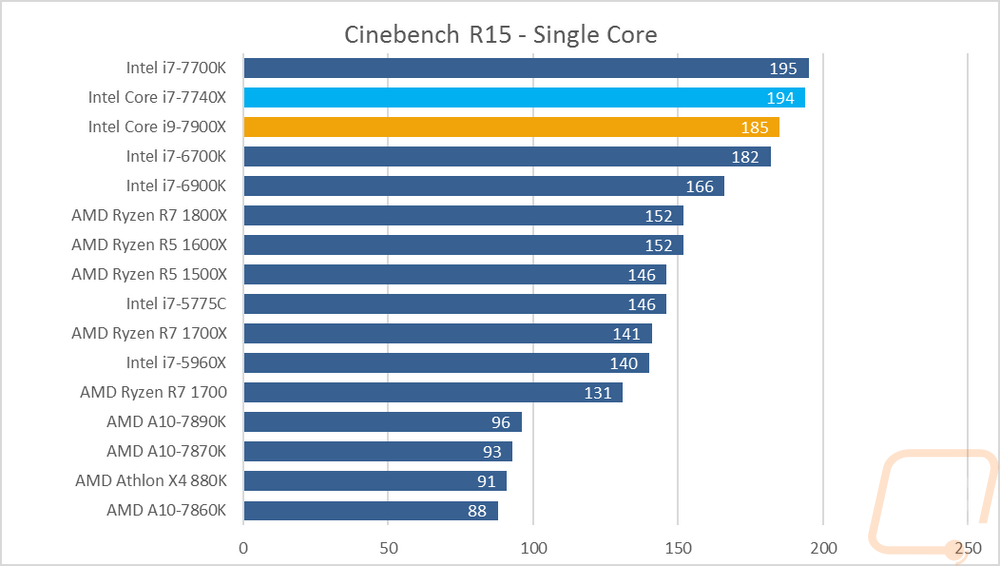
The next benchmark might be my favorite test out of all CPU benchmarks. Cinebench R15 is a compute benchmark so it doesn’t apply to everyone but I love it because it actually tests using all cores and then again with just one so we can see the total performance and IPC performance as well. I wish more tests did the same. So the 10 core i9-7900X just dominated in the multicore benchmark where it was able to take advantage of its additional cores. The i7-7740X, on the other hand, was back in the 4 core range with the i7-7700K. In the single core IPC test, the 7900X fell back a little with the two Kaby Lake CPUs at the top. The 7700K was still quicker than the 7740X just slightly. The 7900X did well still though with it having a single core score of 185, well above all of the Ryzen CPUs and the older Intel CPUs.
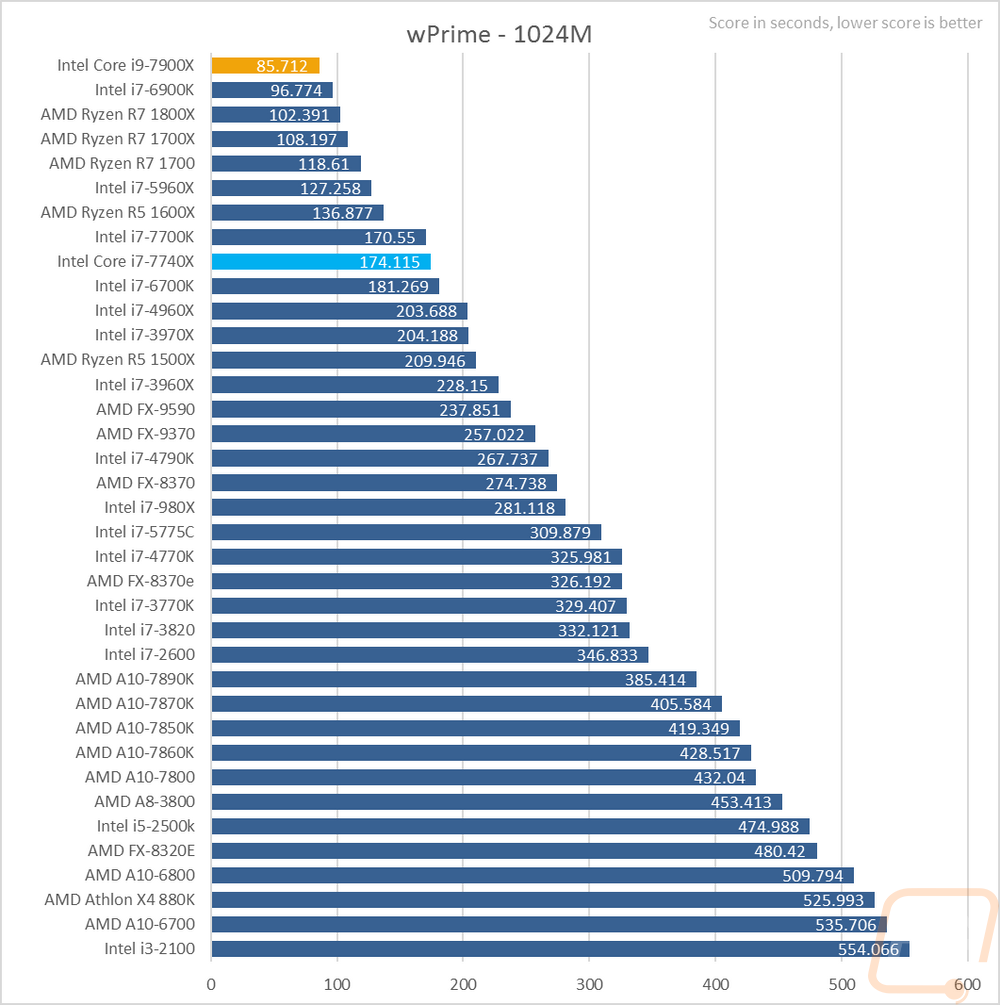
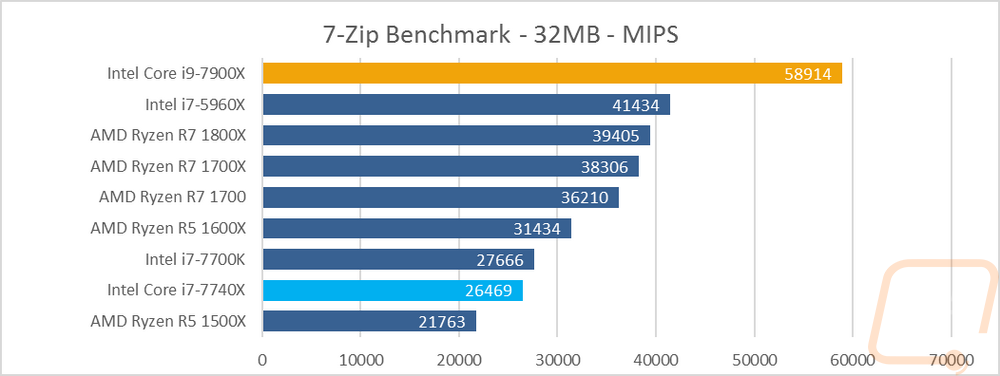
The next two benchmarks aren’t the same but both handle a similar area. wPrime tests prime number calculation speed and 7zip tests compression speed. In wPrime, the i9-7900X came out ahead with its good core speeds and a high number of cores total. The i7-7740X was again right below the i7-7700K and the Ryzen 7 CPUs and one of the Ryzen 5 CPUs were all in between. The result was exactly the same in 7-Zip where the i9-7900X wasn’t even in the same class as the other CPUs.
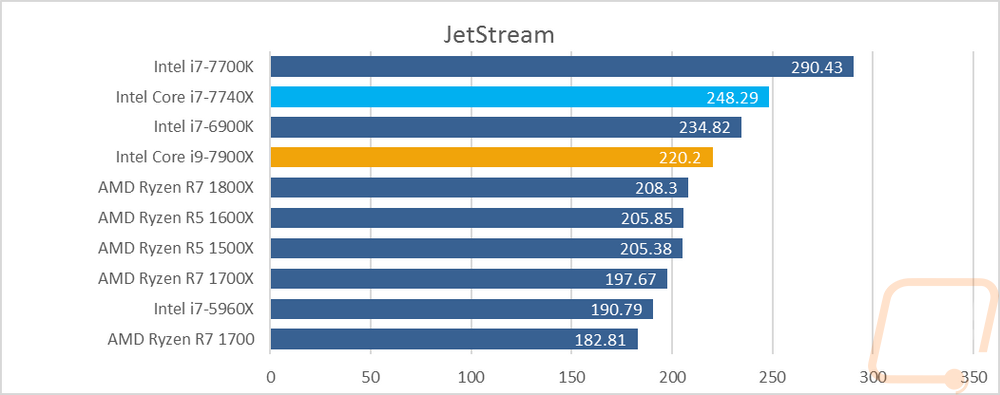
For browser benchmarks, I dropped our Google Octane benchmark because it is no longer being updated and the results were all over the place but I kept Jetstream. This test runs three times covering at least 30 tests then combines the tests for a score then averages the three results for one score. Here the Kaby Lake CPUs did well again with the i7-7700K and then the i7-7740X being at the top. I expected the i9-7900X to do well but was surprised that the i7-6900K still did better. None of the Ryzen CPUs were far off, but they were all bunched up with nearly the same results.
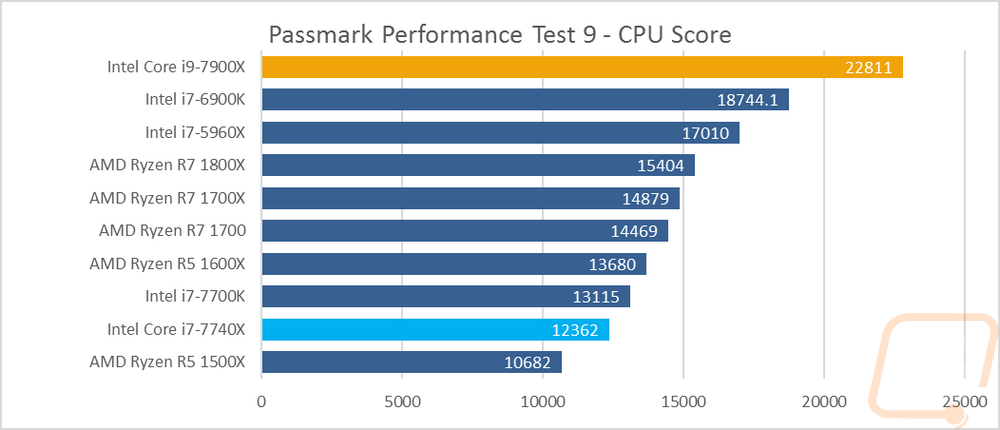
For more general CPU benchmarks I took a look at Passmark’s Performance Test 9 and ran their CPU score that runs a mix of CPU focused tests. Here once again the i9-7900X with its 10 cores and good IPC pulled well ahead with Intel’s other 8 core CPUs the next two behind it. Then you get the 8 core Ryzen CPUs. The i7-7740X and i7-7700K are down closer to the bottom with their low core counts.
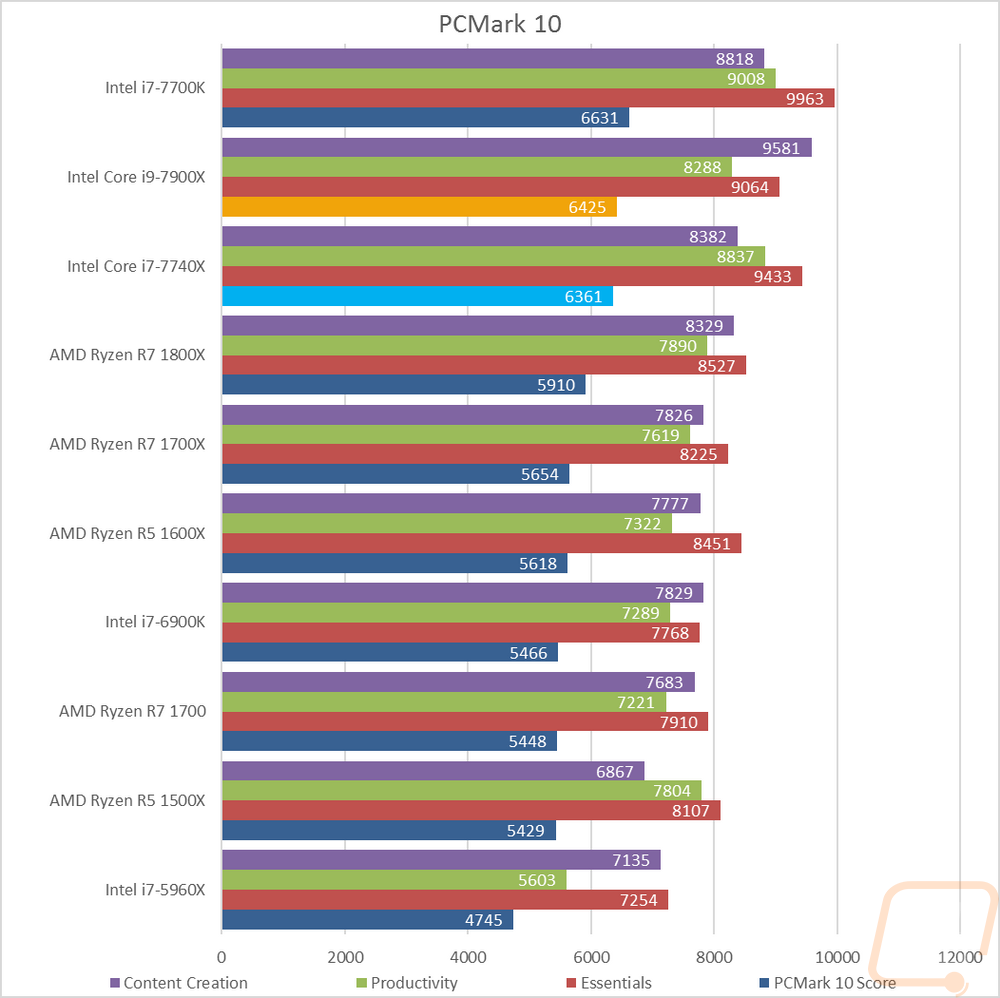
PCMark 10 covers a wider range of tests all focused on real world usages. The essentials tests are focused on web browsing, video conferencing, and app start-up times. The i7-7700K performed best here with the i7-7740X being next, then working down from there depending on single core performance. The productivity testing tested office applications like spreadsheet and writing workloads with similar scores to the essentials. Content creation, on the other hand, was more dependent on core counts. The tests focused on photo and video editing and rendering and visualization. In that test, the i9-7900X pulled ahead. Then last but not least, the overall PCMark score averages all of the tests out. The i7-7700K and i7-7740X did really well with the 7700K coming out at the top but the i9-7900X was able to edge up into second with just pure core count.
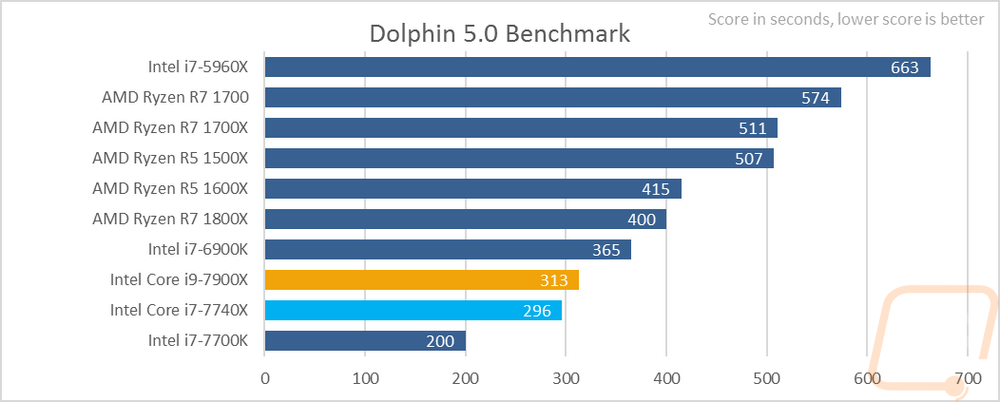
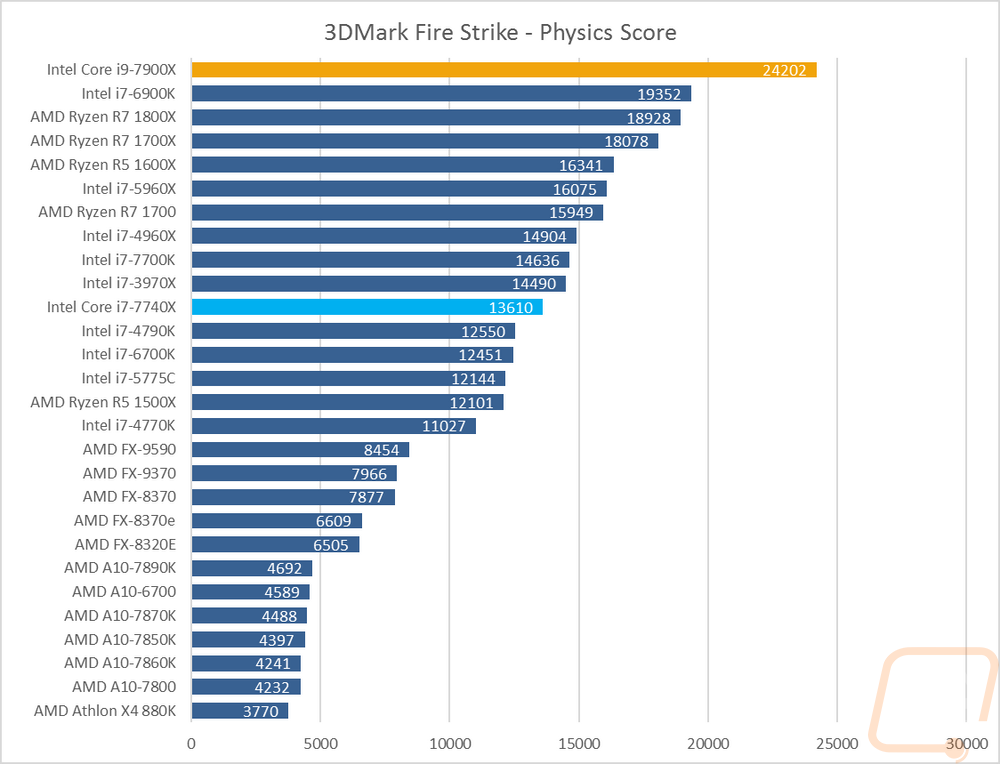
Before getting to actual gaming performance I took a look at 3DMark and Dolphin benchmark. 3DMark is a nice consistent synthetic benchmark and Dolphin tests out emulator performance that is very CPU dependent. In Dolphin, the lower the score the better and the high IPC of the i7-7700K put it at the fastest with the i7-7740X next. The i9-7900X wasn’t far behind though, surprisingly. In 3DMark I used the Fire Strike benchmark set to the 1080p equivalent performance setting. Once again the i9-7900X just stomped the physic scores with the 6900K and the 8 core Ryzen CPUs being next but not close. The i7-7740X was down much lower with the other mainstream CPUs.
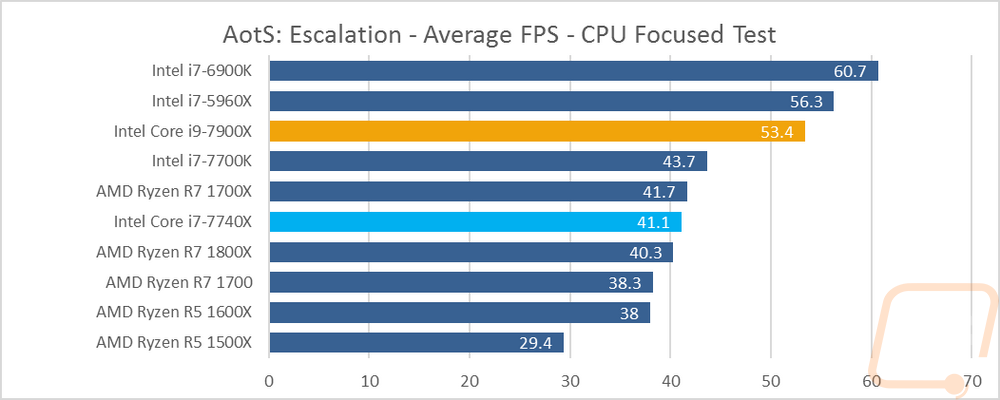
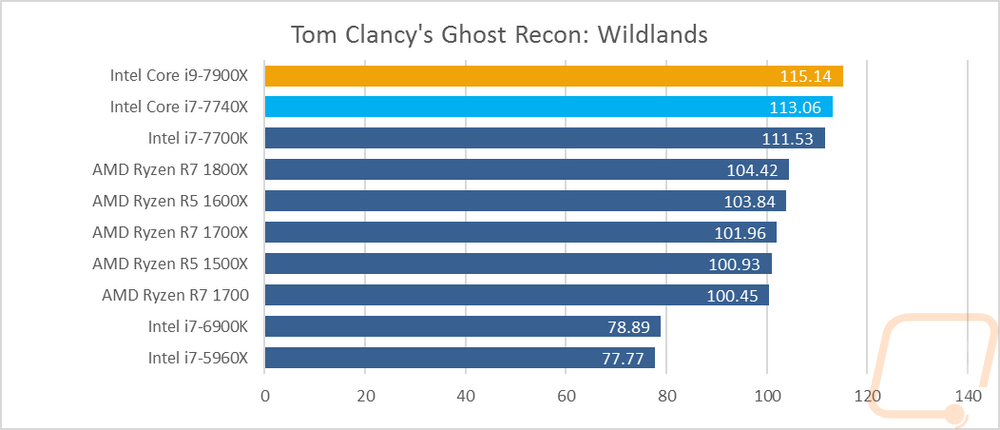
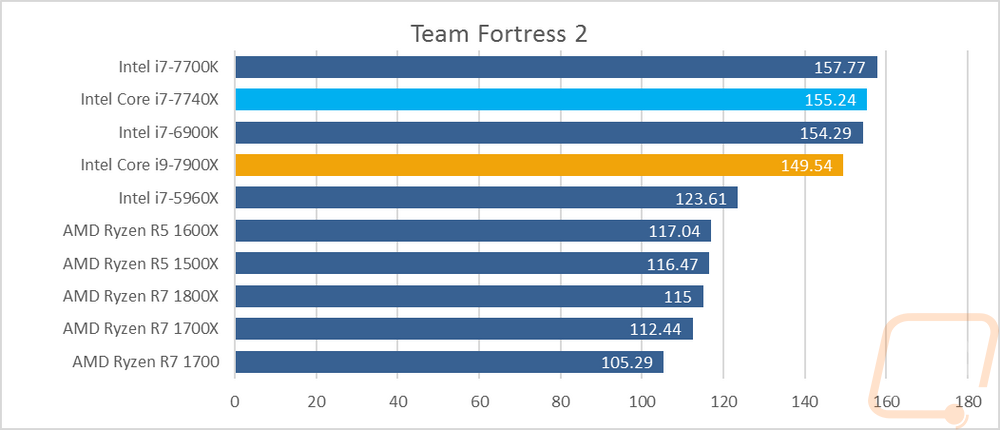
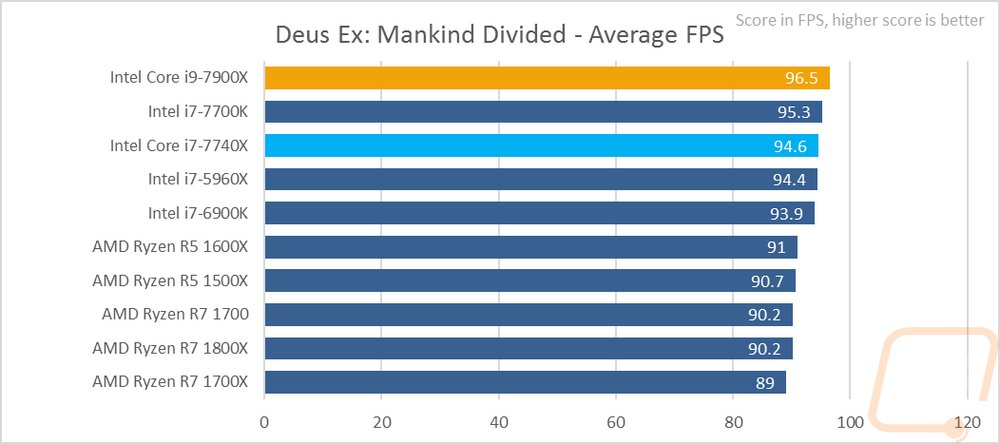
For in game testing I tested in four different games. I added Wildlands and TF2 that touch on popular games both new and old then we have the CPU specific Ashes of the Singularity: Escalation tests and Deus Ex: Mankind Divided as another newer game. Deus Ex and Wildlands are both GPU dependent games so the difference between CPUs (especially in Deus Ex) was very small. Wildlands does bring up potential issues with our X99 setup though that I will have to address. TF2 being an older game is very CPU limited and with it still being in the top 10 played games I was excited to add it to the charts. The results were a little off though, especially with the Ryzen results being flipped but that could just be a lack of high core count support. The 7700K and 7740X were up top with the higher core count CPUs below that. Then in Ashes of the Singularity, this was basically a best case scenario for Ryzen where I tested with faster memory in a game that is very Ryzen optimized but the high core count Intel’s still dominated here, even over the always fast i7-7700K.
The last set of performance testing was using AID64. Frankly, there was so much information that I wanted to show that I couldn’t fit it into any graph so I went with a basic table as you can see below. I wanted to show the memory read, write, and latency. This was especially interesting to check out with the quad channel memory on the i9-7900X and the dual channel for the i7-7740X. The i9 did have a higher latency but the bandwidth difference was huge. X299 has more memory bandwidth than past Intel quad channel setups as well though when compared to the X99 CPUs. Ryzen calls in between with more than Kaby Lake but less than Skylake-X. For Cache performance it is interesting to see that the i9-7900X was much faster with its L1 and L2 cache, especially compared to Ryzen but down in the L3 cache numbers it falls off but the 7740X didn’t. Single and Double precision performance favored the Intels but the AES-256 performance of the Ryzen CPUs was extremely impressive. Integer IOPS for the Intels across the board were also way ahead of Ryzen, especially the i9-7900X with almost 5 times the bandwidth at 24 and 32 bits.
|
CPU |
Memory Read |
Memory Write |
Memory Latency |
|
Intel Core i9-7900X |
76856 MB/s |
72856 MB/s |
72.8 ns |
|
Intel Core i7-7740X |
38455 MB/s |
40596 MB/s |
53.2 ns |
|
Intel i7-6900K |
66786 MB/s |
68130 MB/s |
61.9 ns |
|
Intel i7-7700K |
38498 MB/s |
40448 MB/s |
52.7 ns |
|
Intel i7-5960X |
66108 MB/s |
49545 MB/s |
62.8 ns |
|
AMD Ryzen R7 1800X |
44031 MB/s |
43425 MB/s |
81.8 ns |
|
AMD Ryzen R7 1700X |
44493 MB/s |
43749 MB/s |
78.3 ns |
|
AMD Ryzen R7 1700 |
45343 MB/s |
43777 MB/s |
82.6 ns |
|
AMD Ryzen R5 1600X |
44452 MB/s |
43918 MB/s |
83.7 ns |
|
AMD Ryzen R5 1500X |
44289 MB/s |
43746 MB/s |
83.1 ns |
|
|
L1 Cache Read |
L1 Cache Write |
L1 Cache Latency |
|
Intel Core i9-7900X |
2418.5 GB/s |
709.16 GB/s |
1.0 ns |
|
Intel Core i7-7740X |
1102.7 GB/s |
561.25 GB/s |
0.9 ns |
|
Intel i7-6900K |
1963.9 GB/s |
999.59 GB/s |
1.0 ns |
|
Intel i7-7700K |
1114.6 GB/s |
560.82 GB/s |
0.9 ns |
|
Intel i7-5960X |
1748.5 GB/s |
874.60 GB/s |
1.2 ns |
|
AMD Ryzen R7 1800X |
917.46 GB/s |
460.16 GB/s |
1.1 ns |
|
AMD Ryzen R7 1700X |
867.89 GB/s |
435.33 GB/s |
1.2 ns |
|
AMD Ryzen R7 1700 |
793.90 GB/s |
398.12 GB/s |
1.3 ns |
|
AMD Ryzen R5 1600X |
689.47 GB/s |
345.95 GB/s |
1.1 ns |
|
AMD Ryzen R5 1500X |
446.84 GB/s |
224.01 GB/s |
1.1 ns |
|
|
L2 Cache Read |
L2 Cache Write |
L2 Cache Latency |
|
Intel Core i9-7900X |
1037.3 GB/s |
521.94 GB/s |
5.2 ns |
|
Intel Core i7-7740X |
424.55 GB/s |
304.30 GB/s |
2.7 ns |
|
Intel i7-6900K |
710.28 GB/s |
310.34 GB/s |
4.1 ns |
|
Intel i7-7700K |
415.45 GB/s |
285.97 GB/s |
2.7 ns |
|
Intel i7-5960X |
623.08 GB/s |
272.77 GB/s |
3.5 ns |
|
AMD Ryzen R7 1800X |
831.95 GB/s |
446.37 GB/s |
4.7 ns |
|
AMD Ryzen R7 1700X |
809.29 GB/s |
419.38 GB/s |
5.0 ns |
|
AMD Ryzen R7 1700 |
742.92 GB/s |
389.73 GB/s |
5.4 ns |
|
AMD Ryzen R5 1600X |
630.99 GB/s |
334.93 GB/s |
4.7 ns |
|
AMD Ryzen R5 1500X |
306.82 GB/s |
211.58 GB/s |
11.8 ns |
|
|
L3 Cache Read |
L3 Cache Write |
L3 Cache Latency |
|
Intel Core i9-7900X |
124.16 GB/s |
106.78 GB/s |
21.2 ns |
|
Intel Core i7-7740X |
287.01 GB/s |
186.67 GB/s |
21.2 ns |
|
Intel i7-6900K |
243.96 GB/s |
195.41 GB/s |
14.6 ns |
|
Intel i7-7700K |
234.50 GB/s |
188.70 GB/s |
10.4 ns |
|
Intel i7-5960X |
260.72 GB/s |
184.92 GB/s |
15.3 ns |
|
AMD Ryzen R7 1800X |
388.18 GB/s |
386.01 GB/s |
12.4 ns |
|
AMD Ryzen R7 1700X |
369.75 GB/s |
350.31 GB/s |
12.9 ns |
|
AMD Ryzen R7 1700 |
334.36 GB/s |
332.12 GB/s |
14.2 ns |
|
AMD Ryzen R5 1600X |
386.48 GB/s |
326.86 GB/s |
12.3 ns |
|
AMD Ryzen R5 1500X |
306.82 GB/s |
211.58 GB/s |
11.8 ns |
|
|
Single-Precision FLOPS |
Double Precision FLOPS |
AES-256 |
|
Intel Core i9-7900X |
1148 GFLOPS |
574.5 GFLOPS |
45506 MB/s |
|
Intel Core i7-7740X |
575.4 GFLOPS |
287.8 GFLOPS |
20503 MB/s |
|
Intel i7-6900K |
1023 GFLOPS |
511.7 GFLOPS |
36340 MB/s |
|
Intel i7-7700K |
575.7 GFLOPS |
287.9 GFLOPS |
20519 MB/s |
|
Intel i7-5960X |
895.5 GFLOPS |
447.7 GFLOPS |
31783 MB/s |
|
AMD Ryzen R7 1800X |
472.4 GFLOPS |
236.2 GFLOPS |
64016 MB/s |
|
AMD Ryzen R7 1700X |
446.8 GFLOPS |
223.4 GFLOPS |
61730 MB/s |
|
AMD Ryzen R7 1700 |
408.5 GFLOPS |
204.3 GFLOPS |
56811 MB/s |
|
AMD Ryzen R5 1600X |
354.9 GFLOPS |
177.5 GFLOPS |
49340 MB/s |
|
AMD Ryzen R5 1500X |
229.8 GFLOPS |
114.8 GFLOPS |
31983 MB/s |
|
|
24-bit Integer IOPS |
32-bit Integer IOPS |
64-bit Integer IOPS |
|
Intel Core i9-7900X |
515.1 GIOPS |
515.0 GIOPS |
79.76 GIOPS |
|
Intel Core i7-7740X |
258.1 GIOPS |
258.0 GIOPS |
35.97 GIOPS |
|
Intel i7-6900K |
255.9 GIOPS |
255.9 GIOPS |
63.96 GIOPS |
|
Intel i7-7700K |
258.0 GIOPS |
258.0 GIOPS |
35.98 GIOPS |
|
Intel i7-5960X |
223.9 GIOPS |
223.9 GIOPS |
55.97 GIOPS |
|
AMD Ryzen R7 1800X |
118.1 GIOPS |
118.1 GIOPS |
59.03 GIOPS |
|
AMD Ryzen R7 1700X |
111.7 GIOPS |
111.7 GIOPS |
55.84 GIOPS |
|
AMD Ryzen R7 1700 |
102.1 GIOPS |
102.1 GIOPS |
51.05 GIOPS |
|
AMD Ryzen R5 1600X |
88.74 GIOPS |
88.73 GIOPS |
44.34 GIOPS |
|
AMD Ryzen R5 1500X |
57.43 GIOPS |
57.45 GIOPS |
28.72 GIOPS |
