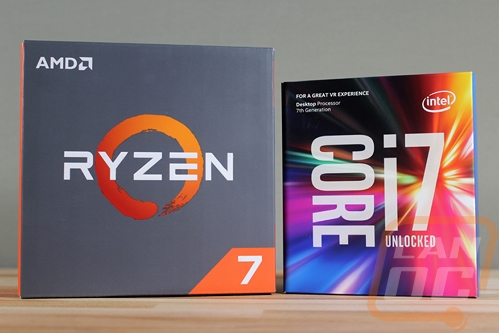
So at the Ryzen launch I took a look at the 1800X and the 1700X and compared them to the Intel i7-6900K and the i7-7700K and I followed that up with the Ryzen R7 1700. Well around that time Intel sent over the i7-7700K, the one I did my previous testing on was a loaner. So rather than cover everything everyone has already seen with the 7700K I wanted to change things up. I posted up on our Facebook asking people what they would like to see compared between the 7700K and the R7 1700 and I ended up with a list of games and someone also mentioned streaming performance. I decided to combine that list with all of the games we already test our video cards with and I put together a big list of games to check out. After a LOT of testing, I’m ready to finally sit down and check out the results. Are you guys ready? I know I am!
Title: Intel i7-7700K vs. AMD Ryzen R7 1700 in Gaming
Review Samples Provided by: Intel and AMD
Written by: Wes
Pictures by: Wes
Amazon Link: Intel i7-7700K – AMD Ryzen R7 1700
Test Rigs
When putting together both test configurations I didn’t have to stray from our standard test setups because they both already match. Both CPUs were running on similar Asus boards and while the memory kits aren’t the same they were both running at the same clock speeds. Beyond that, each CPU was set to stock speeds. The only thing I changed from my standard testbench was the switch to the GTX 1080 Ti to have the fastest single GPU possible. The overall setups are both very close to what people would be looking at when shopping for these CPUs, especially if gaming at higher resolutions.
|
AM4 Test System |
||
|
Motherboard |
Asus Crosshair VI Hero |
|
|
Cooling |
Noctua NH-U12S for cooling Noctua NT-H1 Thermal Paste |
|
|
Memory |
Corsair Vengeance LPX DDR4 2x8 16GB running at 2666MHz |
|
|
Storage |
Kingston HyperX 240GB SSD |
|
|
Video Card |
Nvidia GTX 1080 Ti |
|
|
Power Supply |
Thermaltake 850w |
|
|
Case |
Microcool Banchetto 101 Test bench |
|
|
OS |
Windows 10 Pro 64-bit |
|
|
Intel Z270 Test System |
||
|
Motherboard |
Asus Strix Z270E Gaming |
|
|
Cooling |
Noctua NH-U12S for cooling Noctua NT-H1 Thermal Paste |
|
|
Memory |
Kingston HyperX FURY DDR4 16GB kit 2666MHz |
|
|
Storage |
Kingston HyperX 240GB SSD |
|
|
Video Card |
Nvidia GTX 1080 Ti |
|
|
Power Supply |
Thermaltake 850w |
|
|
Case |
Microcool Banchetto 101 Test bench |
|
|
OS |
Windows 10 Pro 64-bit |
|
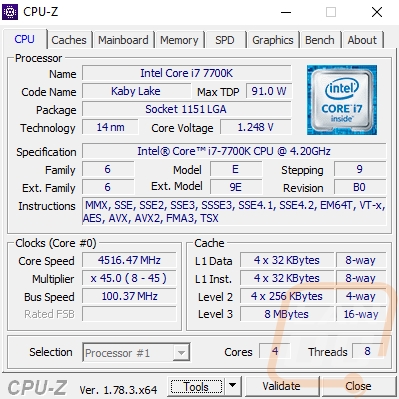
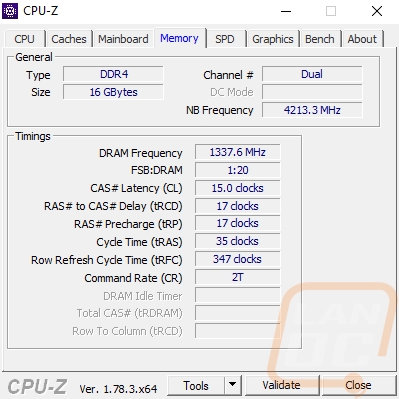
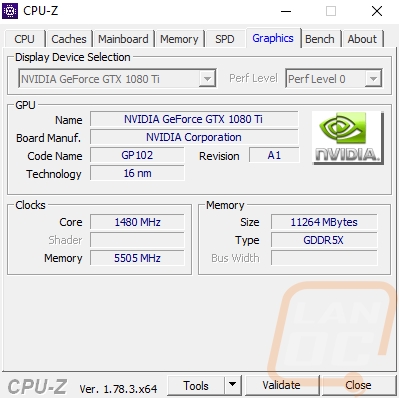
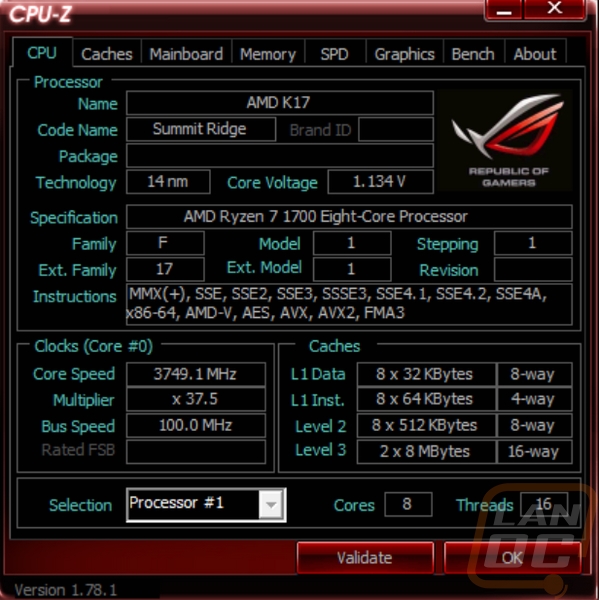
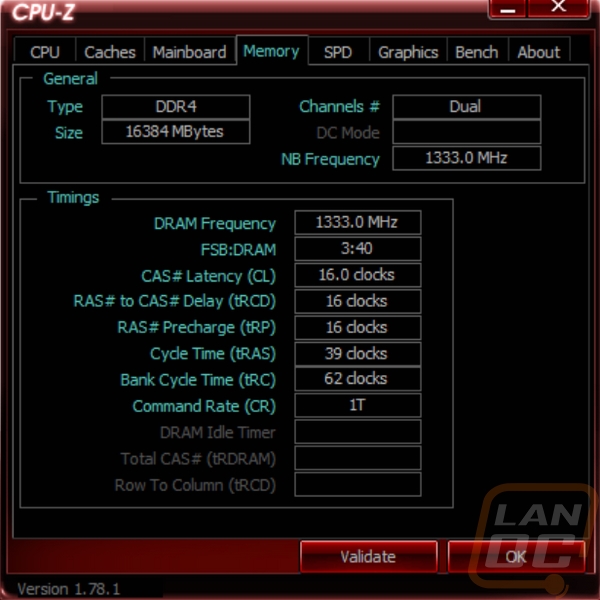
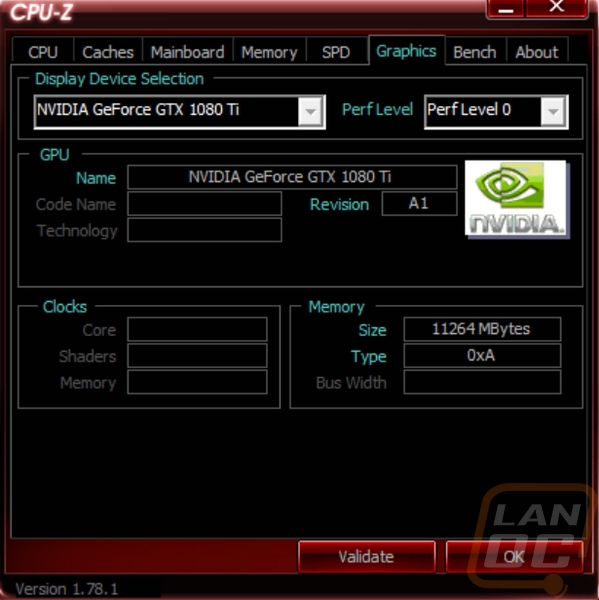
I’ve also included screenshots from CPUz from both configurations
Intel i7-7700K
AMD Ryzen R7 1700
Synthetic Benchmarks
As always, I started off my testing with a few Synthetic benchmarks. I did these just to round out the gaming-focused coverage and they are also typically very consistent. The benchmark I tested both CPUs with was Futuremark’s 3DMark. I tested in their Fire Strike benchmark using all three performance settings that cover 1080p, 1440p, and 4k performance and I also tested using Time Spy, a DX12 focused benchmark. Unlike our normal CPU or GPU reviews, I did include a whole range of results for a better comparison here. When I did my CPU benchmarks I only used the Physics scores and for GPUs, I use the graphics score. These results were interesting, though. In all three of the Fire Strike benchmarks the 7700K dominated in the overall scores. This was mostly because the combined scores where they test the CPU and GPU together the R7 1700 fell behind. The gap moving up in resolution got smaller until in the Ultra test the results were similar. Time Spy also had a similar overall score but the CPU score on the 1700 was actually higher, the DX12 benchmark must take better advantage of the additional cores.
|
3DMark |
Intel i7-7700K |
AMD Ryzen R7 1700 |
|
3DMark Fire Strike – Performance Setting |
||
|
Overall Score |
21011 |
16358 |
|
Graphics Score |
28642 |
23631 |
|
Physics Score |
14613 |
16797 |
|
Combined Score |
8974 |
4887 |
|
3DMark Fire Strike – Extreme Setting |
||
|
Overall Score |
12481 |
11663 |
|
Graphics Score |
13757 |
13430 |
|
Physics Score |
14513 |
16779 |
|
Combined Score |
6552 |
4773 |
|
3DMark Fire Strike – Ultra Setting |
||
|
Overall Score |
6670 |
6697 |
|
Graphics Score |
6725 |
6677 |
|
Physics Score |
14495 |
16797 |
|
Combined Score |
3566 |
3564 |
|
3DMark Time Spy |
||
|
Overall Score |
8405 |
8863 |
|
Graphics Score |
9186 |
9239 |
|
CPU Score |
5675 |
7203 |
Like in 3DMark, I tested Catzilla across three different resolutions and I once again left all of the different results rather than sticking with the overall score that I normally use. The overall score on the 1080p result was just mind blowing how far ahead the 7700K was with it outperforming in nearly every category. Like before the gap does get smaller at 1440p and at 4k the two CPUs are nearly the same. In the CPU-focused test the 7700K does still have a lead as well as the GPU and CPU combined test, but at 4k the GPU is the main limitation, not the CPU.
|
Catzilla |
Intel i7-7700K |
AMD Ryzen R7 1700 |
|
Catzilla – 1080p |
||
|
Score |
34101 |
23015 |
|
Hardware (GPU+CPU) |
33136 |
22193 |
|
Physics Test (CPU) |
2045 |
1184 |
|
Fur Test (GPU) |
2378 |
1743 |
|
Fluid Test (GPU) |
1828 |
1536 |
|
Raymarch Test (GPU) |
1001 |
1011 |
|
Loading Time (ms) |
6133 |
6707 |
|
Catzilla – 1440p |
||
|
Score |
19714 |
16097 |
|
Hardware (GPU+CPU) |
19080 |
15510 |
|
Physics Test (CPU) |
1698 |
1119 |
|
Fur Test (GPU) |
1321 |
1219 |
|
Fluid Test (GPU) |
1208 |
1156 |
|
Raymarch Test (GPU) |
570 |
576 |
|
Loading Time (ms) |
6165 |
6722 |
|
Catzilla – 4k |
||
|
Score |
9942 |
9728 |
|
Hardware (GPU+CPU) |
9771 |
9431 |
|
Physics Test (CPU) |
997 |
807 |
|
Fur Test (GPU) |
660 |
656 |
|
Fluid Test (GPU) |
667 |
660 |
|
Raymarch Test (GPU) |
268 |
276 |
|
Loading Time (ms) |
10974 |
6799 |
For the last synthetic, I went back to Futuremark but this time for their new VRMark benchmark. This test takes a look at VR performance in two different tests. The Orange room benchmark is a good representation of most of today's VR titles and the Blue room is a future looking benchmark that shows what kind of power would be needed to get the detailed graphics we see in today's normal video games but in a full VR environment. In the Orange room benchmark the GTZ 1080 Ti wasn’t really the limitation and the end result was just over a 75 FPS gap in performance with the 7700K and its higher IPC and lower core count winning. In the Blue Room, the test is much more demanding and the GTX 1080 Ti is a limitation and the results end up being almost exactly the same.
|
VRMark |
Intel i7-7700K |
AMD Ryzen R7 1700 |
|
VRMark Orange Room |
||
|
Score |
11898 |
8415 |
|
Average Frame Rate |
259.37 |
183.46 |
|
VRMark Blue Room |
||
|
Score |
3024 |
3004 |
|
Average Frame Rate |
65.93 |
65.48 |
In Game Performance
So the main idea with this article was to take a more detailed look at gaming performance, in our CPU review of Ryzen there were some concerns about lower in game performance when compared to the 7700K. I only tested with three games and our testbench was running an RX480, while a very good card, it wasn’t really on par with what a lot of people might be getting with high-end CPUs. So below I have tested our entire video card test suite along with a stack of other requested games including a few of the most popular eSports titles. The idea is to both get a better look at the performance between both CPUs and to also see if the performance differences make any difference. It’s going to be a lot to get through though so hang on.
For my first test, I tested in DOOM. Most of our tests are using built in benchmarks but DOOM is on of the few games that doesn’t have one and doing an average run using Fraps wasn’t possible as well so I tested in the opening room facing the altar as there are a lot of effects going on while still being repeatable (after killing the monsters in the room). I tested at all three resolutions with the detail on ultra and running on Vulkan. The end result of all of that testing was a little anti-climatic with both CPUs ending up with the exact same FPS across the board.
|
DOOM |
Intel i7-7700K |
AMD Ryzen R7 1700 |
|
1080p |
200 |
200 |
|
1440p |
171 |
171 |
|
4k |
84 |
84 |
Next, I went right for Ashes of the Singularity, a benchmark that brings just about every video card to its knees and that also showed huge gaps between the CPUs in my initial testing. The developer was also one of a few quoted talking about future patches to increase Ryzen performance. I tested using the built-in benchmark at the Crazy setting for detail in DX12 mode. I used both the GPU and CPU-focused benchmarks on taking a look at the differences as well. So what was the end result? Well, they obviously haven’t patched for that extra performance because at both 1080p and 1440p the 7700K had a huge performance gap and even at 4k there was 5 FPS. The Ryzen CPU did still manage to get 60 FPS at 1080p and 1440p so it isn’t going to break the game for anyone running a 1080Ti, but it does seem crazy to leave that extra performance on the table.
|
Ashes of the Singularity |
Intel i7-7700K |
AMD Ryzen R7 1700 |
|
GPU Focused Benchmark |
||
|
1080p |
||
|
Average Framerate |
83.6 |
64.0 |
|
Average CPU Framerate |
101.5 |
64.0 |
|
1440p |
||
|
Average Framerate |
69.7 |
60.4 |
|
Average CPU Framerate |
108.0 |
62.3 |
|
4K |
||
|
Average Framerate |
57.4 |
53.2 |
|
Average CPU Framerate |
109.2 |
60.9 |
|
CPU Focused Benchmark |
||
|
1080p |
||
|
Average Framerate |
40.6 |
31.6 |
|
Average CPU Framerate |
40.6 |
31.6 |
|
1440p |
||
|
Average Framerate |
40.3 |
31.7 |
|
Average CPU Framerate |
40.3 |
31.6 |
|
4K |
||
|
Average Framerate |
40.4 |
31.1 |
|
Average CPU Framerate |
41.0 |
31.1 |
For Sniper Elite 3 I tested using the in game benchmark using the Ultra quality setting. This is a perfect example of a very CPU limited game when running the 1080 Ti at 1080p and the 7700K did what it has done in the other tests as well and performed well across all three resolutions. At 4k the two CPUs had similar results with the R7 1700 even having a higher peak FPS.
|
Sniper Elite 3 |
Intel i7-7700K |
AMD Ryzen R7 1700 |
|
1080p |
||
|
Average FPS |
237.3 |
204.8 |
|
Maximum FPS |
751.3 |
522.4 |
|
1440p |
||
|
Average FPS |
184.3 |
173.5 |
|
Maximum FPS |
599.3 |
491.7 |
|
4k |
||
|
Average FPS |
118.2 |
117.3 |
|
Maximum FPS |
195.1 |
216.9 |
For Sniper Elite 4, my most recently beat game I didn’t have an in game benchmark to use so I tested in the first map San Celini Island to make it easy for anyone to get to. Testing from the spawn location. There will be more demanding areas in the game without a doubt, but to keep it easy to replicate this is the area I went with. I tested at Ultra detail again. The end result had the R7 1700 with its first FPS lead at 1080p and the other two results matched.
|
Sniper Elite 4 |
Intel i7-7700K |
AMD Ryzen R7 1700 |
|
1080p |
148 |
152 |
|
1440p |
120 |
120 |
|
4k |
73 |
75 |
For Middle-Earth, I tested using the built-in benchmark at Ultra for the detail. I couldn’t test at all three of our test resolutions, though. It would only let me scale down to 1440p or test at 4k, a result I always have. None of the other optional resolutions were close. As for the results they were closer with just about 10 FPS on both results with the 7700K taking both resolutions.
|
Middle-earth: Shadow of Mordor |
Intel i7-7700K |
AMD Ryzen R7 1700 |
|
1440p |
||
|
Average FPS |
145.08 |
135.80 |
|
Maximum FPS |
316.04 |
221.31 |
|
Minimum FPS |
59.12 |
69.72 |
|
4k |
||
|
Average FPS |
84.02 |
76.10 |
|
Maximum FPS |
118.58 |
124.03 |
|
Minimum FPS |
60.10 |
52.82 |
For Total War: ROME II I set the detail to Ultra and then tested at all three resolutions using the built-in benchmark on the forest test. At 1080p and 1440p the 7700K ran away with it with a 40 FPS lead in both and 10 FPS at 4k.
|
Total War: ROME II |
Intel i7-7700K |
AMD Ryzen R7 1700 |
|
1080p |
155.1 |
109.4 |
|
1440p |
142.1 |
101.3 |
|
4k |
92.2 |
82.6 |
For Tomb Raider, Laura Craft helped me test both of the CPUs with the built in benchmark. I had the settings set to Very High and I turned v-sync off as well. What I found was the game was playable at all three resolutions but in all three the 7700K did perform better, especially at 1080p where it had an extra 30 FPS. Not that you need to worry about FPS gaps when you are running at 200+ FPS.
|
Tomb Raider |
Intel i7-7700K |
AMD Ryzen R7 1700 |
|
1080p |
||
|
Average FPS |
231.3 |
200.7 |
|
Maximum FPS |
300 |
284.0 |
|
Minimum FPS |
194 |
126.0 |
|
1440p |
||
|
Average FPS |
173.2 |
131.6 |
|
Maximum FPS |
194 |
172.0 |
|
Minimum FPS |
146 |
106.0 |
|
4k |
||
|
Average FPS |
94.3 |
77.0 |
|
Maximum FPS |
116 |
96.0 |
|
Minimum FPS |
88 |
66.0 |
Deus Ex: Mankind Divided was tested at all three resolutions using the in game benchmark. I set the detail to Ultra and let it run. In all three resolutions, the two CPUs came in surprisingly close to each other.
|
Deus Ex: Mankind Divided |
Intel i7-7700K |
AMD Ryzen R7 1700 |
|
1080p |
||
|
Average FPS |
91.7 |
89.8 |
|
Maximum FPS |
70.4 |
66.4 |
|
Minimum FPS |
117.1 |
118.8 |
|
1440p |
||
|
Average FPS |
65.8 |
63.5 |
|
Maximum FPS |
50.9 |
47.4 |
|
Minimum FPS |
82.5 |
79.6 |
|
4k |
||
|
Average FPS |
37.3 |
35.6 |
|
Maximum FPS |
26.4 |
24.4 |
|
Minimum FPS |
46.7 |
45.9 |
The new Hitman was also tested using the built-in benchmark tool. I tested in DX12 with detail at Ultra. The two CPUs were close at 4k where the GTX 1080 Ti was the limitation but as the FPS dropped the gap between the two opened up with it being as wide as 50 FPS at 1080p. The FPS lows were surprisingly low in all of the tests but even there the 7700K had an advantage.
|
HITMAN |
Intel i7-7700K |
AMD Ryzen R7 1700 |
|
1080p |
||
|
Average FPS |
149.03 |
97.21 |
|
Maximum FPS |
351.79 |
255.26 |
|
Minimum FPS |
4.19 |
2.56 |
|
1440p |
||
|
Average FPS |
128.80 |
98.79 |
|
Maximum FPS |
376.84 |
232.43 |
|
Minimum FPS |
11.64 |
7.37 |
|
4k |
||
|
Average FPS |
77.11 |
74.64 |
|
Maximum FPS |
222.03 |
151.19 |
|
Minimum FPS |
9.98 |
6.76 |
I tested Thief on the Very High-quality setting with v-sync turned off to prevent any FPS caps. I tested using the built-in benchmark at all three resolutions. What I found was more of the same really. At 1080p and 1440p the 7700K stomped the 1700 and at 4k where the GPU was the limitation, the gap was much closer but still in the 7700K’s favor.
|
Thief |
Intel i7-7700K |
AMD Ryzen R7 1700 |
|
1080p |
||
|
Average FPS |
141.2 |
105.2 |
|
Maximum FPS |
198.0 |
198.0 |
|
Minimum FPS |
97.6 |
66.0 |
|
1440p |
||
|
Average FPS |
120.1 |
97.7 |
|
Maximum FPS |
164.2 |
129.4 |
|
Minimum FPS |
99.0 |
67.6 |
|
4k |
||
|
Average FPS |
70.3 |
65.0 |
|
Maximum FPS |
101.0 |
89.6 |
|
Minimum FPS |
59.4 |
53.7 |
Getting into the popular eSports titles that I don’t normally get to test because of how often they update I took a look at DOTA 2. For this test, without a repeatable benchmark, I tested by going to mid and getting average numbers when CSing early in the game. This does mean that you can expect lower numbers when getting into fights, but repeatable numbers were the most important goal. Setting your video settings to match is a little tougher. You have to set the detail to best looking then go to advanced to turn everything from auto to high. You have to force your resolution not let it run on auto as well. The result was impressive numbers across all three resolutions with the 7700K unsurprisingly being faster in all three.
|
DOTA2 |
Intel i7-7700K |
AMD Ryzen R7 1700 |
|
1080p |
193 |
168 |
|
1440p |
181 |
161 |
|
4k |
179 |
147 |
CS:GO is another eSports title that runs great on everything and again there isn’t a built-in benchmark. So I tested with the following setup. Everything set to the highest detail, not auto. I tested offline with a bot match on the Cache Map for repeatability. These were the averages on a 30 second run through the map. The 7700K had a lead at all three resolutions, but unless you are planning on running on a 240hz monitor both results were more than you should need for FPS.
|
CS:GO |
Intel i7-7700K |
AMD Ryzen R7 1700 |
|
1080p |
263 |
230 |
|
1440p |
242 |
210 |
|
4k |
208 |
184 |
In Rocket League I was surprised to find out there is no support for 4k on the PC. For this test, I set the texture quality to high and the detail setting to high as well and tested at the two resolutions it would let me test at. I turned the max FPS all the way up. I did a bot soccer match in DFH Stadium and backed into the corner of the map and ran a 30 second average with the whole map in full view. The R7 1700 came out a little ahead at 1440p and both were on par at 1080p.
|
Rocket League |
Intel i7-7700K |
AMD Ryzen R7 1700 |
|
1080p |
209 |
206 |
|
1440p |
166 |
176 |
For League of Legends, I had a little trouble at first getting consistent results. I tested a very high detail with no v-sync and no FPS cap on Summoners Rift. I went mid using Caitlin each time and my original test was to push the lane into the tower to get at least some effects in the test. I had trouble replicating this after the first way so I actually had to start a new game for each resolution to get consistent results. What I found was a huge FPS gap between the CPUs though like I have mentioned before with FPS this high it’s not really noticeable in actual gameplay. But 89 FPS at 1080p, 88 at 1440p, and 73 FPS at 4k are all huge. Some people aren’t even getting that FPS at all and the R7 1700 is leaving that much on the table.
|
League of Legends |
Intel i7-7700K |
AMD Ryzen R7 1700 |
|
1080p |
295 |
206 |
|
1440p |
274 |
186 |
|
4k |
249 |
176 |
For the last eSports title, I took a look at Overwatch. Once again there wasn’t a built-in benchmark and once again you have to be extra careful on the video settings. In fact, I ran through my results the first time and was baffled that they were all the same. What I found is that you have to set render scale to 100% or it will auto change your resolution for you. With that set, I turned the frame cap to 300 and set the quality to Ultra. I used the Hanamura map using an Arcade custom game with bots and did a 30-second average when running through the map. The results ended up being about the same with 4k even hitting an FPS that would be good with a high refresh rate monitor.
|
Overwatch |
Intel i7-7700K |
AMD Ryzen R7 1700 |
|
1080p |
236 |
223 |
|
1440p |
210 |
186 |
|
4k |
121 |
120 |
Back into normal titles, I tested in The Division using the built-in benchmark. I ran all three resolutions at the Ultra setting and was careful to turn off the v-sync option that likes to switch to auto when on ultra. Here once again the results were actually really close between the two CPUs. Intel had a 8 FPS lead at 1080p and 3 at 1440p but AMD pulled ahead by a touch at 4k.
|
The Division |
Intel i7-7700K |
AMD Ryzen R7 1700 |
|
1080p |
126.1 |
118.6 |
|
1440p |
91.0 |
88.8 |
|
4k |
52.8 |
53.3 |
Battlefield 1 is another game that was mentioned in our request post and it does not have a built-in benchmark. I used Fraps and did a 30-second average in the first level when you are getting bombed and fired on. I set the resolution to all three of our popular resolutions and tested on the ultra-quality preset. The framerate limiter was set to 200 and v-sync was turned off. At 1080p the 7700K outperformed but the gap at 1440p and 4k wasn’t as big.
|
Battlefield 1 |
Intel i7-7700K |
AMD Ryzen R7 1700 |
|
1080p |
180 |
151 |
|
1440p |
151 |
146 |
|
4k |
86 |
84 |
For my last benchmark, I went with one I recently did a lot of video card testing on in a recent post. Wildlands has a built-in benchmark so I went with that and I ran fullscreen at Ultra detail. This benchmark specifically shows CPU usage and it rarely ever gets past 35% so I wasn’t surprised when the results were really close together. It is a GPU limited game, but there did still end up being an FPS lead for the 7700K in all three benchmarks.
|
Ghost Recon Wildlands |
Intel i7-7700K |
AMD Ryzen R7 1700 |
|
1080p |
70.77 |
67.18 |
|
1440p |
58.56 |
54.81 |
|
4k |
37.17 |
35.35 |
Game Performance While Streaming
So one of the requests I had when asking people what I should take a look at when comparing the i7-7700K and the R7 1700 was streaming performance. This is an aspect that I don’t think most people have ever considered. Well at least until AMD used it as a specific way to compare Ryzen to Intel in their demos. So I was really interested in seeing how this one worked out. I wasn’t really sure how to go about it so I picked out a few different benchmarks. I went with 3DMark Fire strike as a synthetic then for in game I went with two games that I play, League of Legends and Ghost Recon Wildlands. League was important because it is one of the most popular streamed games on Twitch every day and I went with Wildlands because it is an example of a new highly demanding game.
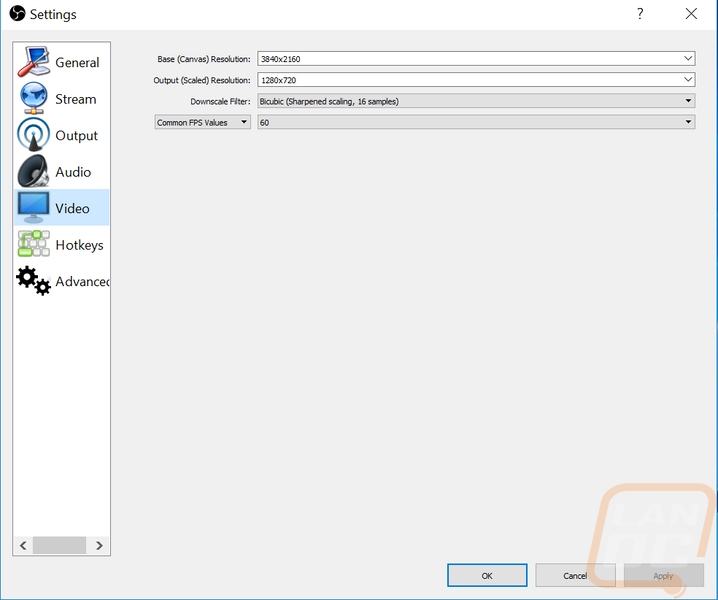
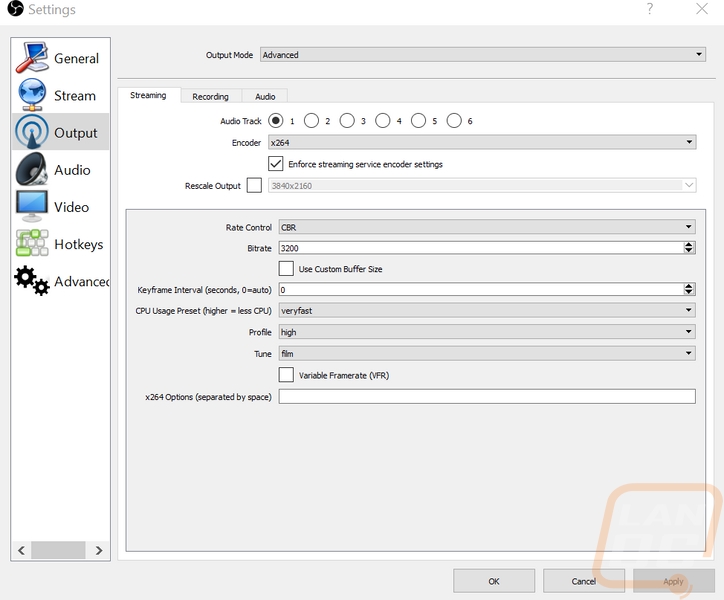
For streaming, I went with OBS as it is popular and it is what I’ve used in the past. I then dove into settings. I was running on a 4k monitor so I needed to scale things down and 720p is a popular resolution for streams and I set the FPS to a smooth 60 FPS. So we have to downscale from 4k all the way down to 720p. For the bitrate I ran 3200 as it is what my home internet is known to take without issues, I would have preferred to go a little higher, though. I kept CPU usage at the stock “veryfast” preset where AMD changed this for their demo and I use the high profile and film tune.
Even before gaming, I did notice that the CPU usage of OBS down on the bottom edge with the other stats showed 6% CPU usage on the 7700K and 3.5-4% on the R7 1700. The extra core count on the Ryzen CPU means the same amount of usage uses a smaller percentage of usage. I noted this though for reference to see just how much demand streaming is using.
|
|
Intel i7-7700K |
AMD Ryzen R7 1700 |
|
CPU Usage |
6% |
4% |
I then started with my two in game benchmarks and when we look at the numbers next to each other it's really clear that the performance gap that the 7700K gets even before streaming still help it stay ahead of the 8 core R7 1700. League was still playable on a 144hz monitor even at 4k on the R7 1700 but the performance gap for the 7700K was still large. The gap between the Wildlands results was a lot less, especially at 4k. That said if we want to stream at 60 FPS 1080p was really the only good option here.
|
Streaming Performance |
Intel i7-7700K |
AMD Ryzen R7 1700 |
|
Ghost Recon Wildlands |
||
|
1080p |
69.63 |
62.12 |
|
1440p |
57.08 |
52.62 |
|
4k |
36.57 |
34.56 |
|
League of Legends |
||
|
1080p |
244 |
181 |
|
1440p |
238 |
172 |
|
4k |
218 |
163 |
I then ran through all three Fire Strike benchmarks while streaming as well. The overall scores were once again relatively close together with the Combined Scores being the main deciding factor. At 4k on the Ultra setting the R7 1700 did pull ahead, though, just like it did when not streaming.
|
3DMark while streaming |
Intel i7-7700K |
AMD Ryzen R7 1700 |
|
3DMark Fire Strike – Performance Setting |
||
|
Overall Score |
17988 |
15994 |
|
Graphics Score |
23300 |
22696 |
|
Physics Score |
13622 |
16045 |
|
Combined Score |
8071 |
4968 |
|
3DMark Fire Strike – Extreme Setting |
||
|
Overall Score |
11701 |
11054 |
|
Graphics Score |
12893 |
12816 |
|
Physics Score |
13518 |
16060 |
|
Combined Score |
6176 |
4425 |
|
3DMark Fire Strike – Ultra Setting |
||
|
Overall Score |
6396 |
6470 |
|
Graphics Score |
6436 |
6435 |
|
Physics Score |
13522 |
15977 |
|
Combined Score |
3484 |
3495 |
The above results were interesting, but they only showed the performance gap between the 7700K and the R7 1700, they didn’t show us what kind of performance drop you can expect in your games when streaming. So I went through and put together the percentage change results for all of the results using the original 3DMark results from earlier as the reference. Now here I was extremely surprised to see that the numbers looked completely different. While the 7700K still gave better performance, the extra cores of the R7 1700 made for a significantly lower drop in performance when streaming. In the Combined Score at 1080 it even improved, that one still baffles me but it was repeated.
|
3DMark performance drop % |
Intel i7-7700K |
AMD Ryzen R7 1700 |
|
3DMark Fire Strike – Performance Setting |
||
|
Overall Score |
-14.39% |
-2.23% |
|
Graphics Score |
-18.65% |
-3.96% |
|
Physics Score |
-6.78% |
-4.48% |
|
Combined Score |
-10.06% |
1.66% |
|
3DMark Fire Strike – Extreme Setting |
||
|
Overall Score |
-6.25% |
-5.22% |
|
Graphics Score |
-6.28% |
-4.57% |
|
Physics Score |
-6.86% |
-4.29% |
|
Combined Score |
-5.74% |
-7.29% |
|
3DMark Fire Strike – Ultra Setting |
||
|
Overall Score |
-4.11% |
-3.39% |
|
Graphics Score |
-4.30% |
-3.62% |
|
Physics Score |
-6.71% |
-4.88% |
|
Combined Score |
-2.30% |
-1.94% |
Conclusion
Well, I set out to take a more in-depth look at gaming performance between the two similarly priced CPUs compared to the lowly three games tested in our CPU reviews and I can say without a doubt that I did that. I spent two days getting games downloaded on both test benches and another two full days of just benchmarking and documenting. That doesn’t even count the insanity of trying to get all of the results together in a readable format. There are a lot of numbers and even right now my eyes are still burning from looking at them all but I hope they help.
So what did we learn? Well in my initial Ryzen review and in the follow up with the R7 1700 I found that they were extremely capable in just about anything you throw at them but when it came to gaming the higher IPC (Instructions per cycle) of the Kaby Lake i7-7700K helped it perform better in games. So I tested again with 18 games and added in 4k and 1440p to get a better look at what to expect. The end result, well not every game performs badly on Ryzen and even when I say bad it's only relative to the i7-7700K’s performance. Both CPUs are going to be enough when paired with a great video card like the GTX 1080 Ti to play anything. That said there are still big gaps in performance in a surprising number of titles including some of the most popular games on the market.
You are left with the decision to pick from raw gaming performance with the 7700K or good gaming performance with better performance in encoding and other production tasks. Really, it's almost like deciding if you want to go with Peter Pan and be a kid forever or make sacrifices in your gaming performance by being an adult.
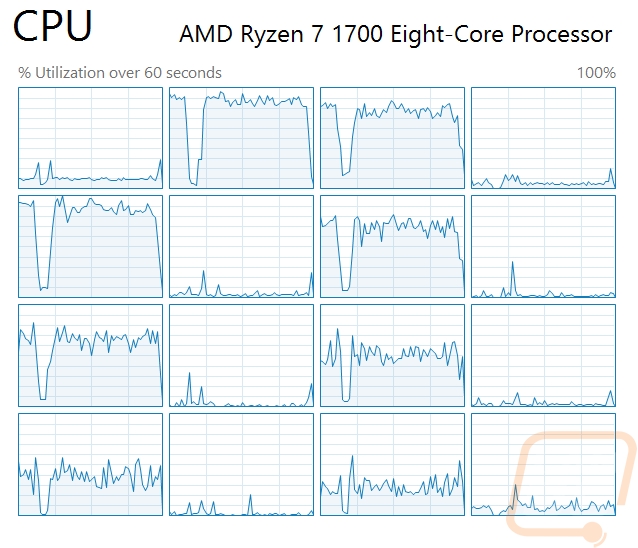
Now Ryzen performance is very likely to improve and I might have to revisit some results later on. I noticed in my testing that some games only use a portion of the threads. The photo below was from Battlefield 1 for example.
So what CPU should you go with? Honestly, for the first time in a long time, I can recommend both. The i7-7700K may not have had the huge jump in performance like AMD did with Ryzen but it is still the fastest gaming CPU you can pick up today. AMD didn’t manage a win in gaming but it does lead in other areas. Beyond the gaming performance, Intel also stands out currently in motherboard availability. I’m not mentioning this because right now getting higher end AMD boards is hard. I am actually referencing overall options. As a big SFF fan ITX boards aren’t available at all on AM4 yet with only rumors and a few photos to go by even. With Z270 there are a few established options available. Given I will be picking between AMD and Intel on my wife's upcoming ITX build, this might end up being the determining factor if AM4 ITX options don’t come out soon.
Live Pricing: Intel i7-7700K – AMD Ryzen R7 1700


