CPU Performance
In the real world everyone puts their computer to use in different ways. Some focus on gaming while others might find encoding or running multiple virtual machines to be most important. Because of that I have split up our compute performance testing slightly to help pinpoint what might apply to you the most.
Specialty Benchmarks
Specialty Benchmarks doesn’t really describe this section the best, but basically here we have all of the benchmarks that don’t fall into the other groups. Most of these focus on compute power from different angles. Here we will get a better idea of how the A10-6800K and A10-6700 compare to everything else in things like encoding, math, ect.
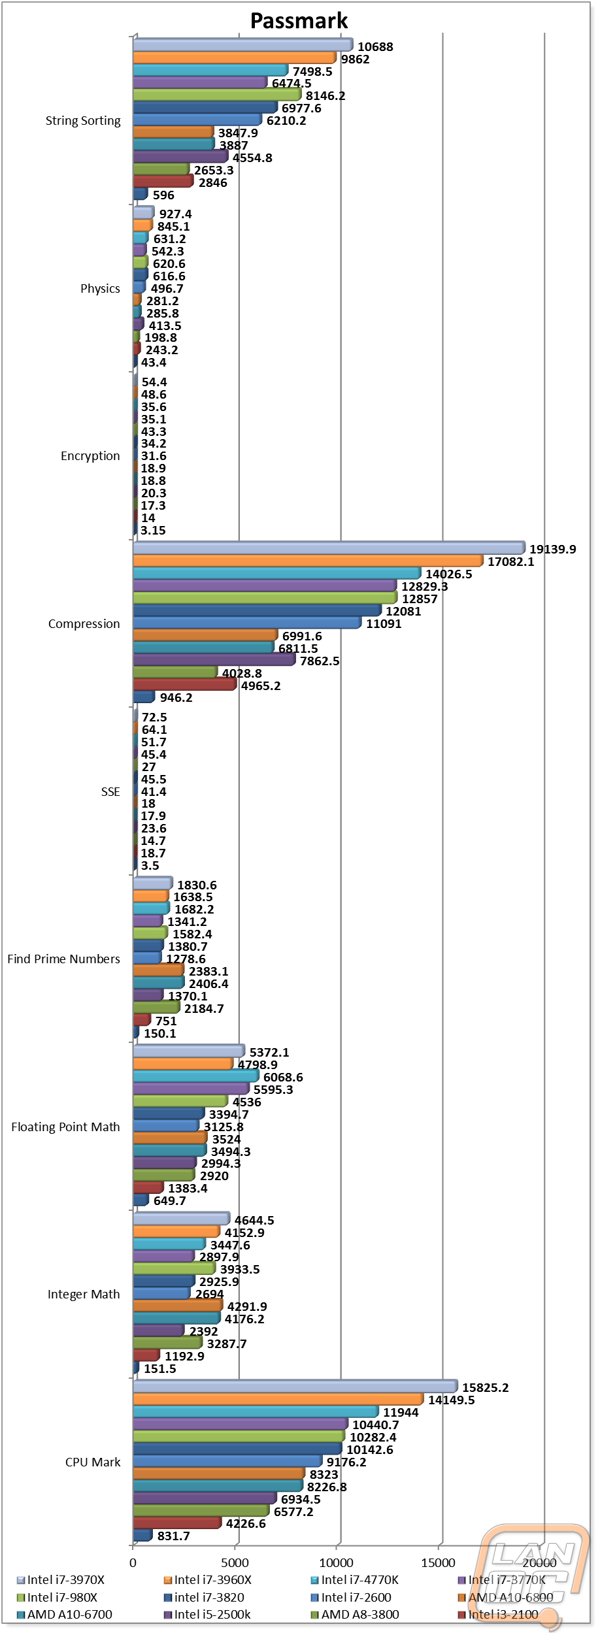
In Passmark both APUs performed great showing extremely good performance in Integer Math, Floating Point Math, and Finding Prime numbers. In fact with finding prime numbers the 6800K outperformed the 3860X slightly. This made for overall Passmark scores around the forever popular i5-2500K.
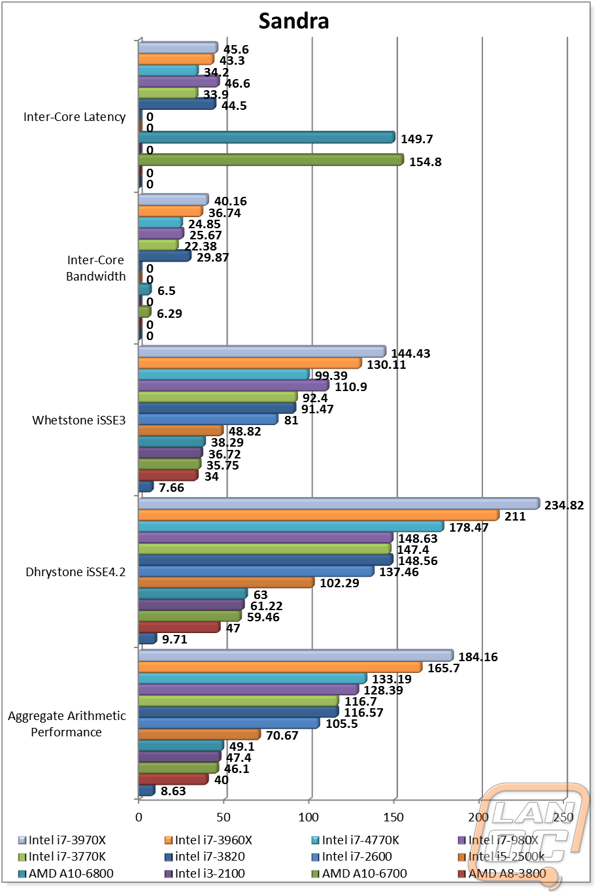
In our Sandra benchmark one major issue with the APUs became apparent. Inter-Core Latency was extremely high in both cases. This also translated to low bandwidth numbers as well between cores. On the rest of the tests though they both fell in between the i5-2500K and the i3-2100 for performance.
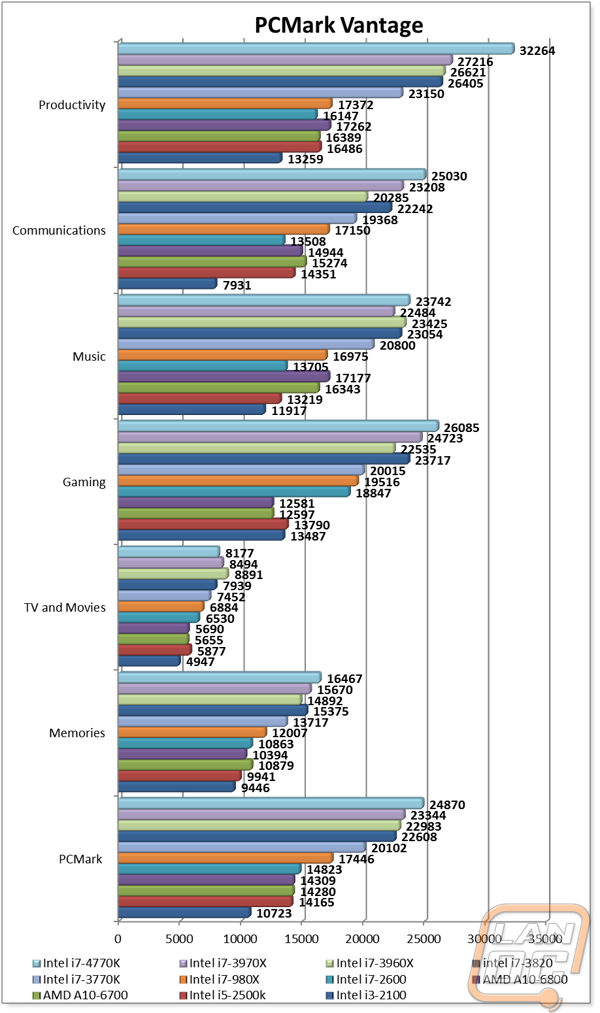
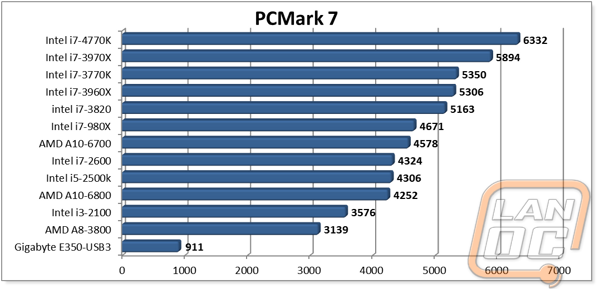
In PCMark Vantage and PC Mark 7 the 6800K and 6700 fall in between the i7-2600 and the i5-2500K for performance. Both are CPU’s that I would still consider to be extremely powerful but newer Ivy Bridge and Haswell CPU’s do make them look slightly aged.
Real World
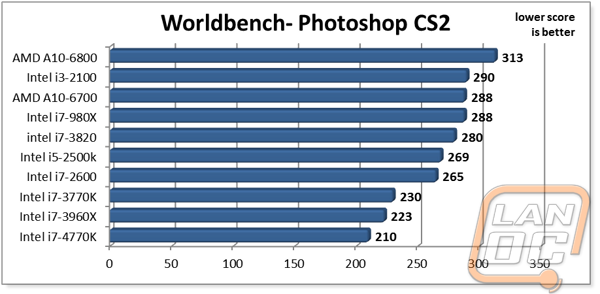
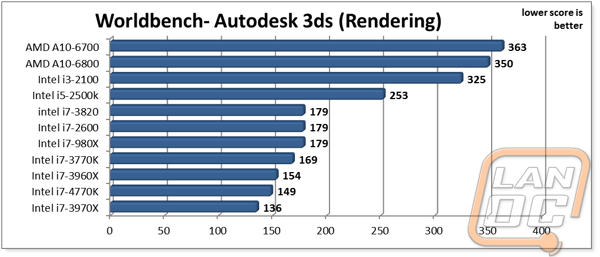
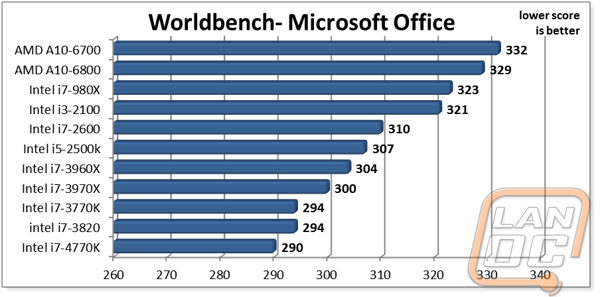
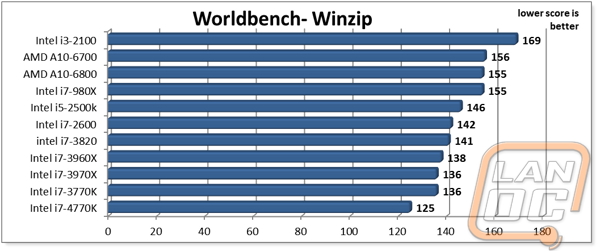
In my real world testing I put both APUs to the test in a few Worldbench benchmarks that use actual programs. This gives us a better idea of what you should expect in your day to day use. In most of my tests the 6800K and 6700 came in just below the i3-2100. The exception to this was with Winzip where the additional cores helped them both perform in like with the aged i7-980X
In Game and 3D performance
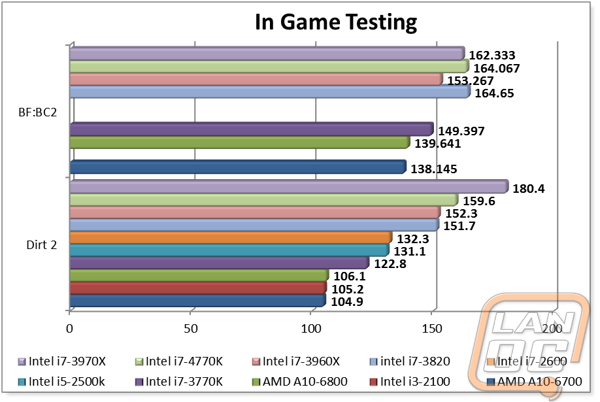
Our 3D specific benchmarks all take advantage of the two GTX 580’s that we use in SLI. Our On-Board specific testing is later in this review. This shows what kind of performance improvement you can expect to see without changing your video card out. In both of our in game benchmarks it is clear that compute performance isn’t always the most important factor, meaning there are a lot of games that an upgrade in CPU won’t make much If any difference. In Dirt 2 though, our two GTX 580s are powerful enough to leave the CPU as the limiting factor. Both the 6800K and 6700 perform similarly to the i3-2100 in that test.
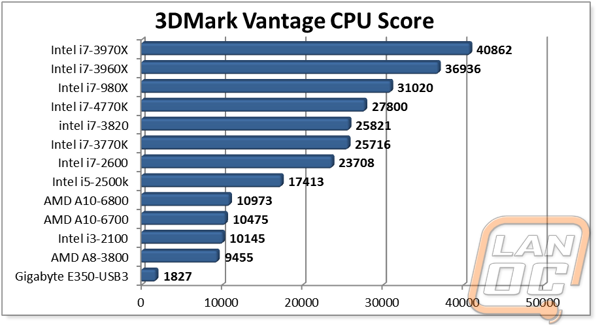
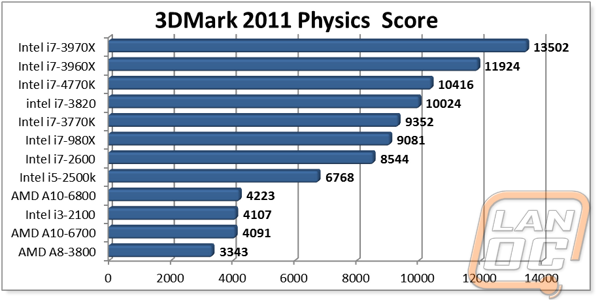
When taking a look at our results from 3DMark 11 and Vantage we ignore the GPU score and the overall and focus on the CPU and PhysX scores. These are CPU specific and are a much better representation of the performance from CPU to CPU. It is very interesting to see the difference in the two tests. The Vantage results favor more cores over overall compute power like the 3DMark 11 scores. Once again both the 6800K and 6700 perform similarly to the i3-2100, while I wouldn’t consider that to be all that impressive it is still more than enough to let you game in just about any situation.
Overall CPU benchmarks
Our last set of benchmarks generally show the overall performance of the complete package. In some cases things like additional memory bandwidth and more PCI Express lanes show up better in this kind of benchmark as they are more overall representations of what to expect in day to day situations.
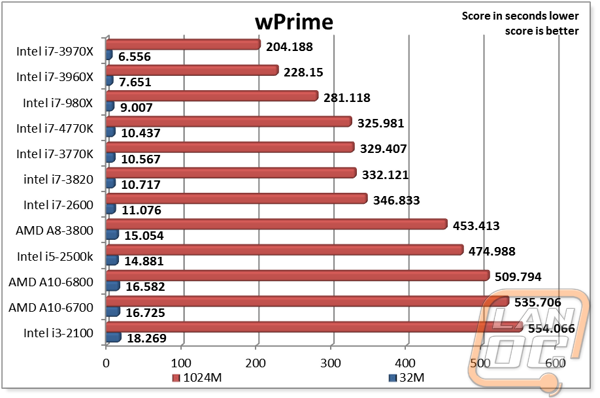
wPrime is a benchmark that a lot of overclockers put to use to compare performance and I completely understand why. You end up with simple-and-easy-to-compare results where the lower the score the better. The 6800K and 6700 fell in between the i5-2500K and the dual core i3-2100, this is in line with the performance results I have seen in the rest of our tests. This is a great test to see the difference between the two A10 APUs though with the 6800K pulling a 408 while the 6700 pulled a 535.
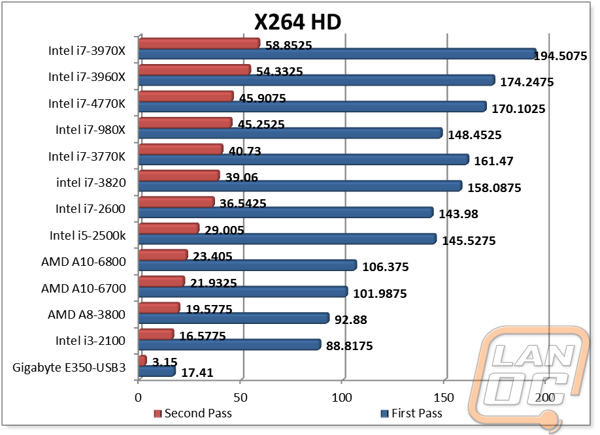
For those of you who spend a lot of time encoding low performance can add up over time. X264 HD shows us the encoding performance of the 6800K and 6700 to be around 40 FPS less than the i5-2500K. While encoding from time to time will be fine I wouldn’t be looking at them if I did encoding all of the time.
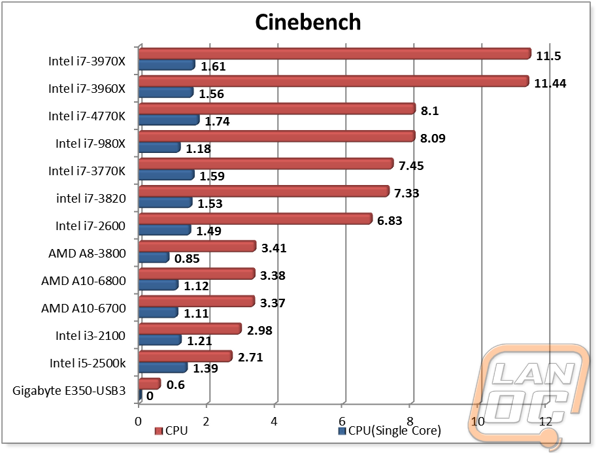
Cinebench has to be my favorite benchmark when doing CPU testing simply because it benchmarks overall CPU performance as well as single core performance. This can be substantially different sometimes when a 6+ core CPU might be fast but at a per core level slower than other CPUs. Overall CPU performance here isn’t any different than the much older A8-3800 oddly enough but when you look at the single core performance we are up closer to the 980X. In other words AMD still has a little farther to go to hit the performance of Sandy Bridge with their A10 APUs.
