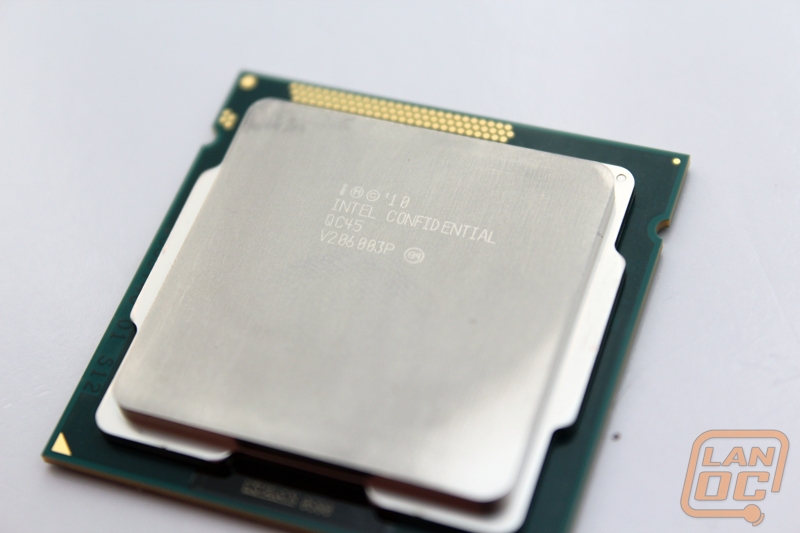
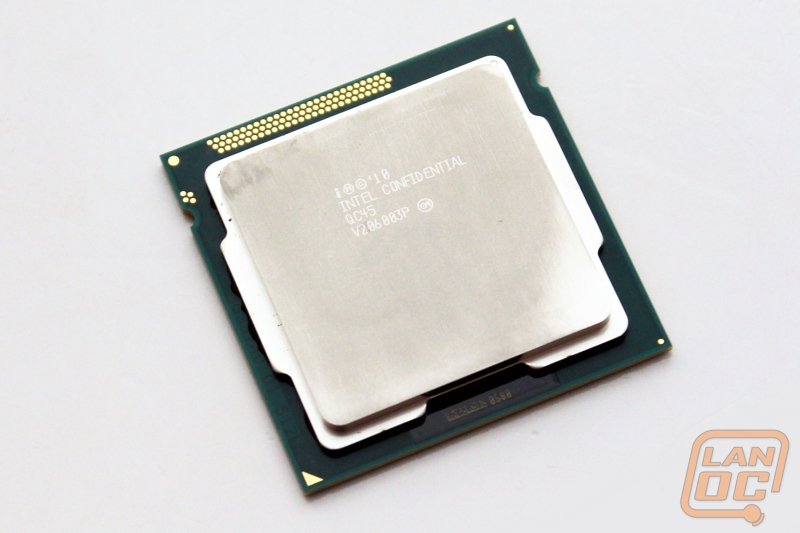
 It seemed like the virtual ink hadn’t even dried on our Sandy Bridge review and people were already talking about waiting for Ivy Bridge to come out. The same goes for our Sandy Bridge E write-up, a lot of people on the forums and at our events spoke about waiting for Ivy before making a decision. Well I can finally say that today is that day. We are going to take a look at Intel’s new Ivy Bridge CPUs, specifically the i7-3770K. We will put it up against all that Sandy Bridge had to offer along with a few Sandy Bridge E CPUs, including the competitively priced i7-3820. At the end of the day you will know what it’s all about and we will hopefully help give you the facts in your buying decision.
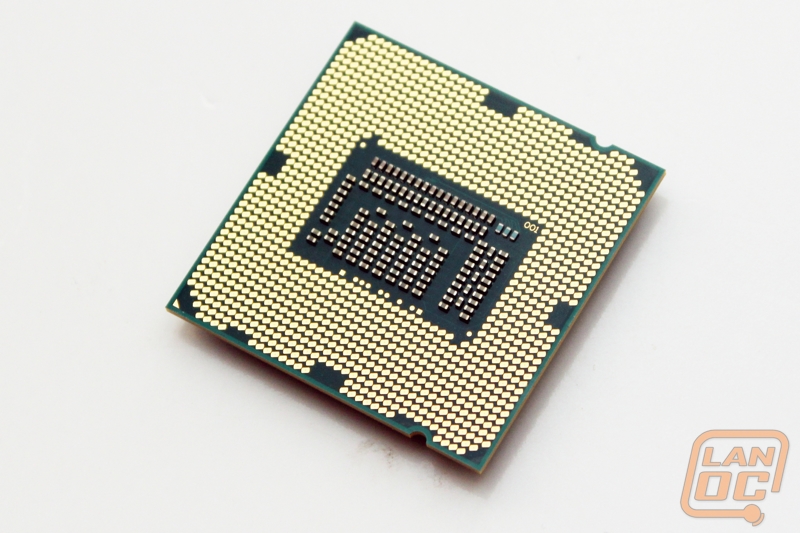
Product Name: Intel i7-3770K Ivy Bridge
Review Sample Provided by: Intel
Review by: Wes
Pictures by: Wes
Ivy Bridge Overview
By now most of you should understand Intel’s Tick and Tock system. Basically Intel has two product releases for each manufacturing process size. Take 32nm for example. When they first introduced 32nm with Westmere, it was still based on the Nehalem Microarchitecture, only smaller. Then in 2011 they introduced Sandy Bridge, still on 32nm but a new microarchitecture. Today we are going over Ivy Bridge, Intel’s 22nm CPU based on the Sandy Bridge Microarchitecture. So this is the "tick" to the Sandy Bridge “tock”. To go along with the 22nm manufacturing process, this is also the first use of the 3D Transistor, the 3D design allows for a smaller design. They have integrated power aware interrupt routing for better performance and power efficiency.
As we spoke about during the Sandy Bridge E launch and even the original Sandy Bridge, Intel maintains two different proccessor lines: one being mainstream and one enthusiast. You need to remember that Ivy Bridge/Sandy Bridge is designed to be a mainstream architecture. You can and will see amazing performance, but there are a few areas where you are still going to want to look at Sandy Bridge E CPUs, a CPU designed for the enthusiast and power user. A few good examples of that would be in the number of cores you can expect to see on them, memory bandwidth, and PCIe lanes. Ivy Bridge will get you 4 cores while Sandy Bridge E will get you 6 and someday 8. The same goes for memory bandwidth: Sandy Bridge E supports quad channel memory where you have dual channel on Ivy Bridge. Last you have a limited number of PCI lanes on Sandy Bridge/Ivy Bridge limiting you when running multiple video cards. Please keep in mind that we are not putting Ivy/Sandy Bridge down at all. But you have to remember that as a mainstream product, it does have its limitations. That is why today we will also be putting it up against the Sandy Bridge E CPUs.
Although we will only be taking a look at one processor today, Intel is actually launching a full line of Ivy Bridge based I7 and I5 processors. As with Sandy bridge they have tried to make the naming scheme as easy as possible. You have to break it down by three things. Using our test CPU as an example.
I7-3770K
I7 line meaning Hyper threading and top end performance
3770 - is the model number, these numbers do go higher as you get better performance
K – In this case the CPU is unlocked and able to be overclocked. But you will also see S and T in the low power line and sometimes nothing at all. Nothing means it’s a standard CPU that is locked. S processors are performance optimized lifestyle SKUs, while the T are power optimized. You will also see M for mobile and XM for an Extreme edition Mobile, this leads us to the assumption that we could also see X labeled Extreme CPUs on the desktop side also.
I’m sure you are wondering by now what is different about Ivy Bridge beyond just the manufacturing process. They did make a few changes to the CPU side beyond just lowering the CPU’s power usage with the smaller manufacturing process. One of the memory side improvements is support for DDR3 frequencies up to 2800MHz now, up from 2133MHz previously. Along with that there is now support for XMP 1.3, something we saw compatibility with when Sandy Bridge E launched but Sandy Bridge only supported 1.2. Data structures that used to be statically shared between threads can now be dynamically shared giving improved performance in single core performance. Together that may not seem like very much, but combined with increased turbo frequencies it all adds up to more performance.
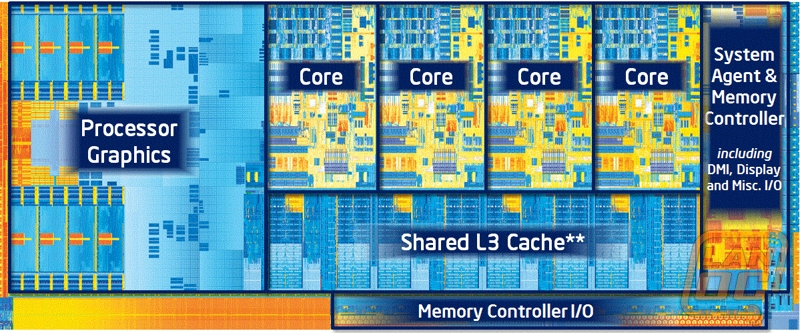

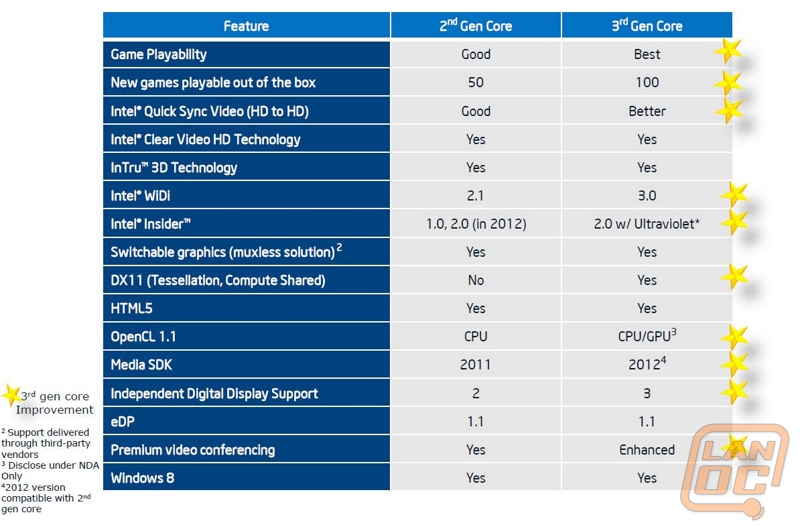
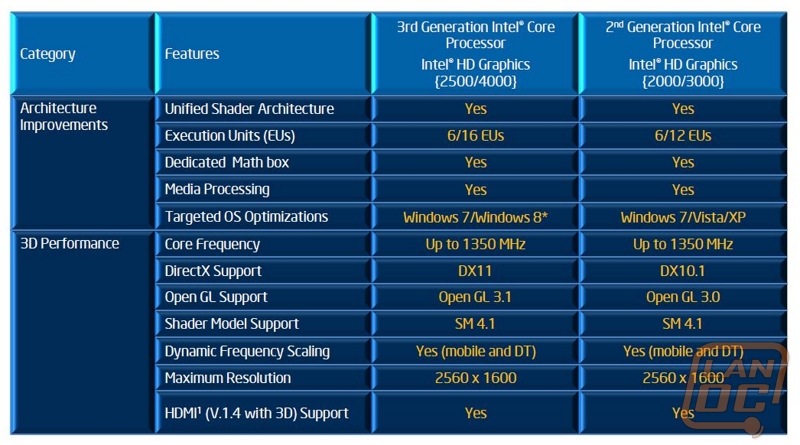
On the integrated GPU side of things Intel has spent a little more time. In fact it looks more like a tick than a tock, we would normally see improvements like this with a new architecture. First and foremost, there is finally support for Direct X 11. They have also added support for the first time with on processor graphics for three displays. For performance, they have added more execution units going from 12 on Sandy Bridge to 16 now on the Intel HD 4000 GPU (the one we will be testing). It will be interesting to see how this affects performance. According to Intel Sandy bridge had 50 new games playable out of the box and Ivy Bridge with the HD 4000 will play 100. They are also promising twice the performance when using Intel Quick Sync Video; it’s obvious that the GPU was the focus this time around!
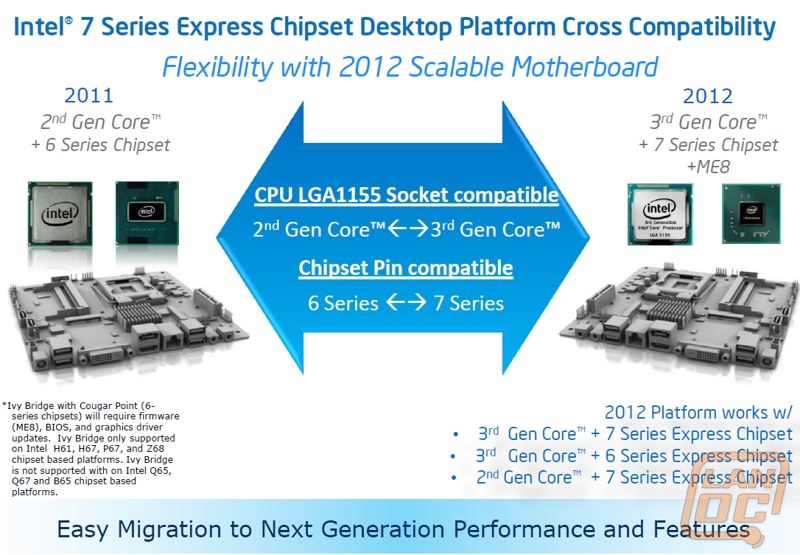
Just a quick note on compatibility for those of you with Sandy Bridge CPU’s. The new 7 series chipsets support both Sandy Bridge and Ivy Bridge CPU’s. If you want to run an Ivy Bridge CPU on your P67/Z68 chipsets you will have to update your firmware before attempting as they currently do not support the new CPU’s but they are capable of it.
Specifications
Standard Power 3rd Gen Intel Core Desktop QC Processors
|
Processor Number |
Core i7-3770K |
Core i7-3770 |
Core i5-3570K |
Core i7-3550 |
Core i5-3450 |
|
Price |
$313 |
$278 |
$212 |
$194 |
$174 |
|
TDP |
77 |
77 |
77 |
77 |
77 |
|
Cores/Threads |
4/8 |
4/8 |
4/4 |
4/4 |
4/4 |
|
CPU Base Freq (GHZ) |
3.50 |
3.40 |
3.40 |
3.30 |
3.10 |
|
Max Turbo Freq (GHZ) |
3.90 |
3.90 |
3.80 |
3.70 |
3.50 |
|
DDR3 (MHz) |
1600 |
1600 |
1600 |
1600 |
1600 |
|
L3 Cache |
8M |
8M |
6M |
6M |
6M |
|
Intel HD Graphics |
4000 |
4000 |
4000 |
2500 |
2500 |
|
Graphics Base Render Frequency |
650MHz |
650MHz |
650MHz |
650MHz |
650MHz |
|
Graphics Max |
1150MHz |
1150MHz |
1150MHz |
1150MHz |
1100MHz |
|
PCIe Den 3.0 |
yes |
yes |
yes |
yes |
Yes |
|
Intel Secure Key |
yes |
yes |
yes |
yes |
Yes |
|
Intel OS Guard |
yes |
yes |
yes |
yes |
Yes |
|
Intel SIPP |
yes |
yes |
|||
|
Intel vPro Technology |
yes |
yes |
|||
|
Intel VT-d |
yes |
yes |
|||
|
Intel TXT |
yes |
yes |
Low Power 3rd Gen Intel Core Desktop QC Processors
|
Processor Number |
Core I7-3770T |
Core I7-3770S |
Core I5-3550S |
Core I5-3450S |
|
Price |
$278 |
$278 |
$194 |
$174 |
|
TDP |
45 |
65 |
65 |
65 |
|
Cores/Threads |
4/8 |
4/8 |
4/4 |
4/4 |
|
CPU Base Freq (GHZ) |
2.50 |
3.10 |
3.00 |
2.80 |
|
Max Turbo Freq (GHZ) |
3.70 |
3.90 |
3.70 |
3.50 |
|
DDR3 (MHz) |
1600 |
1600 |
1600 |
1600 |
|
L3 Cache |
8M |
8M |
6M |
6M |
|
Intel HD Graphics |
4000 |
4000 |
2500 |
2500 |
|
Graphics Base Render Frequency |
650MHz |
650MHz |
650MHz |
650MHz |
|
Graphics Max |
1150MHz |
1150MHz |
1150MHz |
1100MHz |
|
PCIe Den 3.0 |
yes |
yes |
yes |
Yes |
|
Intel Secure Key |
yes |
yes |
yes |
Yes |
|
Intel OS Guard |
yes |
yes |
yes |
Yes |
|
Intel SIPP |
yes |
yes |
yes |
|
|
Intel vPro Technology |
yes |
yes |
yes |
|
|
Intel VT-d |
yes |
yes |
yes |
|
|
Intel TXT |
yes |
yes |
yes |
Our Test Benches
For Ivy Bridge Testing
Crucial Ballistix Tracer Ram 1600Mhz 2x2Gb
Intel DZ77GA-70K
OCZ Agility 3 120Gb SSD
Noctua NH-C14 heatsink
Cooler Master Silent Pro M 850Watt PSU
Two Nvidia GTX580’s for SLI testing
Microcool Banchetto 101 Test bench
For X79 Testing
Intel DX79SI Motherboard
Kingston HyperX DDR3 1600MHz Quad Channel Ram
Two Kingston HyperX SATA 3 SSD’s in RAID 0
Intel Active Thermal Solution RTS2011LC Water-cooling
Cooler Master Silent PRO Gold 1200w PSU
Two Nvidia GTX580’s in SLI
http://www.highspeedpc.com/ Test Bench
For Sandy Bridge Testing
Crucial Ballistix Tracer Ram 1600Mhz 2x2Gb
FATAL1TY P67 Profess1onal Series Motherboard
Noctua NH-C14 heatsink
Cooler Master Silent Pro M 850Watt PSU
Sapphire HD6970 BF:BC2 Edition for AMD testing
Two Nvidia GTX580’s for SLI testing
Microcool Banchetto 101 Test bench
For 1366 Testing
Gigabyte G-1 Assassin Gaming Motherboard
EVGA Classified GTX580 Video card
Cooler Master HAFX Nvidia Edition Case
Crucial Ballistix Tracer DDR3 Ram 1600MHz
Cool-It Water-cooling
Cooler Master Silent PRO Gold 1200w PSU
Western Digital SiliconEdge Blue SSD
Our Testing Procedures
Aida64 – Formally Everest ADIA64 is a full benchmark suite. For CPU benchmarking we run CPU Queen, CPU PhotoWorxx, CPU ZLib, CPU AES, CPU Hash, FPU VP8, FPU Julia, FPU Mandel, and FPU SinJulia.
Breakdowns on each benchmark from AIDA64
CPU Queen – “This simple integer benchmark focuses on the branch prediction capabilities and the misprediction penalties of the CPU. It finds the solutions for the classic "Queens problem" on a 10 by 10 sized chessboard. At the same clock speed theoretically the processor with the shorter pipeline and smaller misprediction penalties will attain higher benchmark scores. For example -- with HyperThreading disabled -- the Intel Northwood core processors get higher scores than the Intel Prescott core based ones due to the 20-step vs 31-step long pipeline. CPU Queen test uses integer MMX, SSE2 and SSSE3 optimizations.”
CPU PhotoWorxx - It performs the following tasks on a very large RGB image:
-Fill
-Flip
-Rotate 90 degrees CW
-Rotate 90 degrees CCW
-Fill the image with random colored pixels
-Color to black & white conversion
-Difference
-Crop
This benchmark stresses the integer arithmetic and multiplication execution units of the CPU and also the memory subsystem. Due to the fact that this test performs high memory read/write traffic, it cannot effectively scale in situations where more than 2 processing threads used. For example, on a 8-way Pentium III Xeon system the 8 processing threads will be "fighting" over the memory, creating a serious bottleneck that would lead to as low scores as a 2-way or 4-way similar processor based system could achieve. CPU PhotoWorxx test uses only the basic x86 instructions, and it is HyperThreading, multi-processor (SMP) and multi-core (CMP) aware.
CPU ZLib - This integer benchmark measures combined CPU and memory subsystem performance through the public ZLib compression library. CPU ZLib test uses only the basic x86 instructions, and it is HyperThreading, multi-processor (SMP) and multi-core (CMP) aware.
CPU AES - This benchmark measures CPU performance using AES (Advanced Encryption Standard) data encryption. In cryptography AES is a symmetric-key encryption standard. AES is used in several compression tools today, like 7z, RAR, WinZip, and also in disk encryption solutions like BitLocker, FileVault (Mac OS X), TrueCrypt.
CPU AES test uses only the basic x86 instructions, and it's hardware accelerated on VIA PadLock Security Engine capable VIA C3, VIA C7, VIA Nano and VIA QuadCore processors; and on Intel AES-NI instruction set extension capable processors. The test is HyperThreading, multi-processor (SMP) and multi-core (CMP) aware.
CPU Hash - This benchmark measures CPU performance using the SHA1 hashing algorithm defined in the Federal Information Processing Standards Publication 180-3. The code behind this benchmark method is written in Assembly, and it is optimized for every popular AMD, Intel and VIA processor core variants by utilizing the appropriate MMX, MMX+/SSE, SSE2, SSSE3, AVX or XOP instruction set extension. CPU Hash benchmark is hardware accelerated on VIA PadLock Security Engine capable VIA C7, VIA Nano and VIA QuadCore processors.
FPU VP8 Benchmark -This benchmark measures video compression performance using the Google VP8 (WebM) video codec Version 0.9.5 (http://www.webmproject.org). FPU VP8 test encodes 1280x720 pixel ("HD ready") resolution video frames in 1-pass mode at 8192 kbps bitrate with best quality settings. The content of the frames are generated by the FPU Julia fractal module. The code behind this benchmark method utilizes the appropriate MMX, SSE2 or SSSE3 instruction set extension, and it is HyperThreading, multi-processor (SMP) and multi-core (CMP) aware.
FPU Julia Benchmark - This benchmark measures the single precision (also known as 32-bit) floating-point performance through the computation of several frames of the popular "Julia" fractal. The code behind this benchmark method is written in Assembly, and it is extremely optimized for every popular AMD, Intel and VIA processor core variants by utilizing the appropriate x87, 3DNow!, 3DNow!+, SSE, AVX or FMA4 instruction set extension. FPU Julia test is HyperThreading, multi-processor (SMP) and multi-core (CMP) aware.
FPU Mandel Benchmark - This benchmark measures the double precision (also known as 64-bit) floating-point performance through the computation of several frames of the popular "Mandelbrot" fractal. The code behind this benchmark method is written in Assembly, and it is extremely optimized for every popular AMD, Intel and VIA processor core variants by utilizing the appropriate x87, SSE2, AVX or FMA4 instruction set extension. FPU Mandel test is HyperThreading, multi-processor (SMP) and multi-core (CMP) aware.
FPU SinJulia Benchmark - This benchmark measures the extended precision (also known as 80-bit) floating-point performance through the computation of a single frame of a modified "Julia" fractal. The code behind this benchmark method is written in Assembly, and it is extremely optimized for every popular AMD, Intel and VIA processor core variants by utilizing trigonometric and exponential x87 instructions. FPU SinJulia is HyperThreading, multi-processor (SMP) and multi-core (CMP) aware.
Cinebench - CINEBENCH is a real-world cross platform test suite that evaluates your computer's performance capabilities. CINEBENCH is based on MAXON's award-winning animation software CINEMA 4D, which is used extensively by studios and production houses worldwide for 3D content creation. The test procedure consists of two main components - the graphics card performance test and the CPU performance test.
Main Processor Performance (CPU)
The test scenario uses all of your system's processing power to render a photorealistic 3D scene (from the viral "No Keyframes" animation by AixSponza). This scene makes use of various algorithms to stress all available processor cores.
In fact, CINEBENCH can measure systems with up to 64 processor threads. ThIS test scene contains approximately 2,000 objects which in turn contain more than 300,000 polygons in total, and uses sharp and blurred reflections, area lights, shadows, procedural shaders, antialiasing, and much more. The result is displayed in points (pts). The higher the number, the faster your processor.
Graphics Card Performance (OpenGL)
This procedure uses a complex 3D scene depicting a car chase (by renderbaron) which measures the performance of your graphics card in OpenGL mode. The performance depends on various factors, such as the GPU processor on your hardware, but also on the drivers used. The graphics card has to display a huge amount of geometry (nearly 1 million polygons) and textures, as well as a variety of effects, such as environments, bump maps, transparency, lighting and more to evaluate the performance across different disciplines and give a good average overview of the capabilities of your graphics hardware. The result given is measured in frames per second (fps). The higher the number, the faster your graphics card.
CPU Mark
Integer Math
Floating Point Math
Find Prime Numbers
SSE
Compression
Encryption
Physics String Sorting
Sandra -
Processor Arithmetic-
Whetstone testing is great to see how well a CPU can handle floating-point arithmetic. We also do Dhrystone that is similar but for integer and string operations.
Multi-Core Efficiency-
A benchmark specifically designed to measure the efficiency of the different multi-core processors with their different architectures as well as compare their performance to traditional multi-processor (SMP) systems.
Performance measuring benchmarks do not show at-a-glance the differences between multi-core processors and how multi-threading programs should be designed to best take advantage of the underlying architecture while avoiding the "gotchas" .
This benchmark does not test processor unit computational performance, i.e. how fast the cores of the processors are; it tests how fast the connection between them is only.
Memory Bandwidth-
Sandra's algorithm is multi-threaded on SMP/SMT systems. This works by splitting the arrays and letting each thread work on its own bit. Sandra creates a thread for each CPU in the system and assignes each thread to an individual CPU.
Another difference is the aggressive use of sheduling/overlapping of instructions in order to maximise memory throughput even on "slower" processors. The loops should always be memory bound rather than CPU bound on all modern processors.
The other major difference is the use of alignment. Sandra dynamically changes the alignment of streams until it finds the best combination, then it repeatedly tests it to estimate the maximum throughput of the system. You can change the alignment in STREAM and recompile - but generally it is set to 0 (i.e. no).
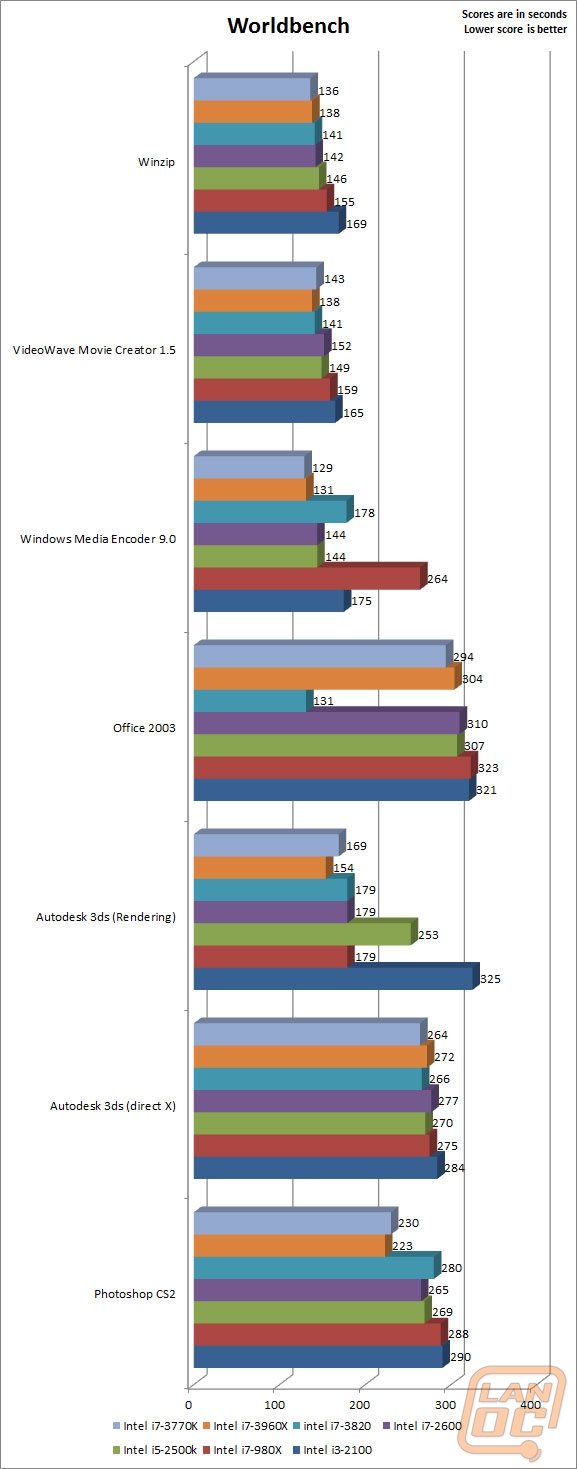
Designed by the guys behind PCWorld, Worldbench is a benchmark designed to use applications and utility’s that everyone uses day to day and benchmark their performance. This gives the most accurate REAL world results, something that no other benchmark does. Being fully automated, WorldBench 6's application tests are scripted to run consecutively, and those results are automatically combined and compared against a baseline system. Popular applications like Microsoft Office, Adobe Photoshop and Mozilla Firefox are each used as they would be in real-world situations to comprise the final WorldBench score.
WPrime – Perfect for testing the multithreading of multiple core CPU’s. “wPrime uses a recursive call of Newton's method for estimating functions, with f(x)=x2-k, where k is the number we're sorting, until Sgn(f(x)/f'(x)) does not equal that of the previous iteration, starting with an estimation of k/2. It then uses an iterative calling of the estimation method a set amount of times to increase the accuracy of the results. It then confirms that n(k)2=k to ensure the calculation was correct. It repeats this for all numbers from 1 to the requested maximum.”
X264 HD – X264 HD is a CPU encoding benchmark. Using the x264 codec this test encodes a video file and times its performance.
Overall Synthetic Benchmarks
We run the entire collection of futuremark’s PC and 3D benchmarks. Although they are synthetic, they do run consistent benchmarks on both in game performance and PC performance. Their new PCMark 7 does an amazing job of testing real world programs including web page loading speed and other activities nearly everyone does on their PC daily.
3DMark Vantage Performance
3DMark Vantage High
3DMark Vantage 2011 Performance
3DMark Vantage 2011 Extreme
In Game Tests
Call Of Duty Black Ops (1920x1080 – high settings, first scene starting after the cut scene, recorded using fraps)
Battlefield Bad Company 2 (1920x1080 – high settings, first scene starting after the cut scene, recorded using fraps)
Dirt 2 (1920x1080 – 4x MSAA – high settings, in-game benchmark)
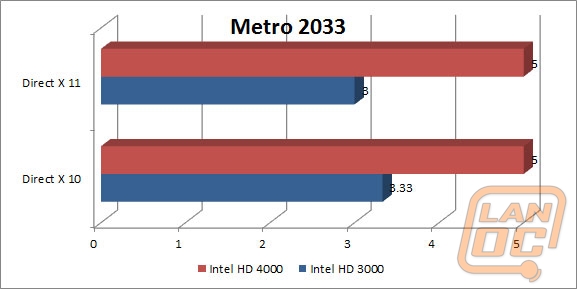
Metro 2033 DX11 test (built-in benchmark, 1920 x 1080; DirectX: DirectX 11; Quality: Very High; Antialiasing: MSAA 4X; Texture filtering: AF 4X; Advanced PhysX: Enabled; Tessellation: Enabled; DOF: Disabled)
Metro 2033 DX10 test (built-in benchmark, 1920 x 1080; DirectX: DirectX 10; Quality: Very High; Antialiasing: MSAA 4X; Texture filtering: AF 4X; Advanced PhysX: Enabled; Tessellation: Enabled; DOF: Disabled)
CPU Performance
As you can see from our testing procedures section we do a variety of different benchmarks showing how the I7-3770 handles different applications. These range from synthetic benchmarks for both gaming and computing along with in game and real world testing to give you an idea of what to expect.
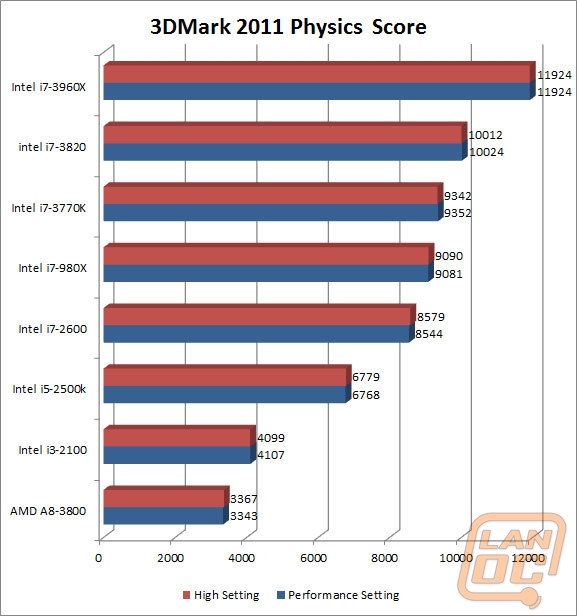
In 3Dmark 2011 we use the Physics score to just the CPU’s performance without letting the GPU interfere with the test results. As you can see, and as expected the i7-3960X pulled ahead with its six cores. What is interesting is to see the i7-980X’s results below the i7-3770. This is very impressive considering the 980X is also a six core CPU.
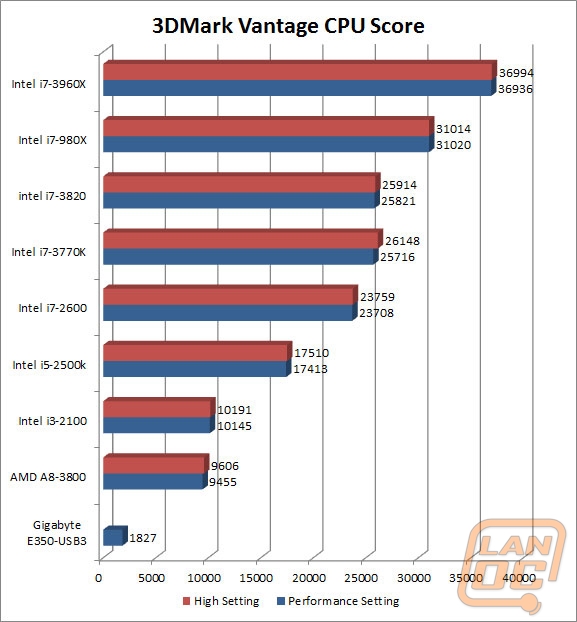
3DMark Vantage tells a different story altogether with both six core CPU’s pulling ahead of the quad core CPU’s. The I7-3770K actually pulls ahead of the i7-3820 when running the high setting and it just barely below with the performance setting.
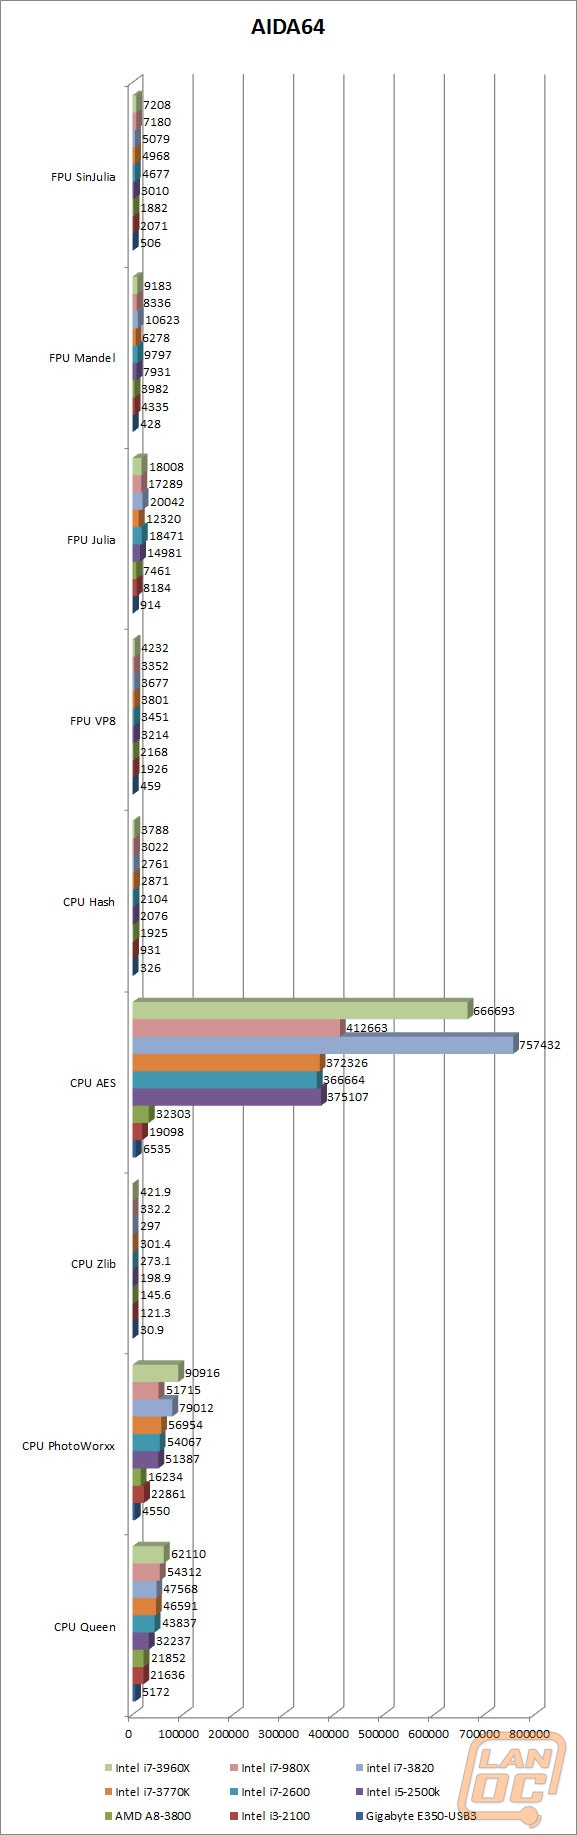
The I7-3770 actually performed a little worse than expected in the FPU Mandel and Julia tests along with the CPU AES benchmark. In all of those tests we saw performance around the same level that we saw with the i5-2500K. Everything else put the i7-3770 just above or just below the i7-3820.
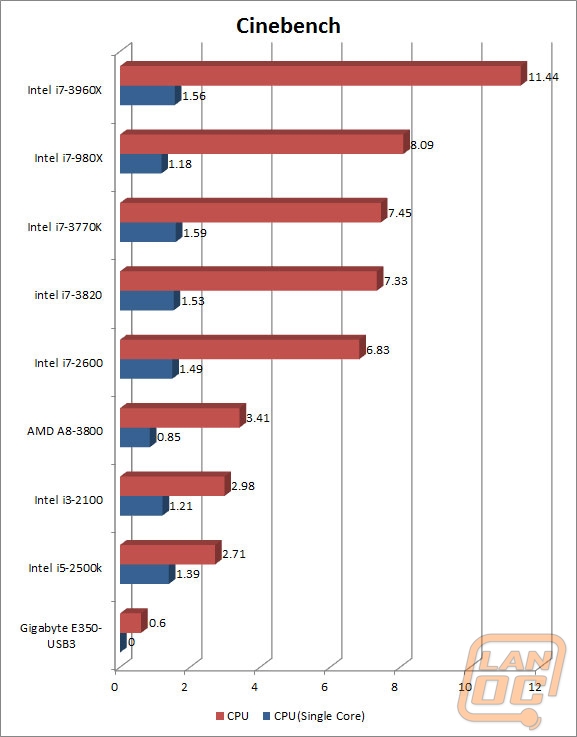
Cinebench results are always one of my favorite because we have a total overall result and then a single core test also. This shows us overall performance and then we also have a chance to see what to expect on the multitude of games and applications that only take advantage of one core. In that case typically the new CPUs with turbo boost have a distinct advantage. With Intel boosting Ivy Bridges turbo slightly this will show up more here. And as you can see the two six core CPUs are at the top of the list for overall. But when you look down at single core results the i7-3770 has the highest single core test result, slightly edging out the i7-3960X.
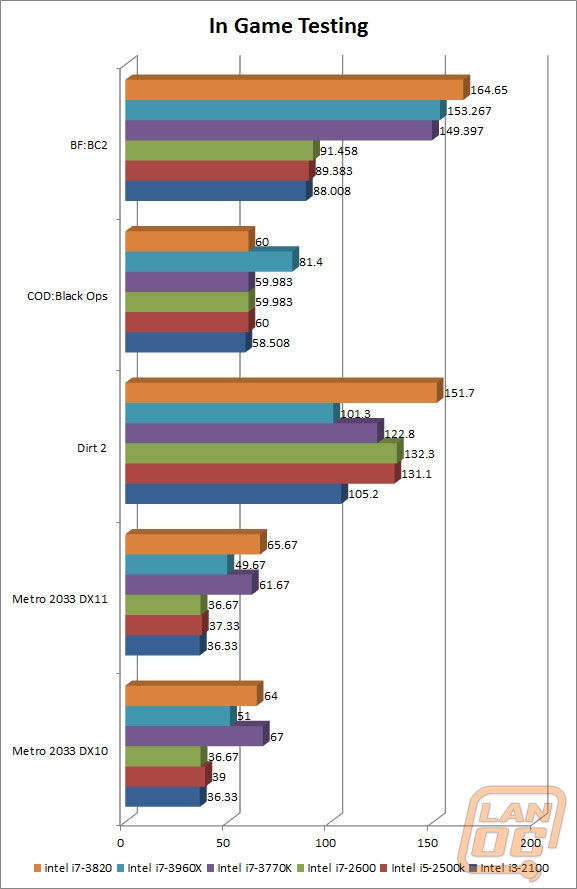
Across the board in our in game benchmarks we saw a nice improvement when using the i7-3770. Considering how close all of our Sandy Bridge results are, I would expect this to be related more to architectural changes like the increased turbo, I wouldn’t be surprised if most of the Ivy Bridge CPUs performed similar.
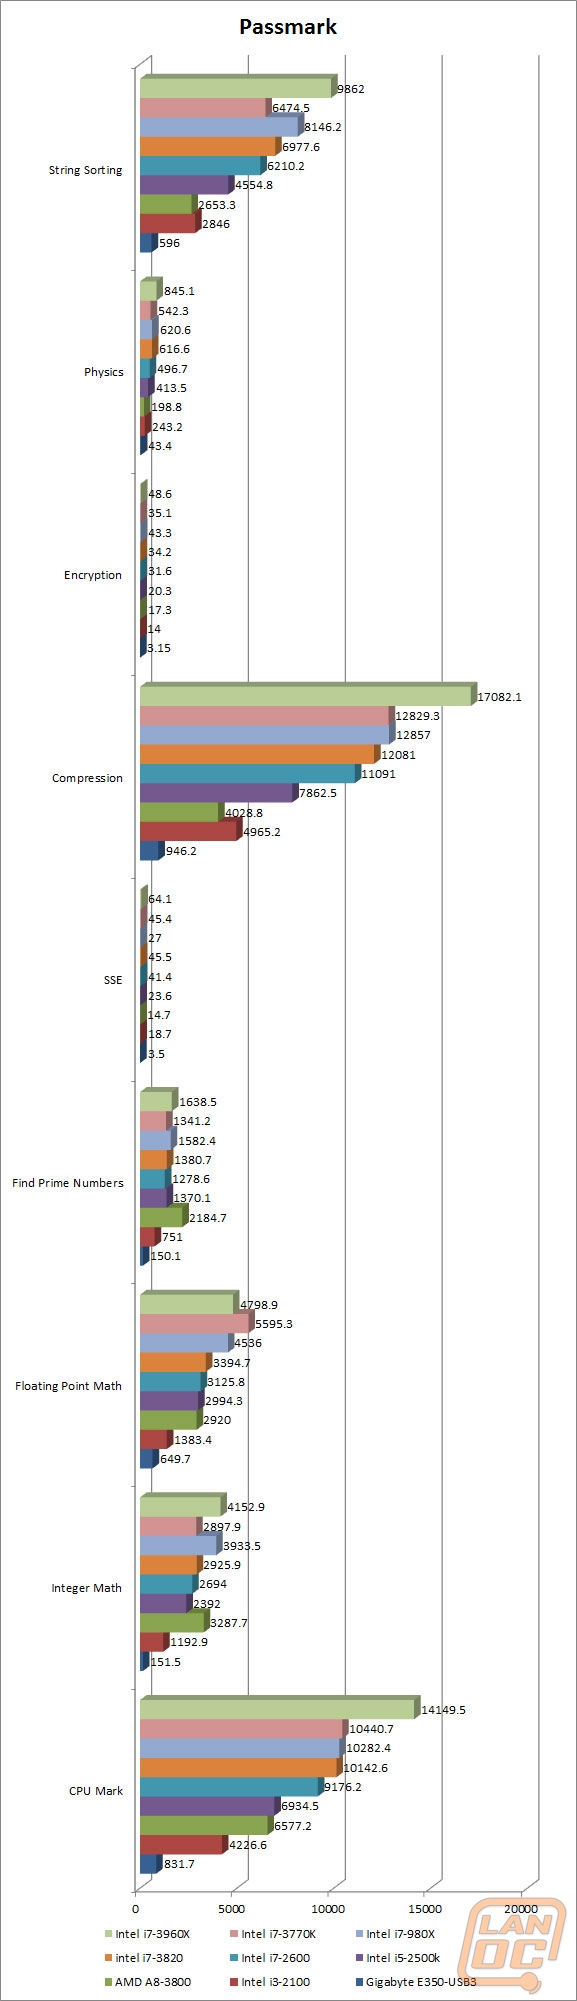
Our passmark overall score shows the i7-3770k coming in slightly above the i7-2600. What that doesn’t show were little gems in the performance breakdown like the CPUs floating point performance. The i7-3770K out performed every other CPU we have tested in that test. Beyond that the CPUs performed very similarly short of in string sorting where the 2600 excelled.
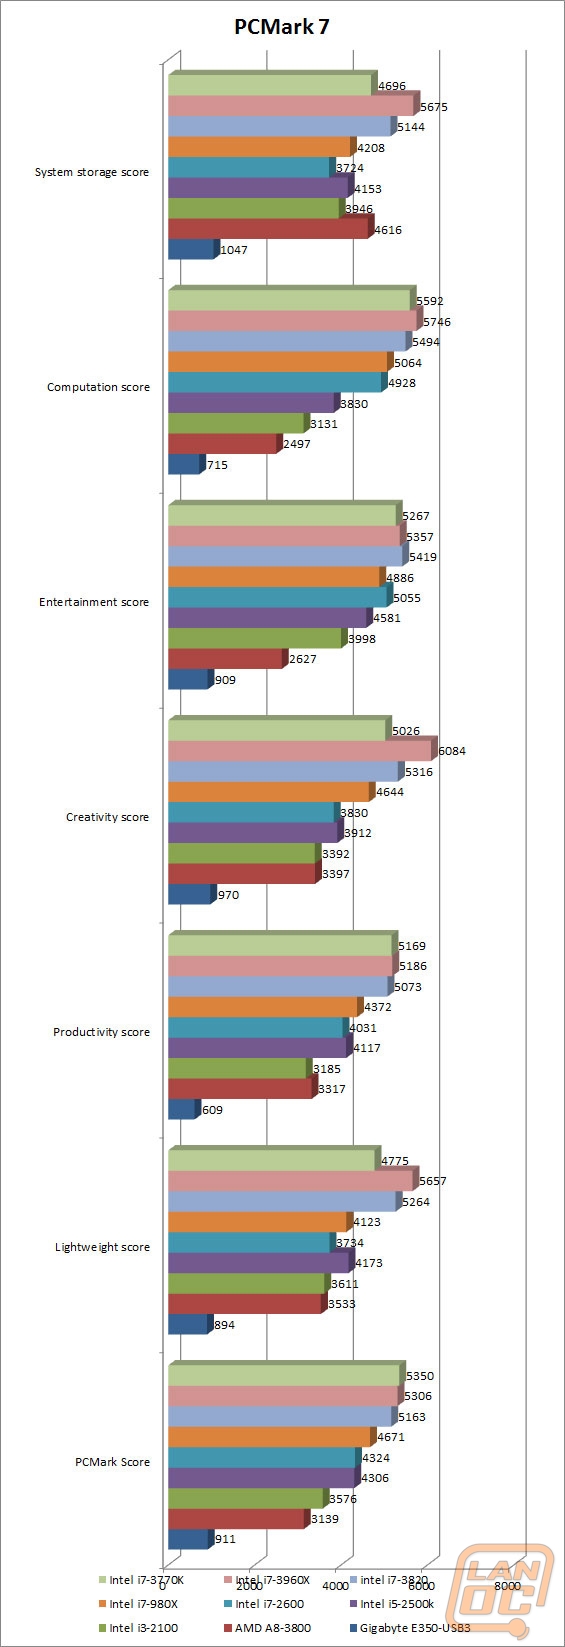
Our PCMark 7 results are interesting. If you look at all of the results you will notice that the i7-3860X outperformed the i7-3770K in all of the benchmarks other than the PCMark result. After a little research, this has everything to do with video transcoding. All of the other results do not do any video transcoding and show the improvement based on the additional cores.
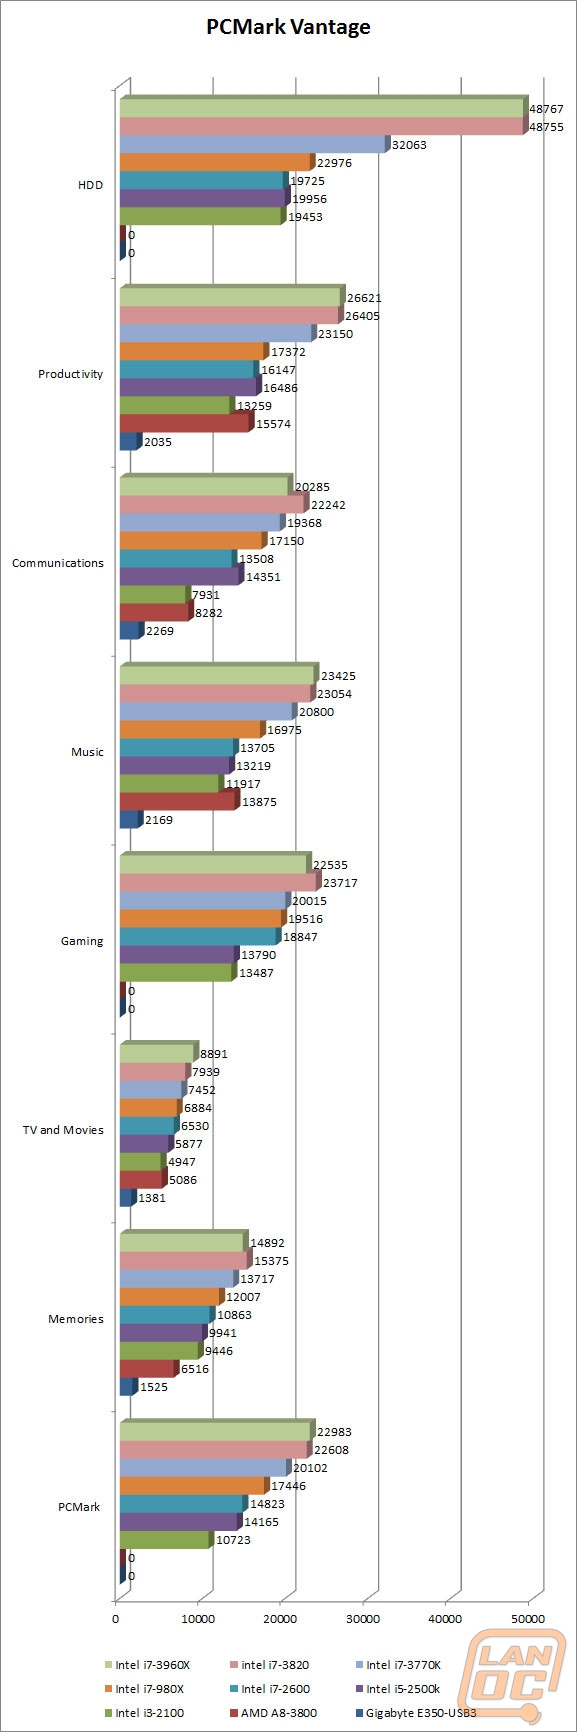
PCMark Vantage consistently puts the i7-3770K in behind the two Sandy Bridge E based CPUs but well above the original Sandy Bridge CPUs. It’s obvious that the extra PCIe Lanes are helpful here. But as a whole the i7-3770 is a fast CPU.
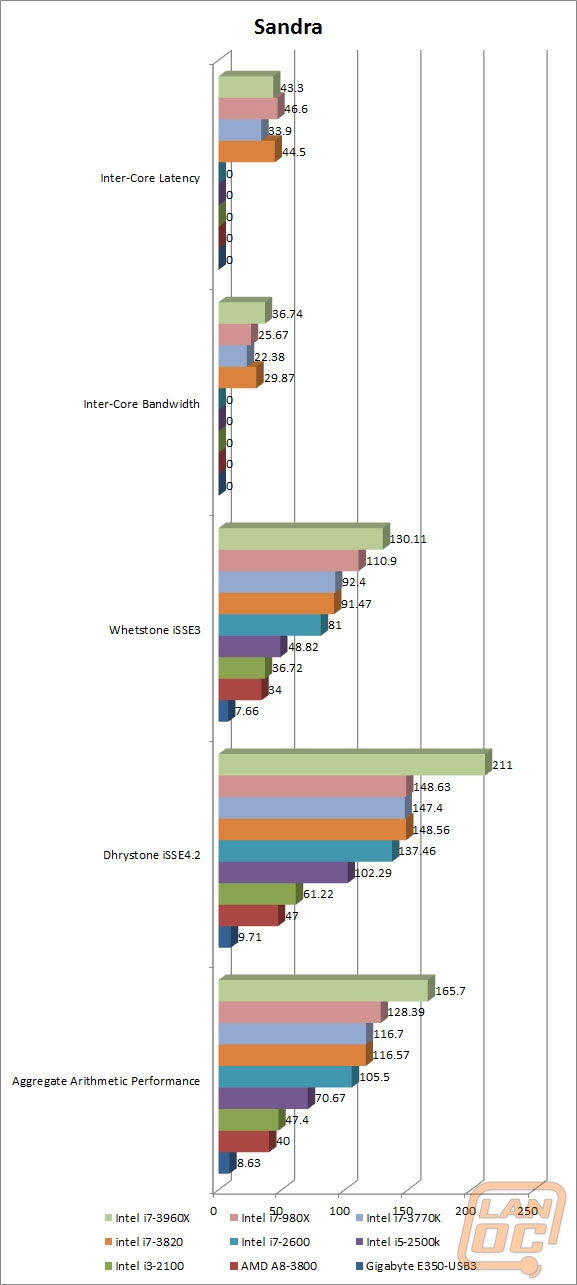
The additional cores came in handy for the arithmetic based benchmarks here but the quad core i7-3770k still performed very well. All of its numbers were very close to what we saw with the quad core i7-3820 as well.
Proof that it’s not always about how many cores you have, the i7-3770k out performed in most of the real world benchmarks. Of course the high dollar i7-3860X did out perform in a few cases and that should be expected.
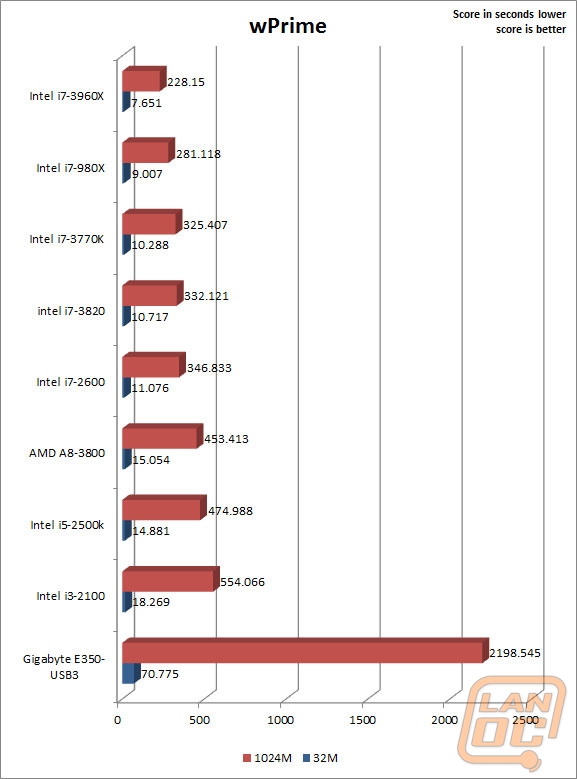
As you can see the six core CPUs excel at wPrime but once you look past that its really impressive to see the results we saw with the i7-3770k. Coming in well below what we saw with our i7-2600 even, it’s clear the i7-3770 has great arithmetic performance.
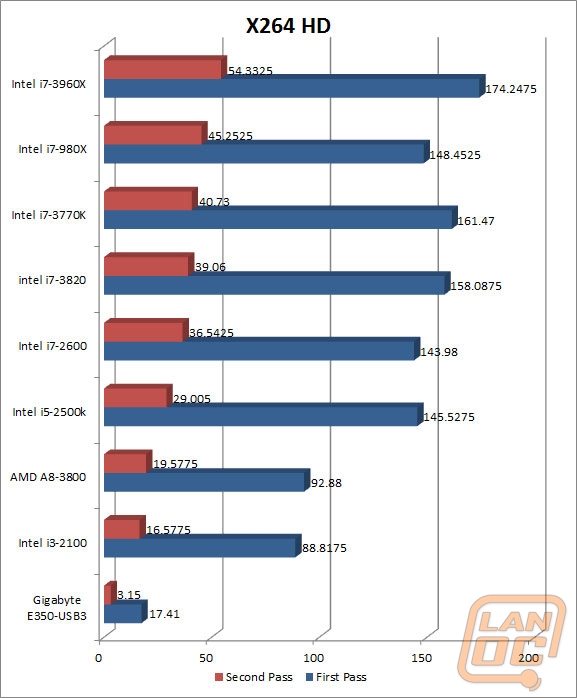
Our X264 results are very similar to what we saw with wPrime, the six core cpu’s excel with the i7-3770 just behind.
Onboard GPU Performance
As with Sandy Bridge, Ivy Bridge made even more improvements on Intel’s on processor GPU as we spoke about earlier. The new Intel HD 4000 GPU is similar to the Intel HD 3000 but with noticeable improvements, much more than what was improved on the CPU side of things. Because of that I was excited to put it to the test. I went back through and retested the Intel HD 3000 in our i5-2500k on the Intel Z77 motherboard as well as testing the i7-3770. Here are the results.
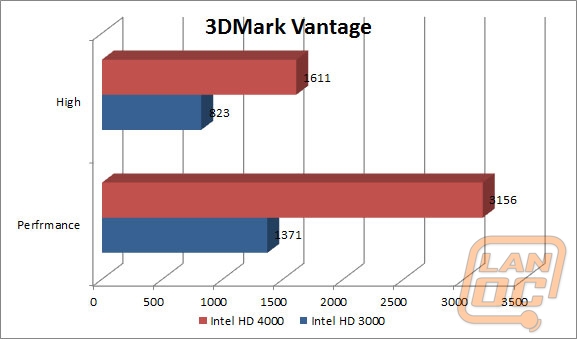
Although it’s a synthetic benchmark, 3Dmark does a great job of comparing different GPU’s. In this case we had to stick with the older 3DMark Vantage due to the lack of directX 11 support with the HD 3000 GPU. As you can see this is much more than a small improvement. We are seeing double the performance out of the new on board GPU. It will be interesting to see how it performs in game.
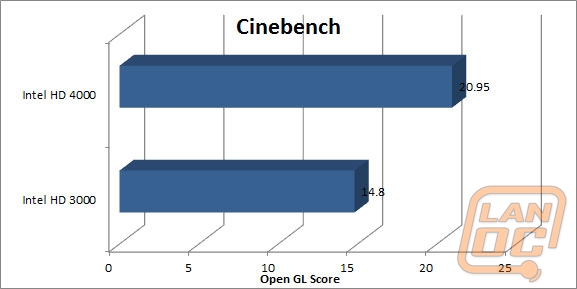
In cinebench using the Open GL results we didn’t see the same results as we did with 3DMark Vantage, but there is still a noticeable increase in performance.
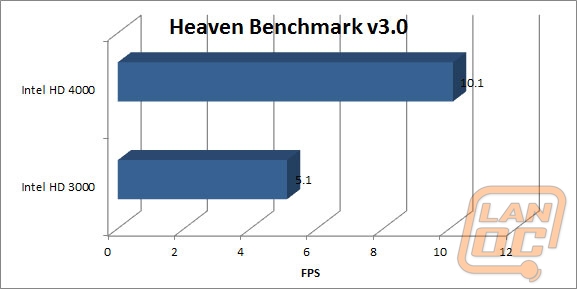
Running through the Heaven Benchmark 3.0 with all of the settings turned up including Anti-Aliasing on an onboard GPU can be frustrating at best. But it is still a good representation of how the onboard GPU’s compare to dedicated GPUs. As you can see the performance increase between the 3000 and 4000 is amazing, but we are still words apart from what you would want from a high end dedicated GPU. But running through at 10 FPS is worlds better than the 5.1 that we saw with the older Intel HD 3000.
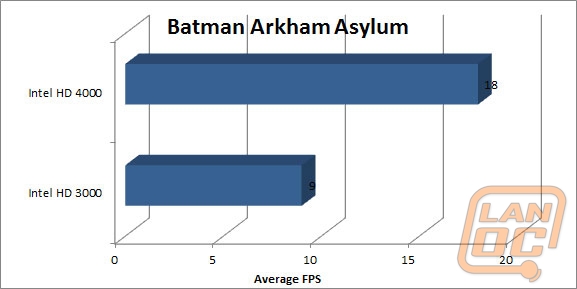
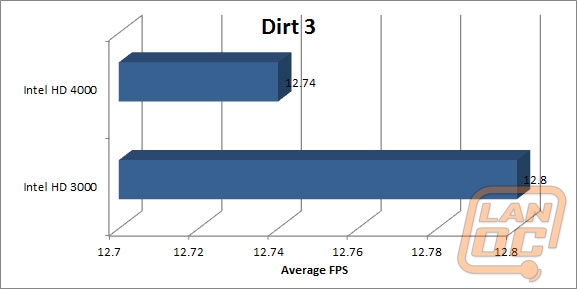
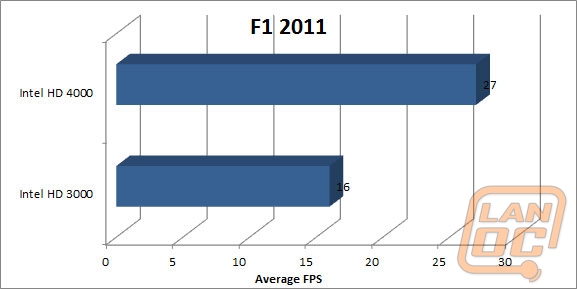
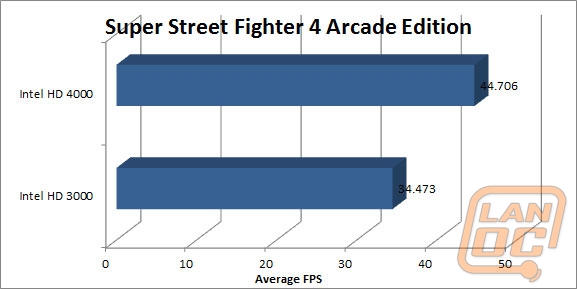
Below are all of our in game results. With the exception of dirt 3, all of the other games we tested with the two onboard GPUs show a 20 to 50 percent increase in FPS. Most of our benchmarks are running with the settings cranked up to the maximum settings, it’s obvious that you wouldn’t want to do this. But you will be able to get most of these games up to play with good frame rates simple by putting them on medium settings and avoiding the Anti-Aliasing.
Overall and FV
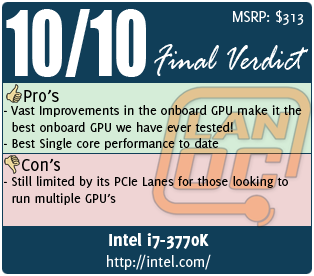
So we went into this knowing this would just be an improvement on what we had already seen with Sandy Bridge. I was actually surprised at the improvements we saw on the CPU side of things, mostly due to the improvements in Turbo Boost. On the GPU side of things we saw vast improvements over the previous generation Sandy Bridge processors. So much so that it’s hard to believe that this is only a “tock” in Intel’s Tick-Tock product cycle. The new GPUs have opened up a lot of new possibilities as far as both transcoding and pure gaming potential. Please don’t get me wrong, if you are looking for top gaming performance a dedicated GPU is still the way to go. But for onboard, the new Intel HD 4000 is very impressive!
There is no question that this is now the top dog for main stream but how does it compare to the recently introduced Sandy Bridge E CPUs? The six core i7-3860X is without a doubt the king, the release of Ivy Bridge doesn’t change this. But at a price of $1000, it’s still going to be a hard sell to anyone who doesn’t have a bottomless wallet. Where I was really interested in performance is the difference between the it-3770k and the SBE based i7-3820. At similar price points and both sporting quad cores this is an interesting debate. First, going with the mainstream oriented Z77 boards are going to be much cheaper than a X79 motherboard, so in the end it will be cheaper to go with the i7-3770. But it really depends on how you plan on using your computer. If you are planning on running more than one GPU or if you want the additional bandwidth X79 is still the way to go. But for a single GPU or onboard GPU setup there is no question you should run out and pick up an Ivy Bridge Based setup right now.