 Intel started 2011 off with the official introduction to their highly anticipated Sandy Bridge processors. We had the chance to take a look at their mid-range i5-2500k and we loved it. The i5-2500k isn’t perfect for everyone, that’s why Intel has introduced a range of processors. Today we will be taking a look at their i3-2100 and i7-2600 to see how they stand in the grand scheme of things. While we do, we will retest the i5-2500k and put the three head to head to find out what the extra money gets you.
Product Name: Intel i3-2100
Review Sample Provided by: Intel
Review by: Wes
Pictures by: Wes
Specifications
|
Product Name |
|||
|
Price |
$124.99 |
$219.99 |
$299.99 |
|
# of Cores |
2 |
4 |
4 |
|
# of Threads |
4 |
4 |
8 |
|
Clock Speed |
3.1 GHz |
3.3 GHz |
3.4 GHz |
|
Max Turbo Frequency |
n/a |
3.7 GHz |
3.8 GHz |
|
Cache |
3 MB |
6 MB |
8 MB |
|
Bus/Core Ratio |
31 |
33 |
34 |
|
System Bus |
5 GT/s |
5 GT/s |
5 GT/s |
|
Instruction Set |
64-bit |
64-bit |
64-bit |
|
Lithography |
32 nm |
32 nm |
32 nm |
|
Max TDP |
65 W |
95 W |
95 W |
|
Memory Specifications |
|||
|
Max Memory Size |
32 GB |
32 GB |
32 GB |
|
Memory Types |
DDR3-1066/1333 |
DDR3-1066/1333 |
DDR3-1066/1333 |
|
# of Memory Channels |
2 |
2 |
2 |
|
Max Memory Bandwidth |
21 GB/s |
21 GB/s |
21 GB/s |
|
Graphics Specifications |
|||
|
Processor Graphics |
Yes |
Yes |
Yes |
|
Graphics Model |
Intel® HD Graphics 2000 |
Intel® HD Graphics 3000 |
Intel® HD Graphics 2000 |
|
Intel® Quick Sync Video |
Yes |
Yes |
Yes |
|
Intel® InTru™ 3D Technology, |
Yes |
Yes |
Yes |
|
Intel® Insider™ |
Yes |
Yes |
Yes |
|
Intel® Wireless Display |
No |
No |
No |
|
Intel® Flexible Display Interface (Intel® FDI) |
Yes |
Yes |
Yes |
|
Intel® Clear Video HD Technology |
Yes |
Yes |
Yes |
|
Dual Display Capable |
Yes |
Yes |
Yes |
|
Expansion Options |
|||
|
PCI Express Revision |
2.0 |
2.0 |
2.0 |
|
Advanced Technologies |
|||
|
Intel® Turbo Boost Technology |
No |
2.0 |
2.0 |
|
Intel® vPro Technology |
No |
No |
Yes |
|
Intel® Hyper-Threading Technology |
Yes |
No |
Yes |
|
Intel® Virtualization Technology (VT-x) |
Yes |
Yes |
Yes |
|
Intel® Virtualization Technology for Directed I/O (VT-d) |
No |
No |
Yes |
|
Intel® Trusted Execution Technology |
No |
No |
Yes |
|
AES New Instructions |
No |
Yes |
Yes |
|
Intel® 64 |
Yes |
Yes |
Yes |
|
Idle States |
Yes |
Yes |
Yes |
|
Enhanced Intel SpeedStep® Technology |
Yes |
Yes |
Yes |
|
Thermal Monitoring Technologies |
Yes |
Yes |
Yes |
|
Intel® Fast Memory Access |
Yes |
Yes |
Yes |
|
Intel® Flex Memory Access |
Yes |
Yes |
Yes |
|
Execute Disable Bit |
Yes |
Yes |
Yes |
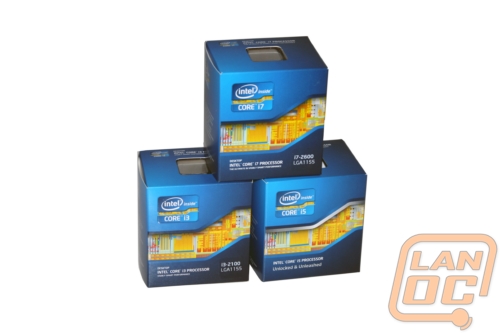
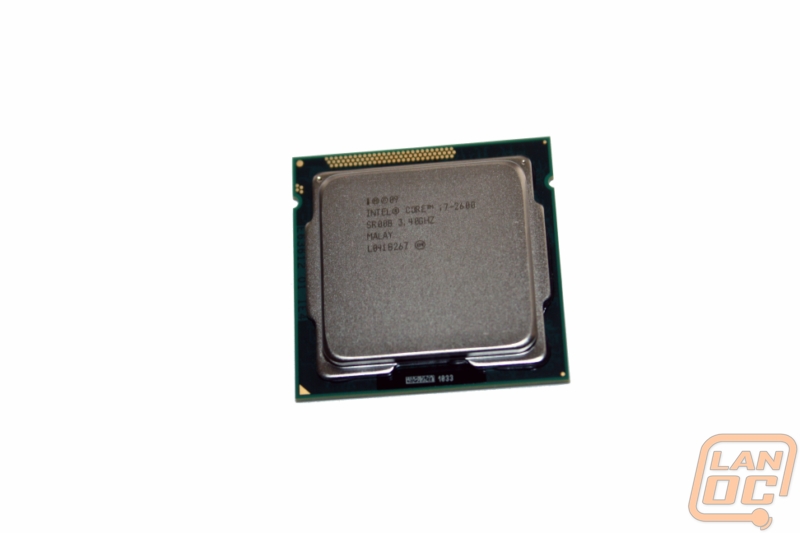
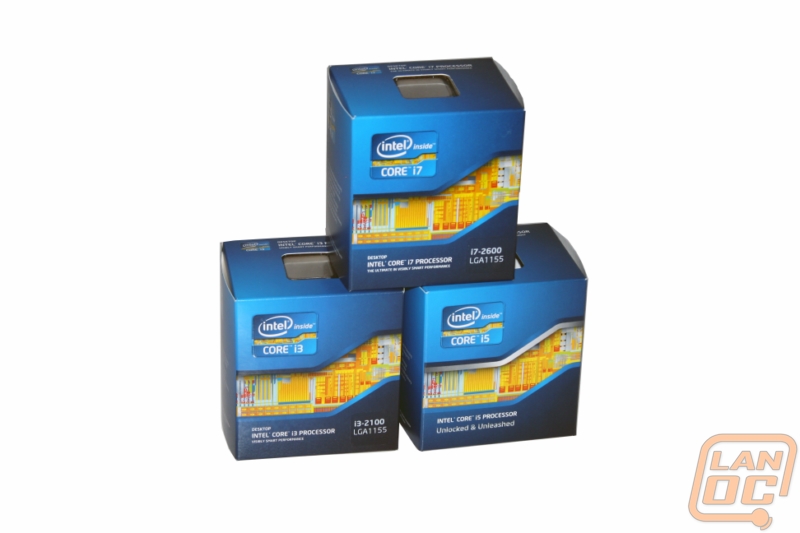
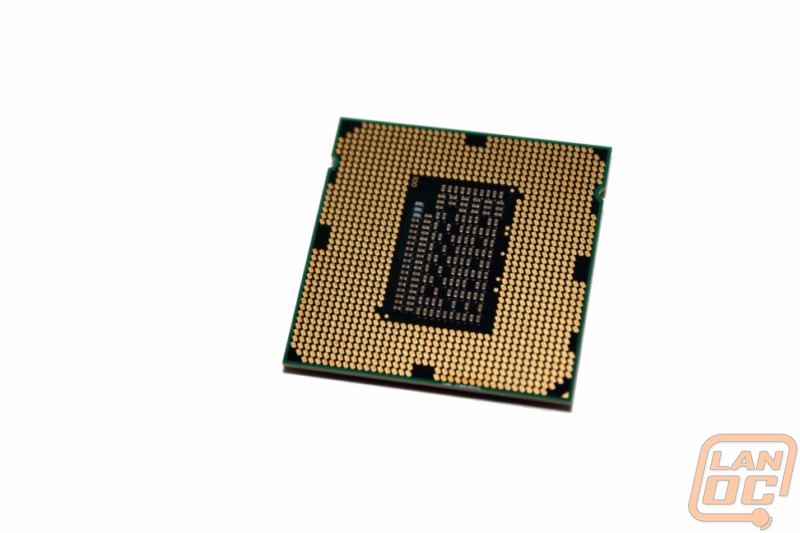
Packaging
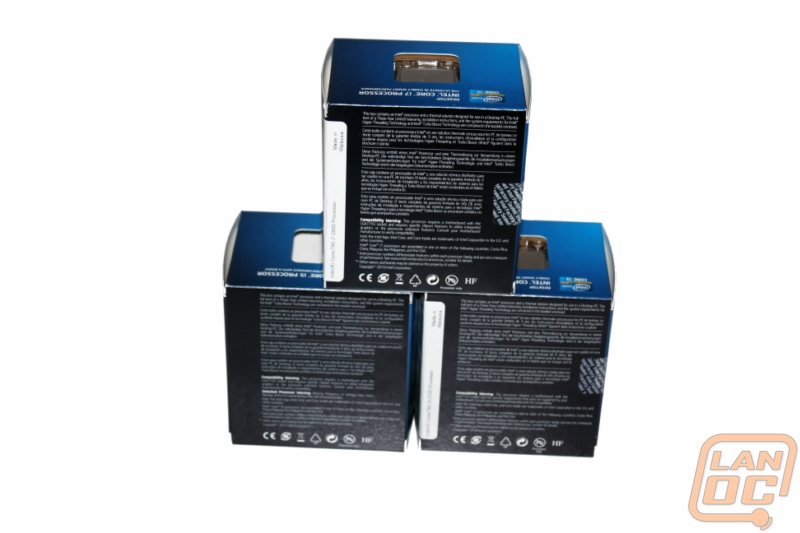
Each of the three CPU’s shares the same package design. Across the face of the box you have glimpse at a microscopic view of the Sandy Bridge architecture. In the top left corner Intel has the Core logo with the respective version (i3, i5, i7). On the bottom right they use a sticker to label the specific model making it possible to use the packaging for multiple models to keep production costs down. Up top you can see the processor itself through a window giving you a chance to check out the stepping. Around back you have a short section pointing out the three year limited warrenty and pointing out that you can find more details in the included booklet. That same section is repeated four more times in different languages. Lastly you have a compatibility warning to remind you that these CPU’s only work with LGA1155 socket motherboards. Ironically this important warning is only available in English, unlike the warranty information above it.
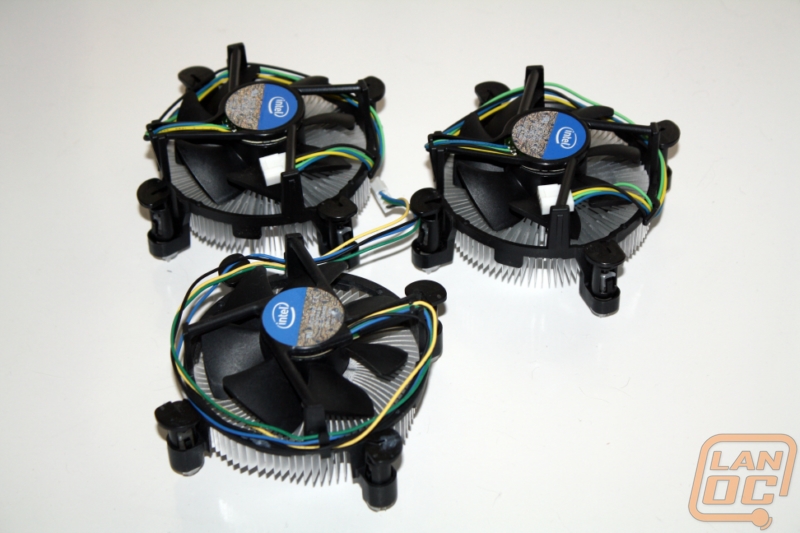
Inside you have the heatsink packed into a cardboard shell taking up most of the space. At the top of that cardboard the CPU itself is slipped into the top and inside of a plastic clamshell. The previously mentioned booklet is also tucked in with the heatsink.
Differences
For our write-up here I will be ignoring the fact that our i5-2500 is a k-version with an unlocked multiplier and upgraded integrated graphics. The biggest difference between the three processors is their price. At nearly $100 between each CPU, there is a large step in costs from CPU to CPU. Moving from the i3-2100 to the i5-2500 you gain two more cores, Intel’s turbo technology, 0.2 Ghz, and twice the Cache. The i3-2100 is Intel’s entry level Sandy Bridge processor giving you the minimum to keep costs down. The i3-2100 also has the added benefit of having a lower TDP, 65W compared to the 95W of the i5 and i7.
Jumping from the i5-2500 to the i7-2600 isn’t as large of a jump as the i3 to i5. You gain Hyperthreading, more virtualization features, 2Mb of added Cache, and 0.1Ghz in clock speed. With the virtualization features and Hyperthreading you may see the i7-2600 being an important jump for businesses looking at virtualization. The added Cache and small jump in clock speed will also help. It’s surprising considering how well our i5-2500k overclocks that we don’t see Intel taking advantage of this and giving their premium CPU more of a clock boost.
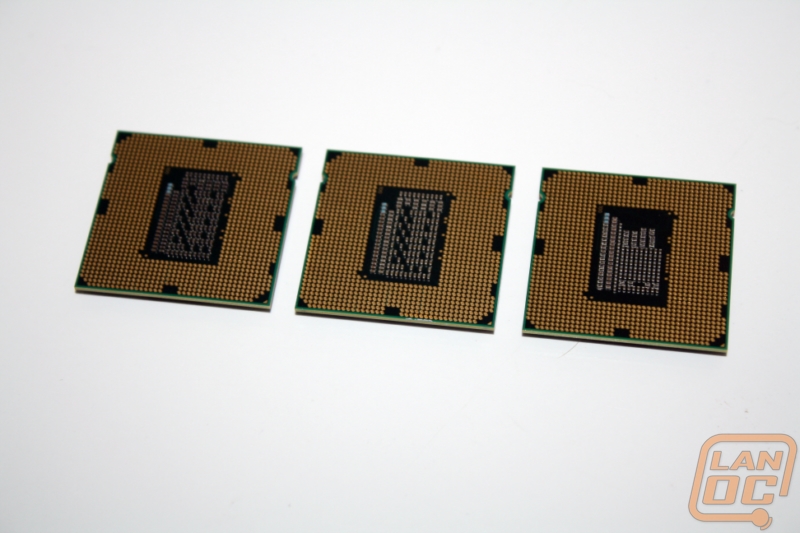
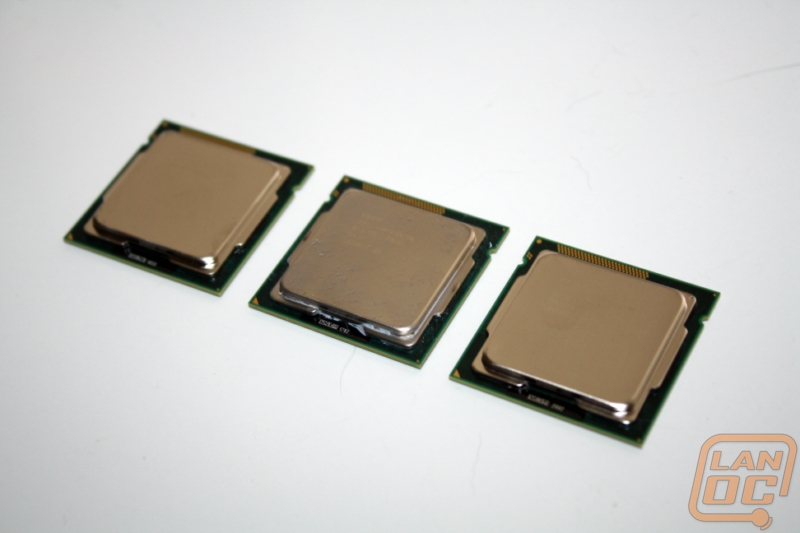
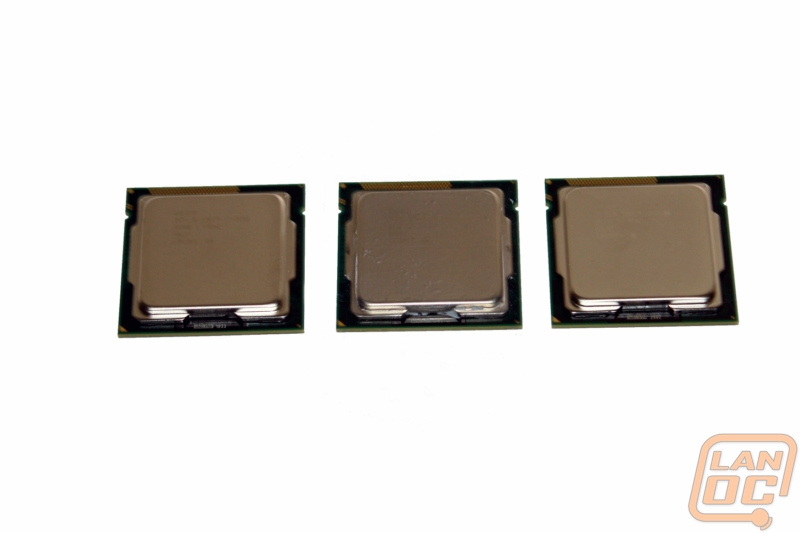
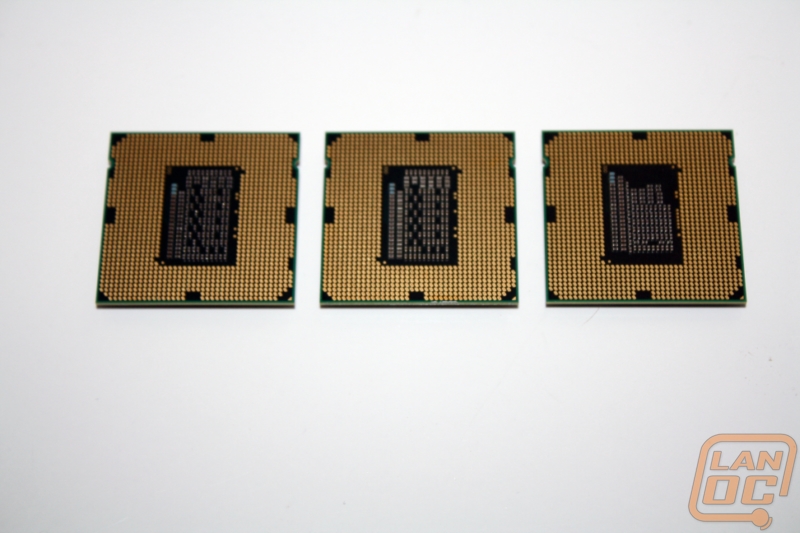
With all three CPU's next to each other and upside-down you can see that the i5 and i7 share the same configuration. The i3-2100 on the other hand does have noticeably fewer transistors.
Our Test Rig
Crucial Ballistix Tracer Ram 1600Mhz 2x2Gb
Noctua NH-C14 heatsink
Cooler Master Silent Pro M 850Watt PSU
Two Nvidia GTX580’s in SLI
Microcool Banchetto 101 Test bench
FATAL1TY P67 Profess1onal Series Motherboard
Our Testing Procedures
Here is a full listing of each benchmark we used during our testing. We have detailed everything needed to duplicate our tests. If you have any questions please use the contact us page to contact us and we would be happy to answer them. Your results could vary depending on PC configuration, drivers, and windows condition.
CPU Specific
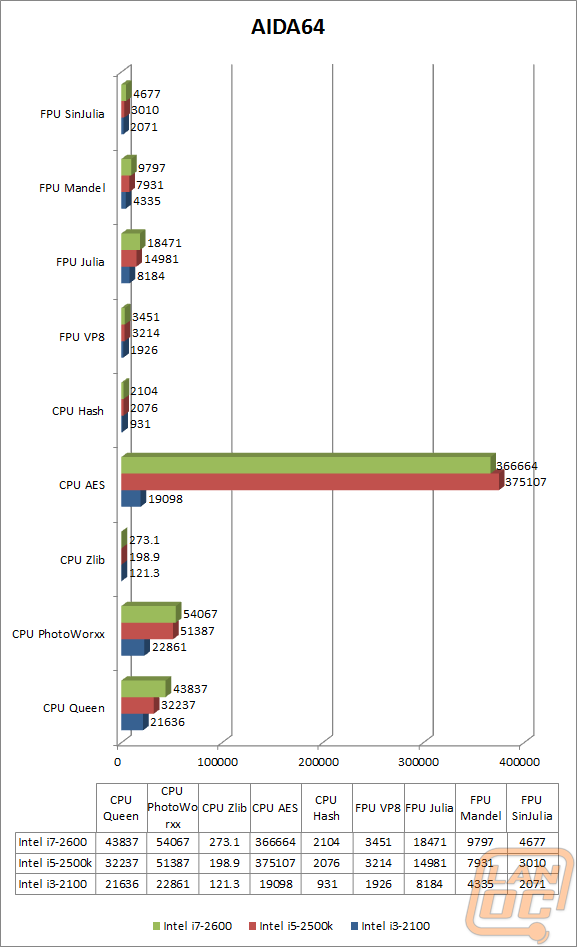
Aida64 – Formally Everest ADIA64 is a full benchmark suite. For CPU benchmarking we run CPU Queen, CPU PhotoWorxx, CPU ZLib, CPU AES, CPU Hash, FPU VP8, FPU Julia, FPU Mandel, and FPU SinJulia.
Breakdowns on each benchmark from AIDA64
CPU Queen – “This simple integer benchmark focuses on the branch prediction capabilities and the misprediction penalties of the CPU. It finds the solutions for the classic "Queens problem" on a 10 by 10 sized chessboard. At the same clock speed theoretically the processor with the shorter pipeline and smaller misprediction penalties will attain higher benchmark scores. For example -- with HyperThreading disabled -- the Intel Northwood core processors get higher scores than the Intel Prescott core based ones due to the 20-step vs 31-step long pipeline. CPU Queen test uses integer MMX, SSE2 and SSSE3 optimizations.”
CPU PhotoWorxx - It performs the following tasks on a very large RGB image:
-Fill
-Flip
-Rotate 90 degrees CW
-Rotate 90 degrees CCW
-Fill the image with random colored pixels
-Color to black & white conversion
-Difference
-Crop
This benchmark stresses the integer arithmetic and multiplication execution units of the CPU and also the memory subsystem. Due to the fact that this test performs high memory read/write traffic, it cannot effectively scale in situations where more than 2 processing threads used. For example, on a 8-way Pentium III Xeon system the 8 processing threads will be "fighting" over the memory, creating a serious bottleneck that would lead to as low scores as a 2-way or 4-way similar processor based system could achieve. CPU PhotoWorxx test uses only the basic x86 instructions, and it is HyperThreading, multi-processor (SMP) and multi-core (CMP) aware.
CPU ZLib - This integer benchmark measures combined CPU and memory subsystem performance through the public ZLib compression library. CPU ZLib test uses only the basic x86 instructions, and it is HyperThreading, multi-processor (SMP) and multi-core (CMP) aware.
CPU AES - This benchmark measures CPU performance using AES (Advanced Encryption Standard) data encryption. In cryptography AES is a symmetric-key encryption standard. AES is used in several compression tools today, like 7z, RAR, WinZip, and also in disk encryption solutions like BitLocker, FileVault (Mac OS X), TrueCrypt.
CPU AES test uses only the basic x86 instructions, and it's hardware accelerated on VIA PadLock Security Engine capable VIA C3, VIA C7, VIA Nano and VIA QuadCore processors; and on Intel AES-NI instruction set extension capable processors. The test is HyperThreading, multi-processor (SMP) and multi-core (CMP) aware.
CPU Hash - This benchmark measures CPU performance using the SHA1 hashing algorithm defined in the Federal Information Processing Standards Publication 180-3. The code behind this benchmark method is written in Assembly, and it is optimized for every popular AMD, Intel and VIA processor core variants by utilizing the appropriate MMX, MMX+/SSE, SSE2, SSSE3, AVX or XOP instruction set extension. CPU Hash benchmark is hardware accelerated on VIA PadLock Security Engine capable VIA C7, VIA Nano and VIA QuadCore processors.
FPU VP8 Benchmark -This benchmark measures video compression performance using the Google VP8 (WebM) video codec Version 0.9.5 (http://www.webmproject.org). FPU VP8 test encodes 1280x720 pixel ("HD ready") resolution video frames in 1-pass mode at 8192 kbps bitrate with best quality settings. The content of the frames are generated by the FPU Julia fractal module. The code behind this benchmark method utilizes the appropriate MMX, SSE2 or SSSE3 instruction set extension, and it is HyperThreading, multi-processor (SMP) and multi-core (CMP) aware.
FPU Julia Benchmark - This benchmark measures the single precision (also known as 32-bit) floating-point performance through the computation of several frames of the popular "Julia" fractal. The code behind this benchmark method is written in Assembly, and it is extremely optimized for every popular AMD, Intel and VIA processor core variants by utilizing the appropriate x87, 3DNow!, 3DNow!+, SSE, AVX or FMA4 instruction set extension. FPU Julia test is HyperThreading, multi-processor (SMP) and multi-core (CMP) aware.
FPU Mandel Benchmark - This benchmark measures the double precision (also known as 64-bit) floating-point performance through the computation of several frames of the popular "Mandelbrot" fractal. The code behind this benchmark method is written in Assembly, and it is extremely optimized for every popular AMD, Intel and VIA processor core variants by utilizing the appropriate x87, SSE2, AVX or FMA4 instruction set extension. FPU Mandel test is HyperThreading, multi-processor (SMP) and multi-core (CMP) aware.
FPU SinJulia Benchmark - This benchmark measures the extended precision (also known as 80-bit) floating-point performance through the computation of a single frame of a modified "Julia" fractal. The code behind this benchmark method is written in Assembly, and it is extremely optimized for every popular AMD, Intel and VIA processor core variants by utilizing trigonometric and exponential x87 instructions. FPU SinJulia is HyperThreading, multi-processor (SMP) and multi-core (CMP) aware.
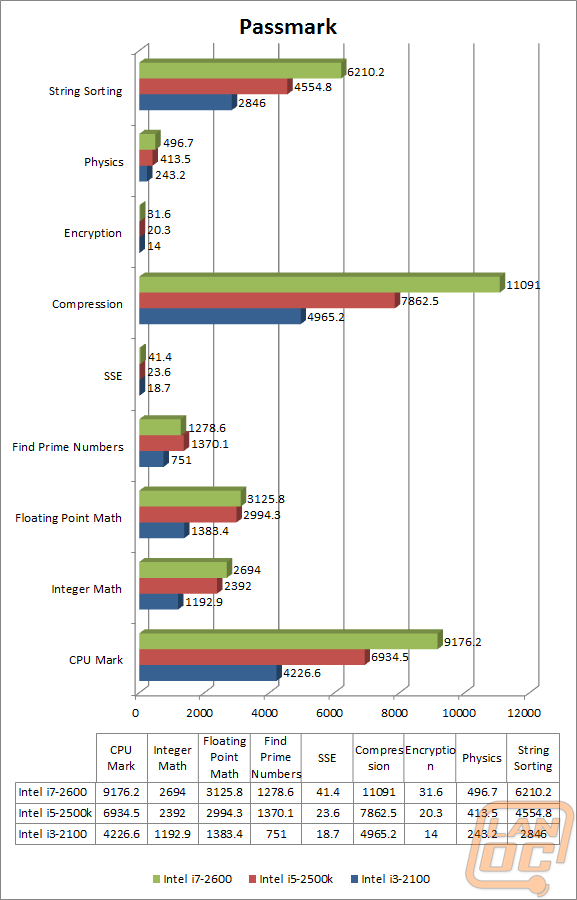
CPU Mark
Integer Math
Floating Point Math
Find Prime Numbers
SSE
Compression
Encryption
Physics String Sorting
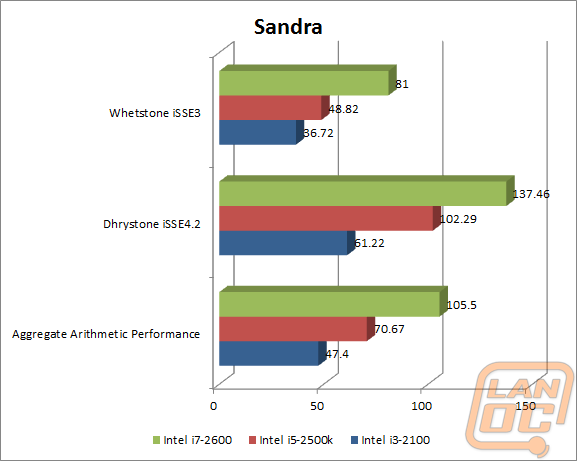
Sandra - We use Sandra’s software specifically for their Arithmetic testing on the CPU. Whetstone testing is great to see how well a CPU can handle floating-point arithmetic. We also do Dhrystone that is similar but for integer and string operations.
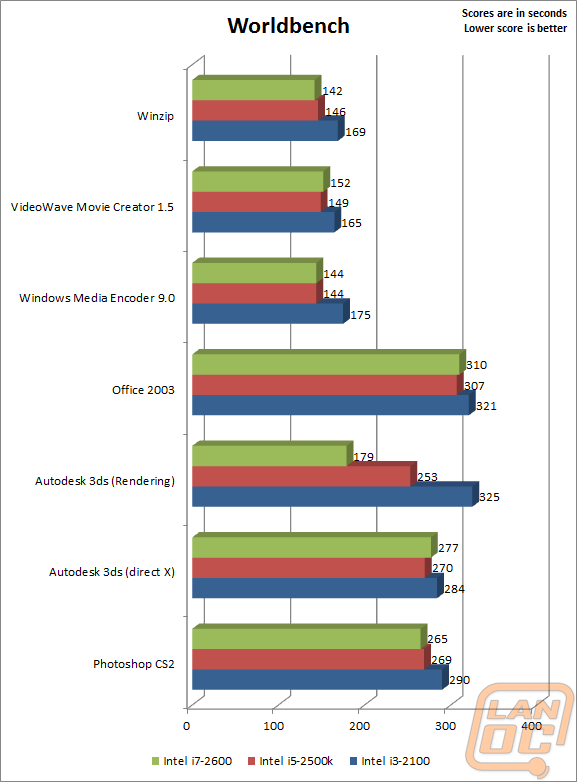
Designed by the guys behind PCWorld, Worldbench is a benchmark designed to use applications and utility’s that everyone uses day to day and benchmark their performance. This gives the most accurate REAL world results, something that no other benchmark does. Being fully automated, WorldBench 6's application tests are scripted to run consecutively, and those results are automatically combined and compared against a baseline system. Popular applications like Microsoft Office, Adobe Photoshop and Mozilla Firefox are each used as they would be in real-world situations to comprise the final WorldBench score.
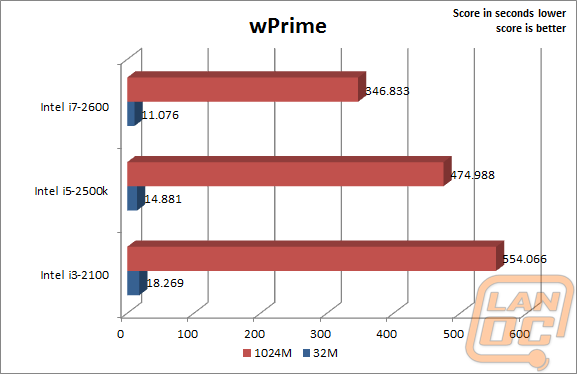
WPrime – Perfect for testing the multithreading of multiple core CPU’s. “wPrime uses a recursive call of Newton's method for estimating functions, with f(x)=x2-k, where k is the number we're sqrting, until Sgn(f(x)/f'(x)) does not equal that of the previous iteration, starting with an estimation of k/2. It then uses an iterative calling of the estimation method a set amount of times to increase the accuracy of the results. It then confirms that n(k)2=k to ensure the calculation was correct. It repeats this for all numbers from 1 to the requested maximum.”
X264 HD – X264 HD is a CPU encoding benchmark. Using the x264 codec this test encodes a video file and times its performance.
Overall Synthetic Benchmarks
We run the entire collection of futuremark’s PC and 3D benchmarks. Although they are synthedic, they do run consistant benchmarks on both in-game performance and PC performance. Their new PCMark 7 does an amazing job of testing real world programs including web page loading speed and other activities nearly everyone does on their PC daily.
3DMark Vantage Performance
3DMark Vantage High
3DMark Vantage 2011 Performance
3DMark Vantage 2011 Extreme
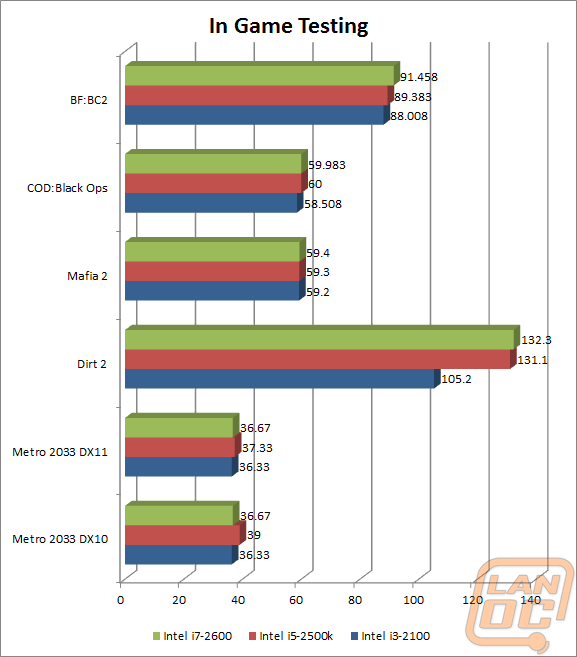
In Game Tests
Call Of Duty Black Ops (1920x1080 – high settings, first scene starting after the cut scene, recorded using fraps)
Battlefield Bad Company 2 (1920x1080 – high settings, first scene starting after the cut scene, recorded using fraps)
Dirt 2 (1920x1080 – 4x MSAA – high settings, in-game benchmark)
Metro 2033 DX11 test (built-in benchmark, 1920 x 1080; DirectX: DirectX 11; Quality: Very High; Antialiasing: MSAA 4X; Texture filtering: AF 4X; Advanced PhysX: Enabled; Tessellation: Enabled; DOF: Disabled)
Metro 2033 DX10 test (built-in benchmark, 1920 x 1080; DirectX: DirectX 10; Quality: Very High; Antialiasing: MSAA 4X; Texture filtering: AF 4X; Advanced PhysX: Enabled; Tessellation: Enabled; DOF: Disabled)
Mafia 2 (built-in benchmark, 1920x1080, PhysX on, high settings)
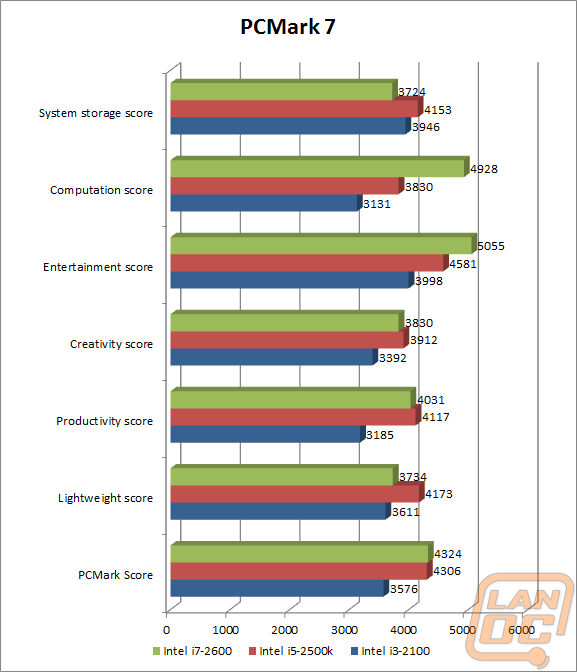
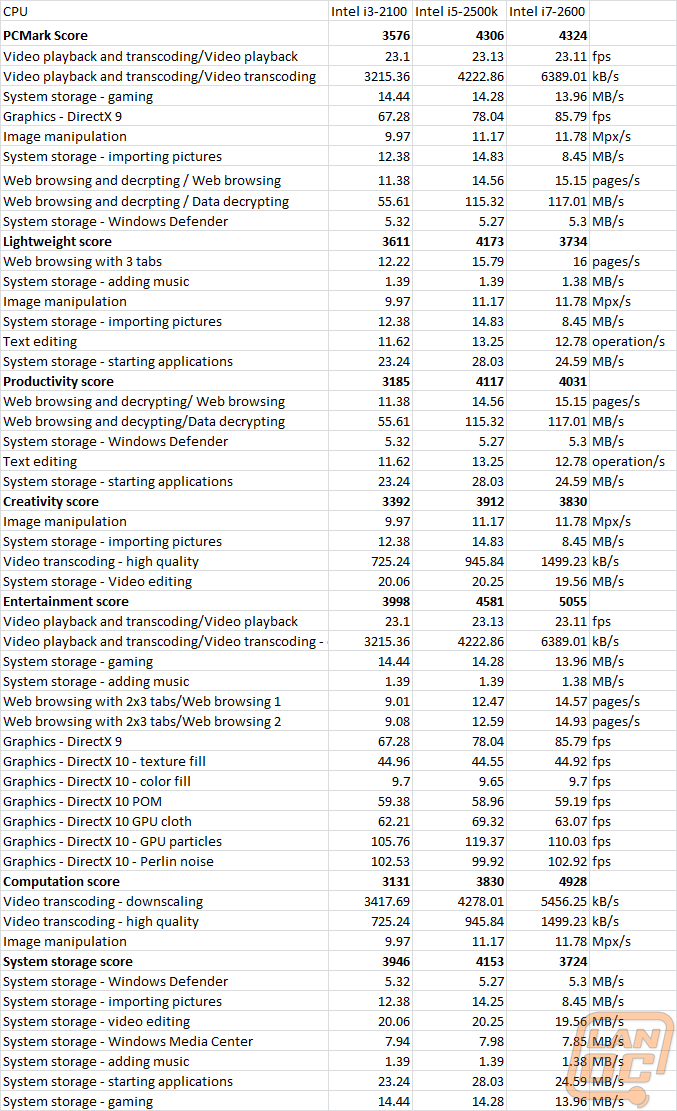
Even at a quick glance at our performance numbers from our Aida64 testing it is easy to see the difference in performance between the three CPU’s. On every test the difference between the i3-2100 and the i5-2500 is CONSIDERABLY bigger than the small jump in performance to the i7-2600. The most notable of course is the AES (Advanced Encryption Standard) test. Both the i5-2500 and i7-2600 have Intels AES New Instructions that give them a major boost over the i3-2100. If you plan on spending a lot of time encrypting files or zipping up files the i5 and i7 would give you the most noticeable gains.
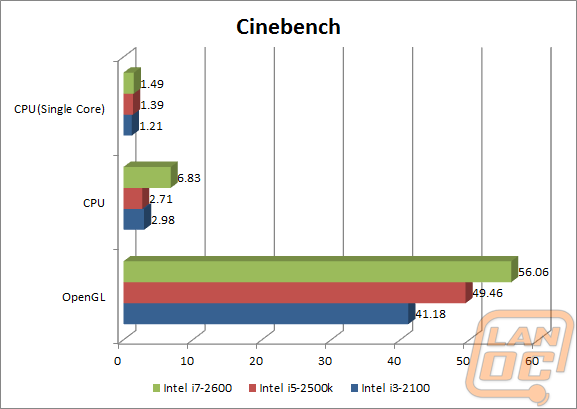
Our CPU and OpenGL(GPU) benchmarks gave us a few interesting results. The single core benchmark came out as expected given each CPU’s increase in clock speed. The full CPU test was a little more interesting showing the i5-2500 coming in behind the dual core i3-2100. There isn’t much of an explanation for this, but the difference is minimal when compared to the i7-2600’s performance of double the other two. Also interesting was the OpenGL testing or GPU testing. We saw an increase for each CPU going up to the i7. With this being a GPU test I found this interesting. It’s clear in this case that even just playing back rendered video is going to benefit from running the i7-2600.
With Passmark’s tests we saw more of the same. This time around the i7-2600 finally showed off its increased Cache and Hyperthreading against the i5-2500 in compression and string sorting, because of that the overall score was over 2000 marks ahead.
Sandra’s Arithmetic testing had a fairly consistent increase from CPU to CPU, none of the tests had a noticeable decrease or jump in performance.
With these being real world benchmarks they are considerably different than what we see with the other synthetic benchmarks. These benchmarks aren’t specific to any one part of the CPU giving us results for how the CPU’s features work together as a whole. These are timed test meaning the results are all in seconds. The lower the number the better the score. It’s obvious what programs don’t scale as well when comparing the 4 core i5 to the 4 core i7 with Hyperthreading. Some of the tests show little or no improvement between the two but rendering for example shows that Hyperthreading coming in handy.
Once again this is a timed benchmark meaning the lower the score the better. In this case the Hyperthreading on both the i3 and i7 helped considerably. The difference between the i3 and i5 is less than normal. Even though the i3 only has two cores, Hyperthreading gives it a nice boost. The i7 ran away with the test with its four cores and Hyperthreading.
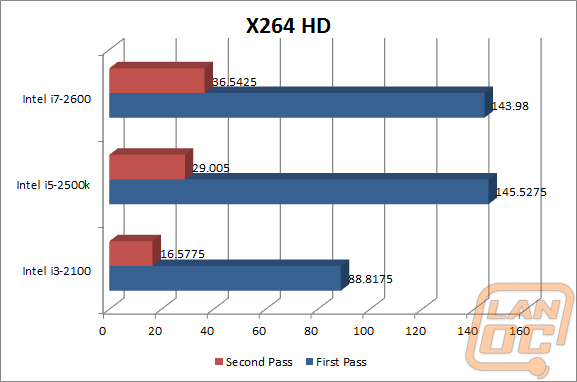
When it comes to video encoding the i5-2500 and i7-2600 one again dominated. Oddly enough the i7’s performance was actually a small amount less than the i5 on the first pass. It did make it up for it on the second pass, but the damage had already been done.
Overall Synthetic Benchmarks
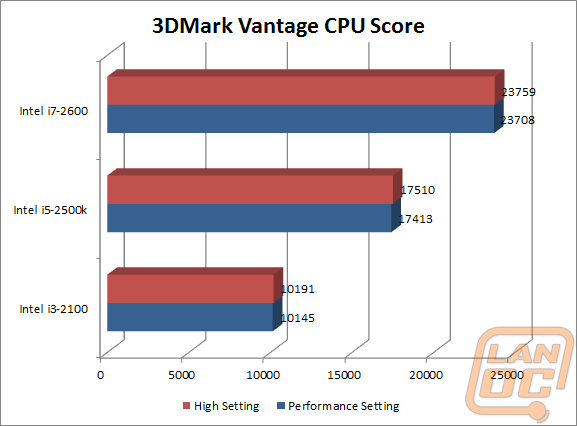
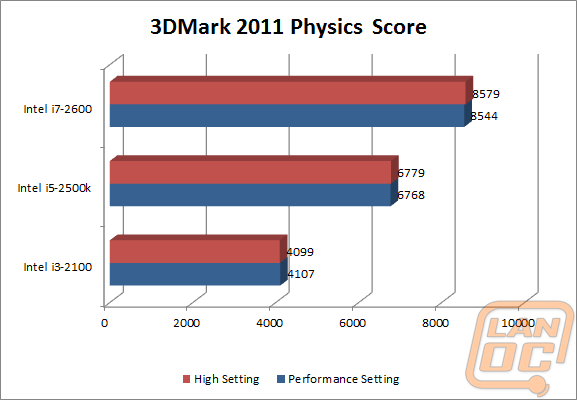
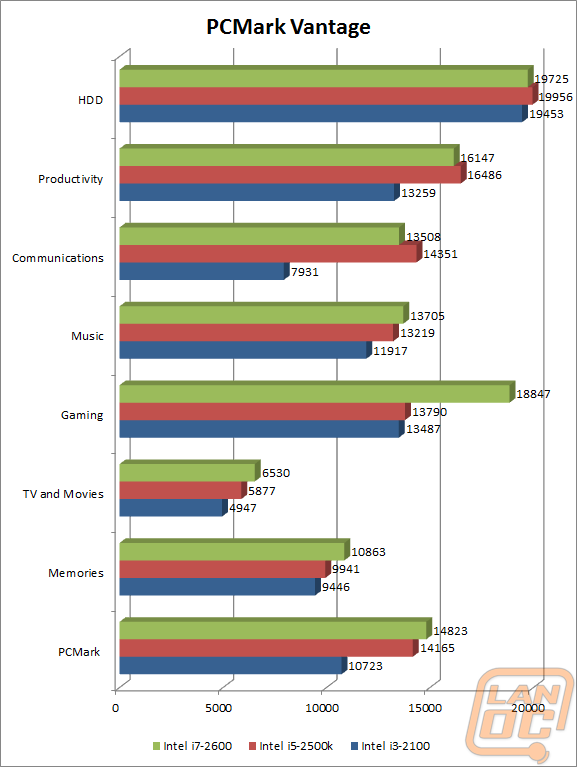
The PCmark Vantage and PCMark 7 overall scores really sum it all up. The i5 and i7 once again perform very similarly. 3DMark on the other hand shows nice consistent steps in performance between the three CPU’s in all four of our benchmarks. They are so consistent that you could easily place them over each other and have the same pattern. I’m guessing that the CPU testing didn’t change much from 3DMark Vantage to 3DMark 2011, other than lower scores.
In Game
Most of our in game testing was limited to outside factors like limited GPU performance and with Black Ops, there is a cap on how high your FPS can go in-game. Dirt 2 did an amazing job at showing the difference in power between the three CPU’s. All three performed well but the i5 and i7 stand out with an improvement of almost 30 frames per second. Even so they still were very close in performance showing that Hyperthreading makes no difference to in game performance in any of the games we use to benchmark.
Overall
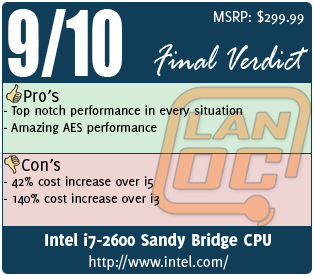
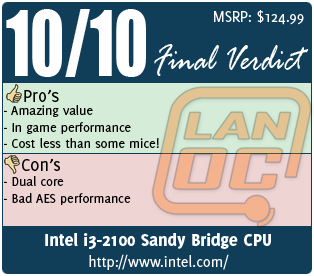
When it’s all said and done your choice in what CPU to buy is very dependant on what you plan on using your PC for. If you will need to do a lot of zipping of files you are going to see a major improvement by going with ether the i5-2500 or the i7-2600. The i7-2600 is going to earn its keep if you will be working with heavily multithreaded programs like Photoshop and rendering software, but if you don’t think you will be doing that to justify the $85 bump in cost over the i5-2500 you won’t miss it. The most impressive thing I found in my testing was the in-game performance from CPU to CPU. As a gamer I want the best hardware for my build to edge every ounce of performance out of every game. As it turns out almost every game we tested showed little or no reason to go with anything beyond the i3-2100. The next time I am looking at a budget build there is a good chance I may be recommending going with the cheaper i3-2100 and putting that extra $175(or $85 if you were coming from the i5) toward a better video card. That’s the most impressive thing: Intel managed to put together a nice selection of CPU’s ranging from just under $125 to almost $300 that ALL perform great.
For value as a gamer the i3-2100 blows my mind. But if you are looking for top level performance on a budget the i5-2500 is the CPU. The difference in performance between the i5 and the i3 gives a noticeable boost in all of our non-gaming benchmarks. The same can’t be said for the jump from i5 to i7. Even though there is a noticeable improvement in a few situations, most of our benchmarks only show a slight boost for the small clock jump. Because of that the i7-2600 can only be recommended when under a much looser budget, it’s hard to pay 42% more for the i7 and only see around 5% increase in performance in most cases.

For our i5 Final Verdict please take a look at our original review HERE