Performance
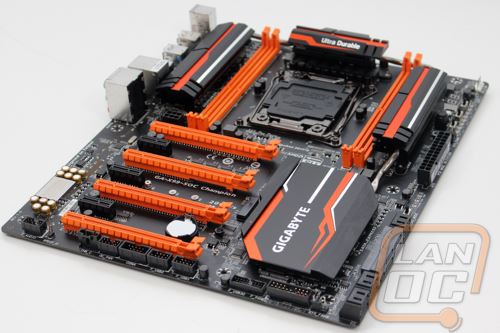
Once I spent a little time getting to know the X99 SOC Champion I did have to run it through our standard performance testing. This includes a variety of benchmarks both CPU and Gaming related to see how well everything runs. As a whole, these results don’t typically show any major differences between motherboards as long as things are running well, but they do help pinpoint any potential issues. In this case the SOC Champion ran through 3DMark without any issues with results on par with the other X99 boards. The same goes with PCMark 8, matching the numbers of the MSI MPower. In Passmark the MPower was slightly ahead but close enough to be considered a margin of error in the benchmark. Then when I got into actual in game testing the SOC Champion was spot on with the competition. All in all the board performed well and gives us a great idea of what to expect if you pair it up with a 5960X and a GTX 780 like our testbench.
|
3DMark |
||||
|
Motherboard |
Overall Score |
Graphics Score |
Physics Score |
|
|
Asus X99 Deluxe |
8959 |
9738 |
16185 |
|
|
EVGA X99 Classified |
8963 |
9753 |
16075 |
|
|
MSI X99S MPower |
8992 |
9801 |
16009 |
|
|
Gigabyte X99 SOC Chamption |
8956 |
9728 |
16196 |
|
|
PCMark 8 Home Accelerated Score |
||||
|
Asus X99 Deluxe |
4183 |
|||
|
EVGA X99 Classified |
4272 |
|||
|
MSI X99S MPower |
4697 |
|||
|
Gigabyte X99 SOC Chamption |
4659 |
|||
|
Passmark Overall Score |
||||
|
Asus X99 Deluxe |
4975.9 |
|||
|
EVGA X99 Classified |
4981.2 |
|||
|
MSI X99S MPower |
5016.1 |
|||
|
Gigabyte X99 SOC Chamption |
4981.8 |
|||
|
Bioshock Infinite Average FPS |
||||
|
Asus X99 Deluxe |
100.48 |
|||
|
EVGA X99 Classified |
98.23 |
|||
|
MSI X99S MPower |
106.25 |
|||
|
Gigabyte X99 SOC Chamption |
106.08 |
|||
|
Tomb Raider Average FPS |
||||
|
Asus X99 Deluxe |
56.7 |
|||
|
EVGA X99 Classified |
56.9 |
|||
|
MSI X99S MPower |
57.2 |
|||
|
Gigabyte X99 SOC Chamption |
57.5 |
|||
|
Hitman: Absolution Average FPS |
||||
|
Asus X99 Deluxe |
46.6 |
|||
|
EVGA X99 Classified |
46.7 |
|||
|
MSI X99S MPower |
46.7 |
|||
|
Gigabyte X99 SOC Chamption |
44.7 |
|||
|
Sleeping Dogs Average FPS |
||||
|
Asus X99 Deluxe |
61.5 |
|||
|
EVGA X99 Classified |
62.0 |
|||
|
MSI X99S MPower |
61.3 |
|||
|
Gigabyte X99 SOC Chamption |
61.2 |
|||
