 I entered the world of computer gaming with a well-justified custom laptop my freshman year of college. The urge to build my own PC inevitably began to grow as I traveled to LAN parties and saw the creation of others. My first board was a hand-me-down Biostar with a lot of life yet to give. Five years later, it’s fitting that my first build with Sandy Bridge-E is from that company‘s first socket 2011 board, the TPower X79. The TPower X79 is one of Biostars first attempts to branch out beyond the budget boards they are known for. I am excited to see what direction they will do and how it will perform.
Product Name: Biostar TPower X79
Review Sample Provided by: Biostar
Review by: Adam and Wes
Pictures by: Adam
Specifications
|
Chipset |
Intel X79 |
|
CPU SUPPORT |
2nd Generation Intel® Core™ i7 LGA 2011 Processor Maximum CPU TDP (Thermal Design Power) 130Watt |
|
MEMORY |
Support Quad Channel DDR3 2400(OC)/2133(OC)/1866(OC)/1600/ 1333 /1066 MHz 4 x DDR3 DIMM Memory Slot Max. Supports up to 32GB Memory |
|
EXPANSION SLOT |
3 x PCI-E x16 3.0 Slot (x16, 16, x8 )4 WAY CFX, 3 WAY SLI 2 x PCI-E x1 2.0 Slot 1 x PCI Slots |
|
STORAGE |
4 x SATA3 6Gb/s Connector 3 x SATA2 3Gb/s Connector 1 x eSATA2 3Gb/s Connector Support SATA RAID: 0,1,5,10 |
|
USB |
ASMedia ASM1042 USB 3.0 controller 6 x USB 3.0 Port 1 x USB 3.0 Header 2 x USB 2.0 Port 2 x USB 2.0 Header |
|
GbE |
Realtek RTL8111E - 10/100/1000 Controller |
|
MULTI GRAPHICS |
AMD 4-Way CrossFireX NVIDIA 3-Way SLI |
|
CODEC |
Realtek ALC898 8 Channel Blu-ray Audio |
|
REAR I/O |
1 x PS/2 Keyboard 1 x eSATA2 3Gb/s Connector 6 x USB 3.0 Port 2 x USB 2.0 Port 1 x RJ-45 Port 6 x Audio Connector 1 x S/PDIF Out Port |
|
INTERNAL I/O |
1 x USB 3.0 Header 2 x USB 2.0 Header 4 x SATA3 6Gb/s Connector 3 x SATA2 3Gb/s Connector 1 x Front Audio Header 1 x Front Panel Header 1 x S/PDIF-OUT Header 1 x CPU FAN Header 2 x System FAN Header 1 x Serial Header 1 x CIR Header |
|
DIMENSION |
ATX Form Factor Dimension: 30.5cm x 24.4cm ( W x L ) |
|
OS SUPPORT |
Support Windows XP / Vista / 7 |
|
ACCESSORIES |
6 x SATA Cable 1 x SLI Connector 1 x CrossFire Connector 1 x I/O Shield 1 x CD Driver 1 x User Manual |
|
FEATURES |
Supports uEFI GUI Interface BIOS Supports THX TruStudio Pro Supports BIO-Remote2 Supports BIO-Remote Supports Space-Pipe Thermal solution Supports 100% Solid capacitor Supports Puro Tone HD Audio Technology Supports Rapid Switch2 Supports Rapid Debug3 Supports BIOS-Flasher Supports BIOS-Relife Supports Toverclcoker OC software Supports Charger Booster |
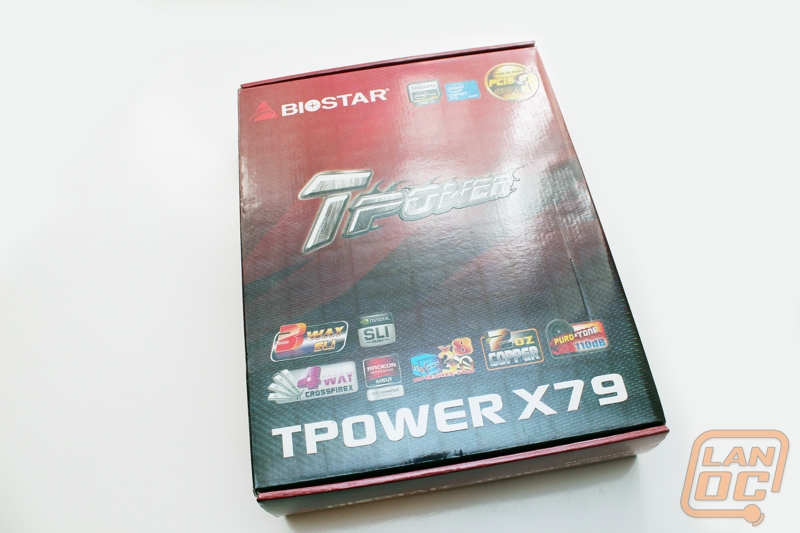
Packaging
Biostar has fashioned a really nice looking package for its maiden socket 2011 board. Amid the crimson background and hot 'TPower' logo, the paperboard is littered with badges galore detailing the different features of the board, such as 3-way SLI and 4-way CrossfireX support, PCIe3, and the support for Sandy Bridge-E processors on LGA 2011 socket.
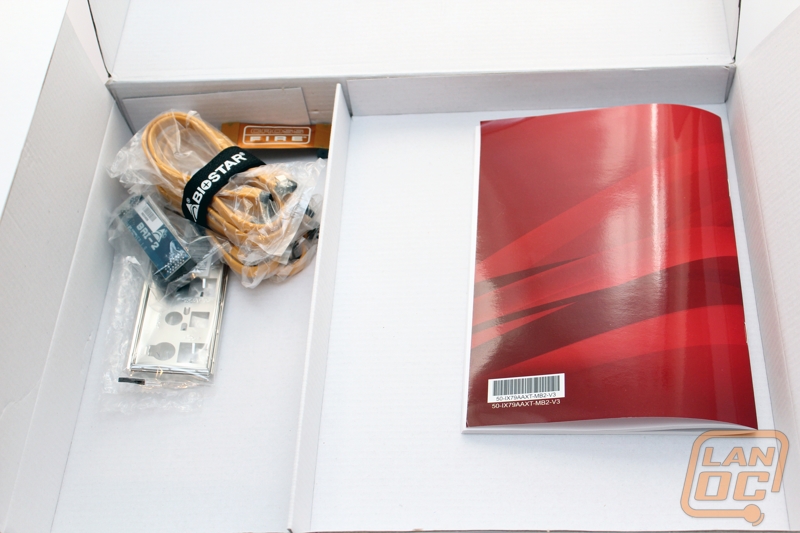
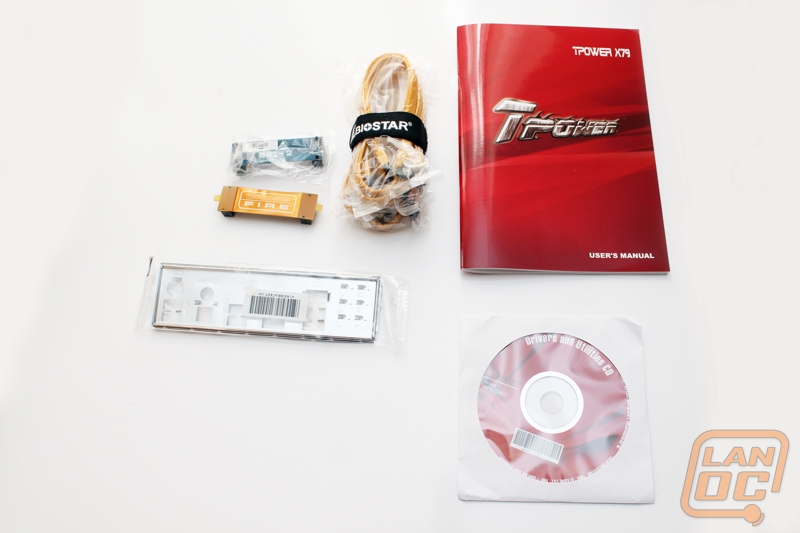
Opening the box clamshell-style reveals another cardboard container with doors containing the user manual and driver/utility CD and included accessories: a bundle of yellow SATA cables (six in total), SLI and CrossFire bridges, and rear I/O panel cover.
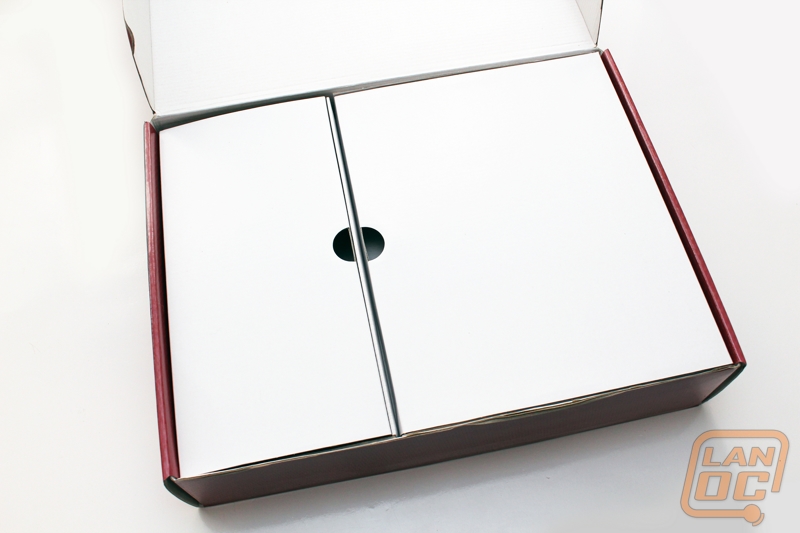
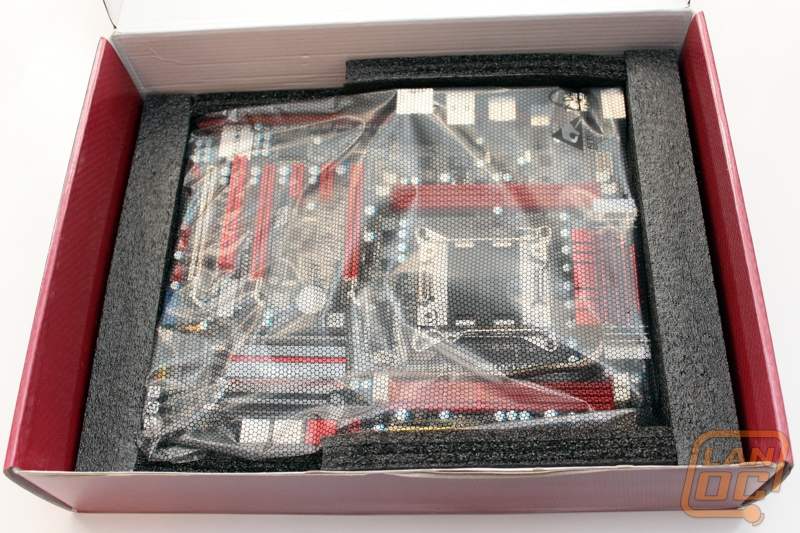
The TPower X79 is securely tucked away under the accessories box, cushioned on all edges with foam placeholders and wrapped in an anti-ESD bag.
BIOS
For the TPower X79 Biostar went with a UEFI Bios meaning you can use your mouse or keyboard or any combination of the two. As you can see in the video below we went with using a combination of the two. The Bios itself actually fits the red and grey theme of the board and is packed full of features that we would find on any other enthusiast class board. I also love that they didn’t go overboard with the mouse integration while still making it easy to use.
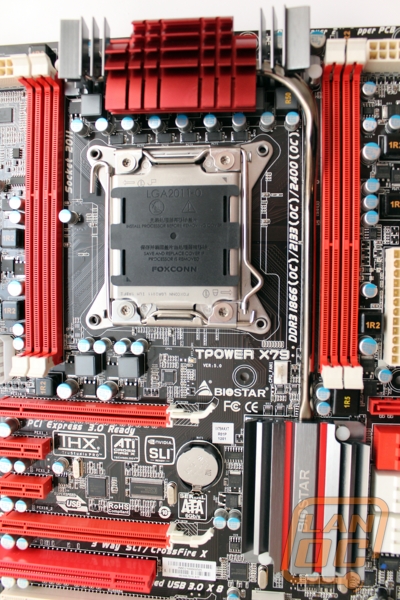
Board Layout
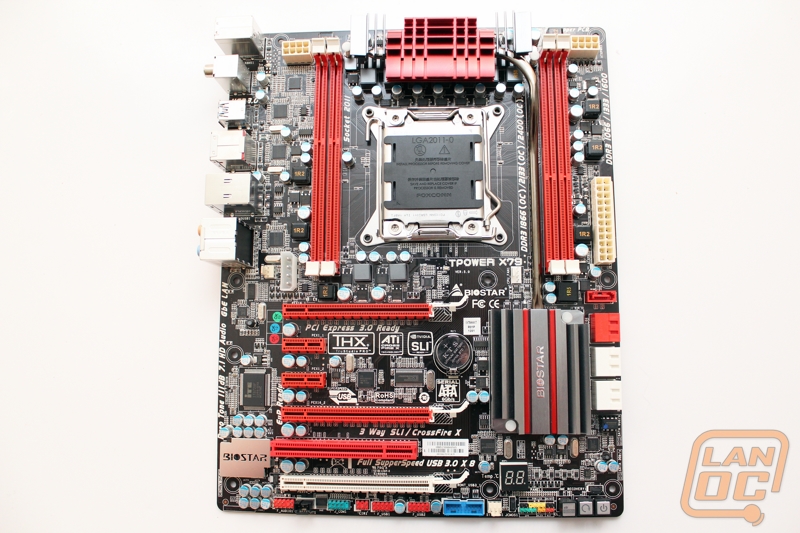
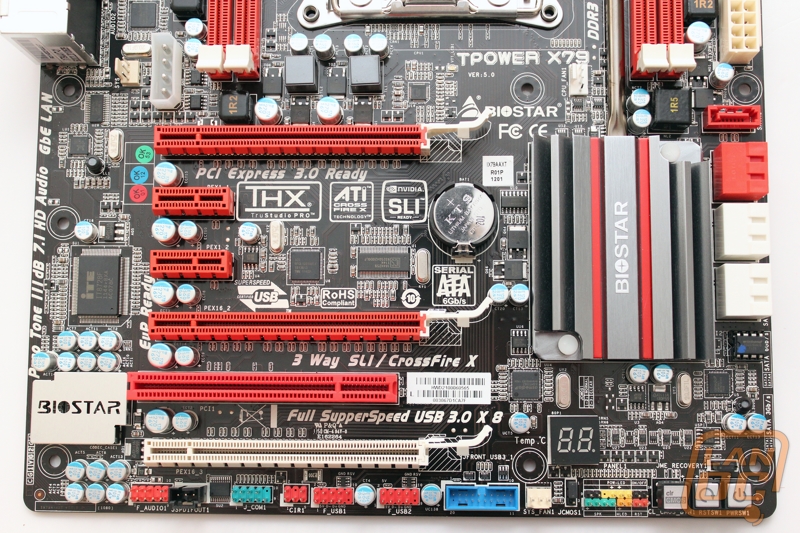
Getting an overall look on the board it’s hard to not notice the variety of colors Biosstar has used on the TPower X79. You have grey and red in the cooling along with white, blue, red, and even yellow being used on various headers and slots around the board. This is something we used to see more in the past, more recently manufactures have started to use more subtle and muted colors. That’s not to say that the board doesn’t look good, it’s just before you close some of that up, it’s a lot to take in.
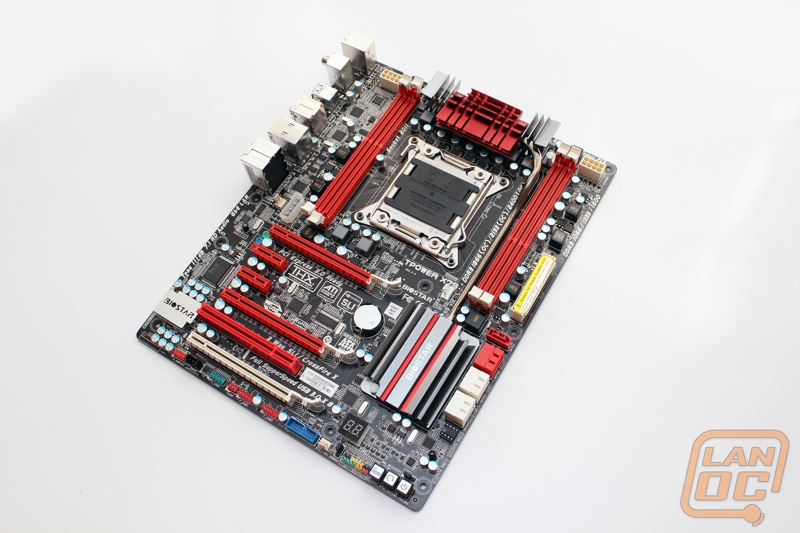
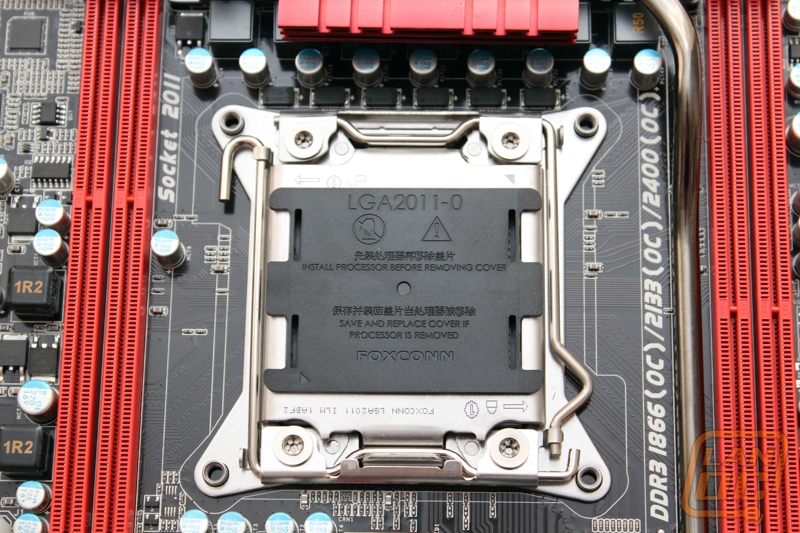
As with every other LGA 2011 board you have the standard dual spring design that takes a little practice to get used to.
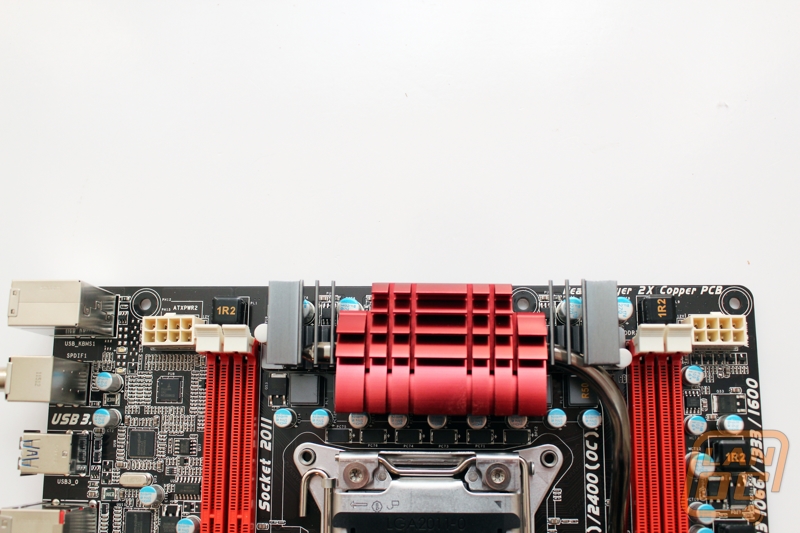
Starting up top, you can see both of the boards 8 pin power connections. The fact that Biostar is putting two power connections on at all is a big clue that this isn’t your standard budget board like what we would normally see from them. I don’t like the use of the white on them, but once you have your power hooked up you won’t be able to see the white anyhow. Oddly enough, we would normally see a CPU fan header up in this area but this board has the CPU fan header on the bottom side of the CPU socket.
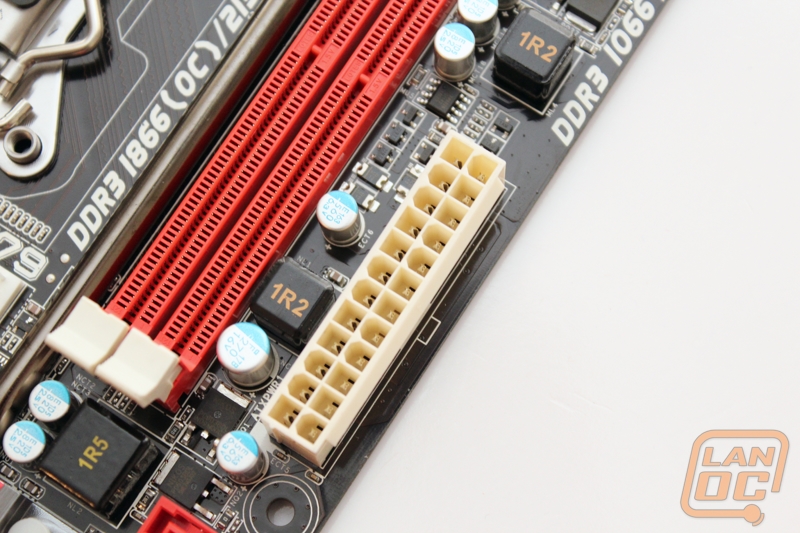
Next to the boards four dimm slots is the 24 power connection, like the CPU power connections this is in an off white color that I’m not a fan of. But like I said before, once your power connection is hooked up you won’t see this very much.
For internal SATA connections you have a total of four SATA 3 connections in white and three SATA 2 connections in red.
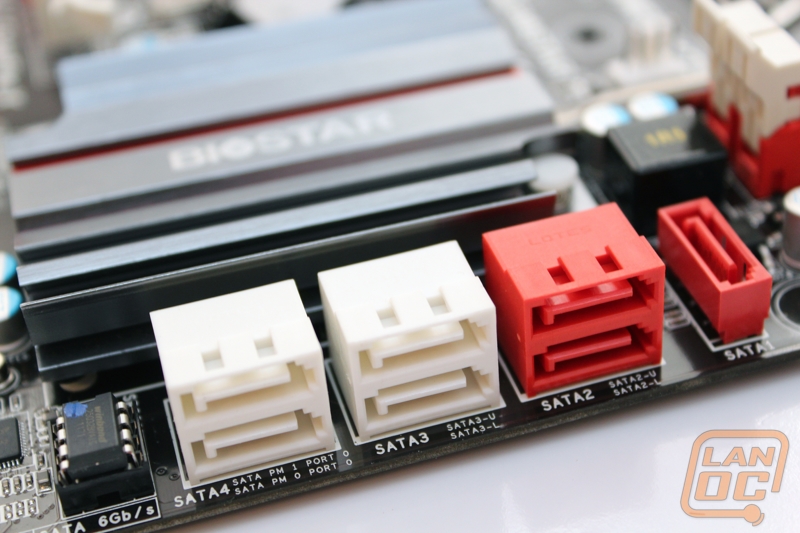
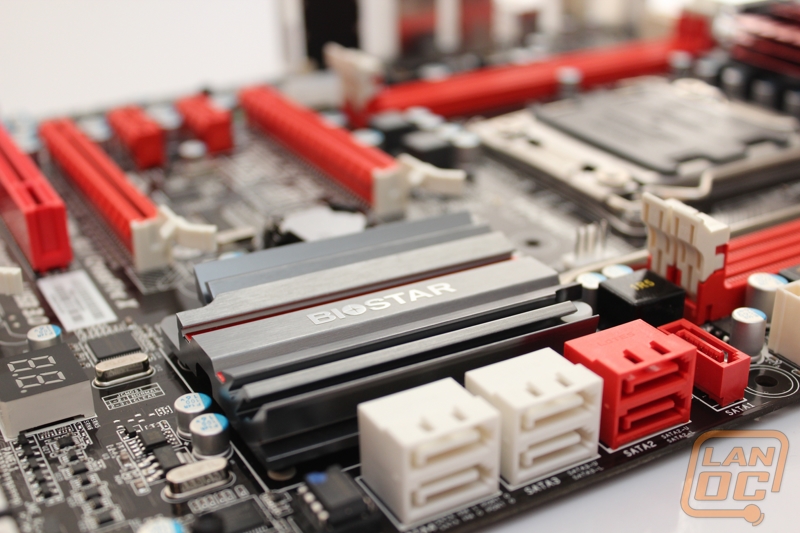
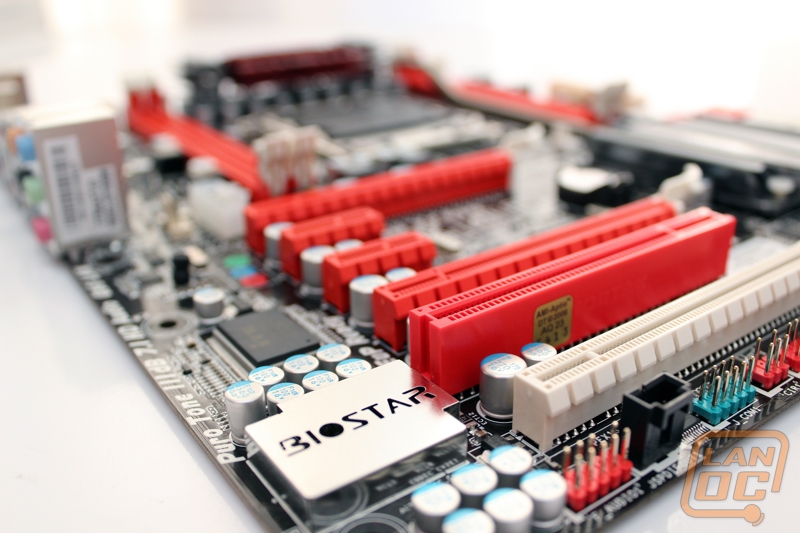
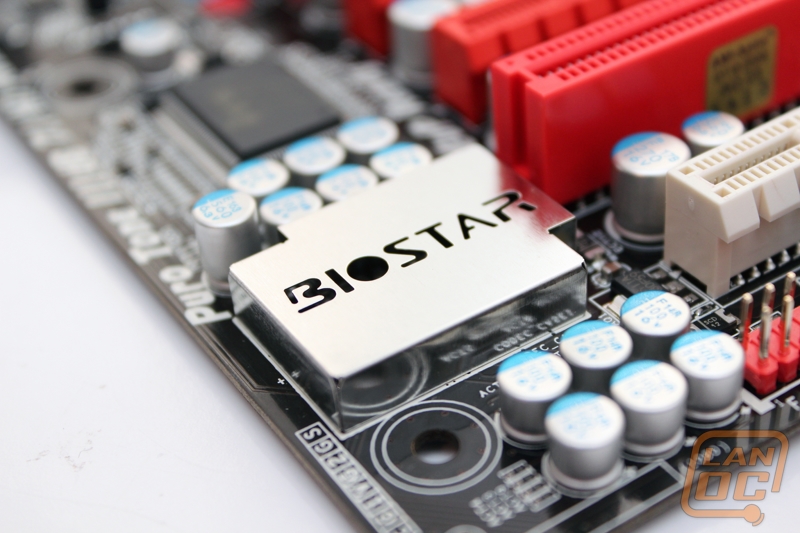
The boards Realtek ALC898 audio is easy to spot with the Biostar logo cut out of the shield.
One thing about the board that stands out from most of the X79 boards we have tested in the past is the use of only four DDR3 dimm slots. Other boards have gone with a total of 8 for even more memory capacity. This shouldn’t be a problem for most but for someone who needs 32+ gigs of ram this could be a sticking point.
Here is a shot of the bottom half of the board. Starting in the top left you can see that Biostar has included a Molex connection to feed more power to the PCI slots if you are overclocking. You won’t have to hook this up normally, but to get the best performance you should. In this image we can actually see all three of the boards fan headers, I would have liked to of seen a few more. Also only the CPU header used a four pin PWN design, meaning your case fans won’t have the same noise saving features. Along the bottom of the board they have lined up all of the USB and audio headers. You have one USB 3.0 header along with two USB 2.0 headers. On the left corner you have your audio header along with the SPDIF. On the right corner you have a color coded front panel connection along with an LED diagnostic readout. You also have three buttons on the far right, power, reset, and clear CMOS. It’s nice that all three are easy to get to and they are also backlit in different colors making them easy to spot.
The PCI slot layout is as follows, with support for three way SLI and Crossfire X
PCI Express x16
PCI Express x1
PCI Express x1
PCI Express x16
PCI
PCI Express x8
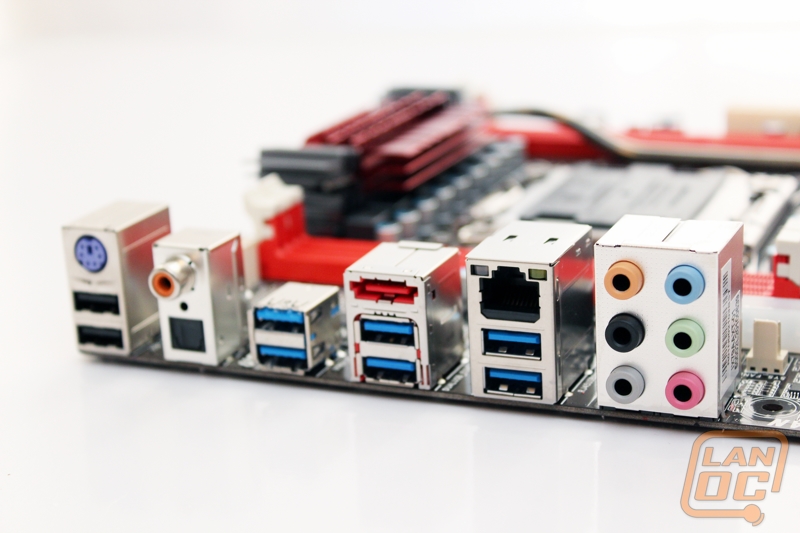
The TPower’s back I/O panel is riddled with USB 3.0 connections with a total of 8 USB connections, 6 out of those 8 are USB 3.0. Beyond that you still have a legacy PS2 connection and the boards 10/100/1000 network connection. Audio ports are fairly standard also with the 6 plugs along with optical. Last but not least they did include a powered eSATA connection on the back in case you have any eSATA devices like I do.
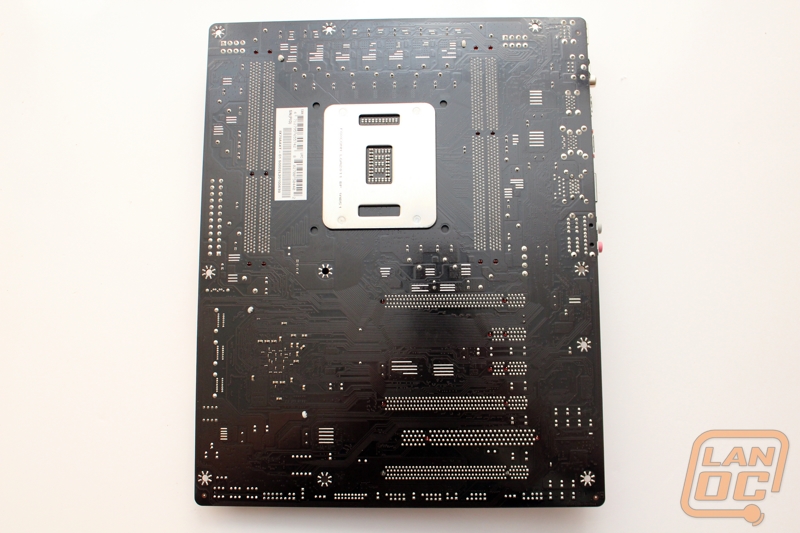
Here is a glimpse of the boards black PCB from behind
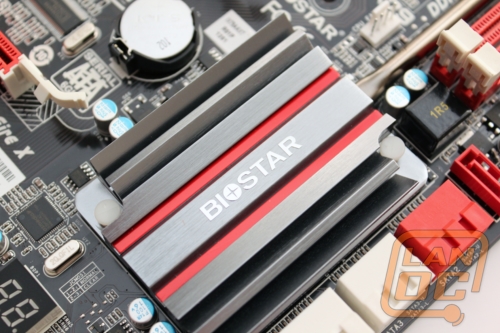
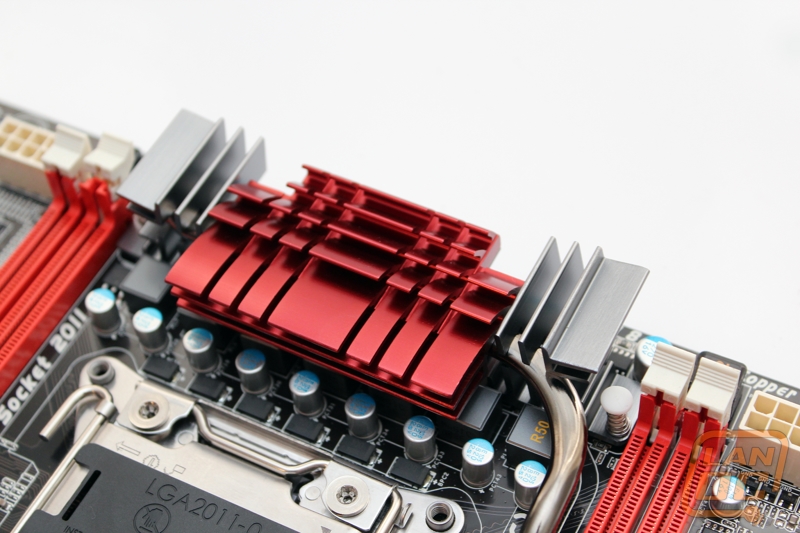
Cooling
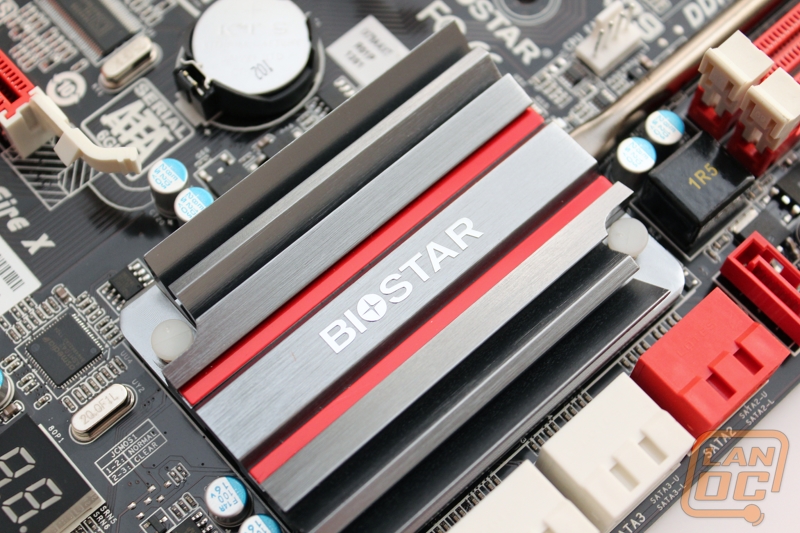
Cooling for the TPower X79 uses a pair of heatsinks joined together with a heatpipe to keep both the boards VRM and chipset cool. As you can see both heatsinks are aluminum and are anodized in a combination of red and dark grey. Not only is this a color combination we haven’t seen before, but it’s a really attractive color combo, Biostar did a good job with the colors.
Our Test Rig
Kingston HyperX DDR3 1600MHz Quad Channel Ram
Two Kingston HyperX SATA 3 SSD’s in RAID 0
Intel Active Thermal Solution RTS2011LC Water-cooling
Cooler Master Silent PRO Gold 1200w PSU
Two Nvidia GTX580’s in SLI
http://www.highspeedpc.com/ Test Bench
Our Testing Procedures
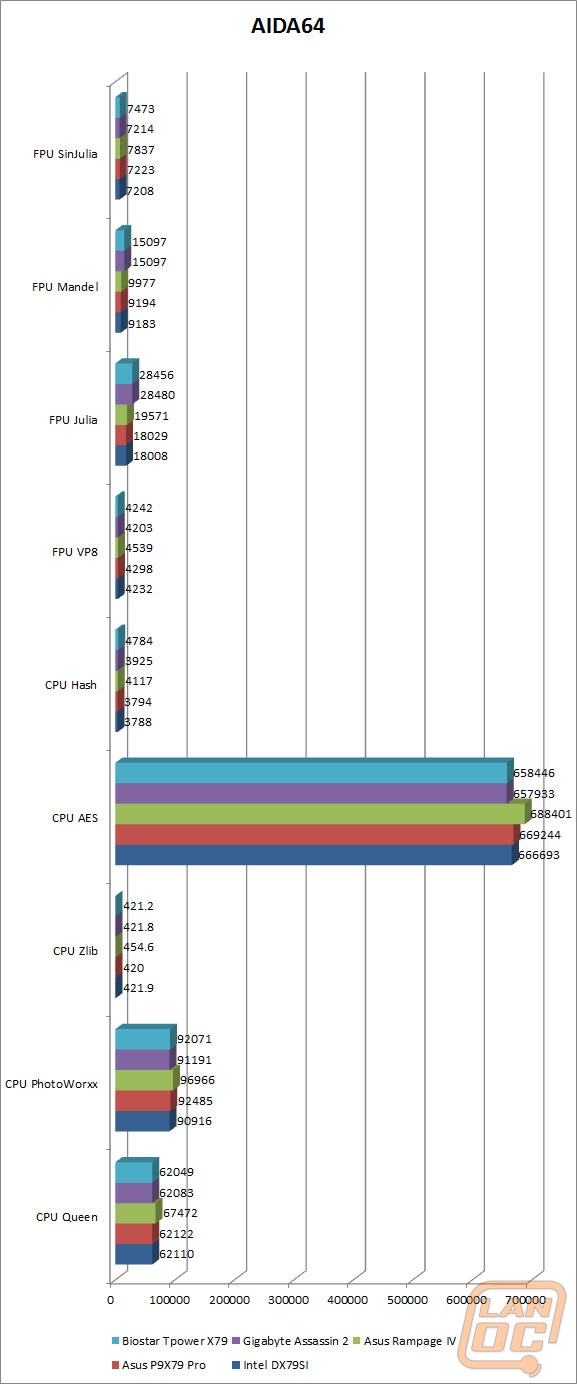
Aida64 – Formally Everest ADIA64 is a full benchmark suite. For CPU benchmarking we run CPU Queen, CPU PhotoWorxx, CPUZLib, CPU AES, CPU Hash, FPU VP8, FPU Julia, FPU Mandel, and FPU SinJulia.
Breakdowns on each benchmark from AIDA64
CPU Queen – “This simple integer benchmark focuses on the branch prediction capabilities and the misprediction penalties of the CPU. It finds the solutions for the classic "Queens problem" on a 10 by 10 sized chessboard. At the same clock speedtheoretically the processor with the shorter pipeline and smaller misprediction penalties will attain higher benchmark scores. For example -- with HyperThreading disabled -- the Intel Northwood core processors get higher scores than the Intel Prescott core based ones due to the 20-step vs 31-step long pipeline. CPU Queen test uses integer MMX, SSE2 and SSSE3 optimizations.”
CPU PhotoWorxx - It performs the following tasks on a very large RGB image:
-Fill
-Flip
-Rotate 90 degrees CW
-Rotate 90 degrees CCW
-Fill the image with random colored pixels
-Color to black & white conversion
-Difference
-Crop
This benchmark stresses the integer arithmetic and multiplication execution units of the CPU and also the memory subsystem. Due to the fact that this test performs high memory read/write traffic, it cannot effectively scale in situations where more than 2 processing threads used. For example, on a 8-way Pentium III Xeon system the 8 processing threads will be "fighting" over the memory, creating a serious bottleneck that would lead to as low scores as a 2-way or 4-way similar processor based system could achieve. CPU PhotoWorxx test uses only the basic x86 instructions, and it is HyperThreading, multi-processor (SMP) and multi-core (CMP) aware.
CPU ZLib - This integer benchmark measures combined CPU and memory subsystem performance through the public ZLib compression library. CPU ZLib test uses only the basic x86 instructions, and it is HyperThreading, multi-processor (SMP) and multi-core (CMP) aware.
CPU AES - This benchmark measures CPU performance using AES (Advanced Encryption Standard) data encryption. In cryptography AES is a symmetric-key encryption standard. AES is used in several compression tools today, like 7z, RAR, WinZip, and also in disk encryption solutions like BitLocker, FileVault (Mac OS X), TrueCrypt.
CPU AES test uses only the basic x86 instructions, and it's hardware accelerated on VIA PadLock Security Engine capable VIA C3, VIA C7, VIA Nano and VIA QuadCore processors; and on Intel AES-NI instruction set extension capable processors. The test is HyperThreading, multi-processor (SMP) and multi-core (CMP) aware.
CPU Hash - This benchmark measures CPU performance using the SHA1 hashing algorithm defined in the Federal Information Processing Standards Publication 180-3. The code behind this benchmark method is written in Assembly, and it is optimized for every popular AMD, Intel and VIA processor core variants by utilizing the appropriate MMX, MMX+/SSE, SSE2, SSSE3, AVX or XOP instruction set extension. CPU Hash benchmark is hardware accelerated on VIA PadLock Security Engine capable VIA C7, VIA Nano and VIA QuadCore processors.
FPU VP8 Benchmark -This benchmark measures video compression performance using the Google VP8 (WebM) video codec Version 0.9.5 (http://www.webmproject.org). FPU VP8 test encodes 1280x720 pixel ("HD ready") resolution video frames in 1-pass mode at 8192 kbps bitrate with best quality settings. The content of the frames are generated by the FPU Julia fractal module. The code behind this benchmark method utilizes the appropriate MMX, SSE2 or SSSE3 instruction set extension, and it is HyperThreading, multi-processor (SMP) and multi-core (CMP) aware.
FPU Julia Benchmark - This benchmark measures the single precision (also known as 32-bit) floating-point performance through the computation of several frames of the popular "Julia" fractal. The code behind this benchmark method is written in Assembly, and it is extremely optimized for every popular AMD, Intel and VIA processor core variants by utilizing the appropriate x87, 3DNow!, 3DNow!+, SSE, AVX or FMA4 instruction set extension. FPU Julia test is HyperThreading, multi-processor (SMP) and multi-core (CMP) aware.
FPU Mandel Benchmark - This benchmark measures the double precision (also known as 64-bit) floating-point performance through the computation of several frames of the popular "Mandelbrot" fractal. The code behind this benchmark method is written in Assembly, and it is extremely optimized for every popular AMD, Intel and VIA processor core variants by utilizing the appropriate x87, SSE2, AVX or FMA4 instruction set extension. FPU Mandel test is HyperThreading, multi-processor (SMP) and multi-core (CMP) aware.
FPU SinJulia Benchmark - This benchmark measures the extended precision (also known as 80-bit) floating-point performance through the computation of a single frame of a modified "Julia" fractal. The code behind this benchmark method is written in Assembly, and it is extremely optimized for every popular AMD, Intel and VIA processor core variants by utilizing trigonometric and exponential x87 instructions. FPU SinJulia is HyperThreading, multi-processor (SMP) and multi-core (CMP) aware.
Cinebench - CINEBENCH is a real-world cross platform test suite that evaluates your computer's performance capabilities. CINEBENCH is based on MAXON's award-winning animation software CINEMA 4D, which is used extensively by studios and production houses worldwide for 3D content creation. The test procedure consists of two main components - the graphics card performance test and the CPU performance test.
Main Processor Performance (CPU)
The test scenario uses all of your system's processing power to render a photorealistic 3D scene (from the viral "No Keyframes" animation by AixSponza). This scene makes use of various algorithms to stress all available processor cores.
In fact, CINEBENCH can measure systems with up to 64 processor threads. ThIS test scene contains approximately 2,000 objects which in turn contain more than 300,000 polygons in total, and uses sharp and blurred reflections, area lights, shadows, procedural shaders, antialiasing, and much more. The result is displayed in points (pts). The higher the number, the faster your processor.
Graphics Card Performance (OpenGL)
This procedure uses a complex 3D scene depicting a car chase (by renderbaron) which measures the performance of your graphics card in OpenGL mode. The performance depends on various factors, such as the GPU processor on your hardware, but also on the drivers used. The graphics card has to display a huge amount of geometry (nearly 1 million polygons) and textures, as well as a variety of effects, such as environments, bump maps, transparency, lighting and more to evaluate the performance across different disciplines and give a good average overview of the capabilities of your graphics hardware. The result given is measured in frames per second (fps). The higher the number, the faster your graphics card.
CPU Mark
Integer Math
Floating Point Math
Find Prime Numbers
SSE
Compression
Encryption
Physics String Sorting
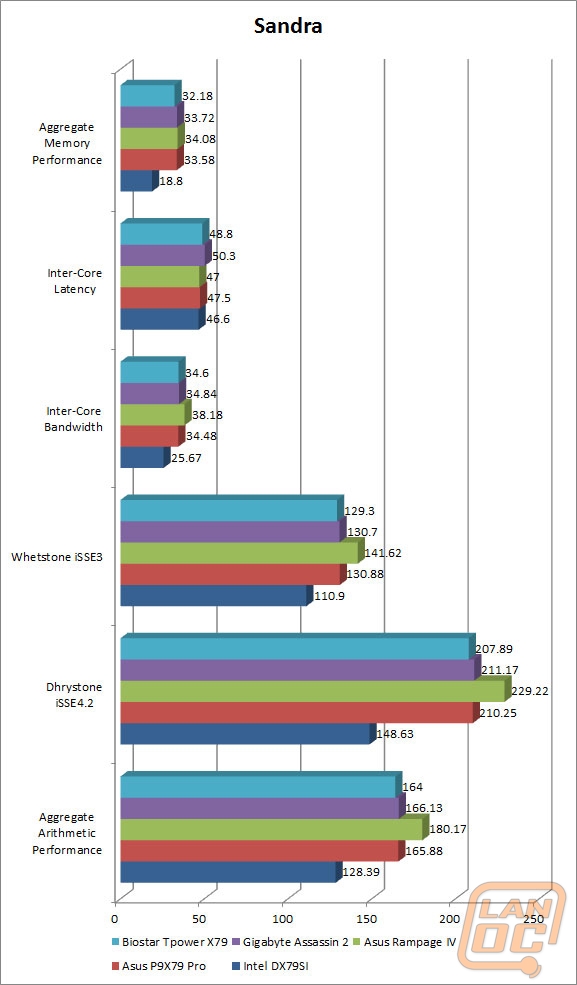
Sandra -
Processor Arithmetic-
Whetstone testing is great to see how well a CPU can handle floating-point arithmetic. We also do Dhrystone that is similar but for integer and string operations.
Multi-Core Efficiency-
A benchmark specifically designed to measure the efficiency of the different multi-core processors with their different architectures as well as compare their performance to traditional multi-processor (SMP) systems.
Performance measuring benchmarks do not show at-a-glance the differences between multi-core processors and how multi-threading programs should be designed to best take advantage of the underlying architecture while avoiding the "gotchas" .
This benchmark does not test processor unit computational performance, i.e. how fast the cores of the processors are; it tests how fast the connection between them is only.
Memory Bandwidth-
Sandra's algorithm is multi-threaded on SMP/SMT systems. This works by splitting the arrays and letting each thread work on its own bit. Sandra creates a thread for each CPU in the system and assignes each thread to an individual CPU.
Another difference is the aggressive use of sheduling/overlapping of instructions in order to maximise memory throughput even on "slower" processors. The loops should always be memory bound rather than CPU bound on all modern processors.
The other major difference is the use of alignment. Sandra dynamically changes the alignment of streams until it finds the best combination, then it repeatedly tests it to estimate the maximum throughput of the system. You can change the alignment in STREAM and recompile - but generally it is set to 0 (i.e. no).
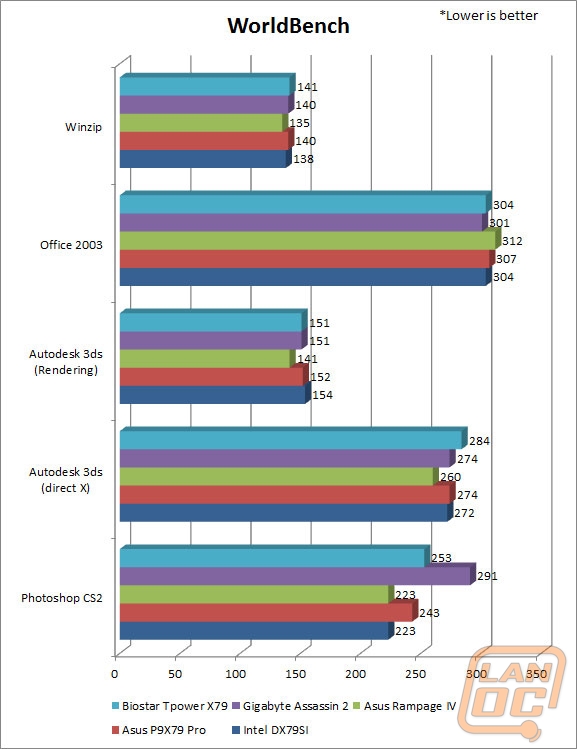
Designed by the guys behind PCWorld, Worldbench is a benchmark designed to use applications and utility’s that everyone uses day to day and benchmark their performance. This gives the most accurate REAL world results, something that no other benchmark does. Being fully automated, WorldBench 6's application tests are scripted to run consecutively, and those results are automatically combined and compared against a baseline system. Popular applications like Microsoft Office, Adobe Photoshop and Mozilla Firefox are each used as they would be in real-world situations to comprise the final WorldBench score.
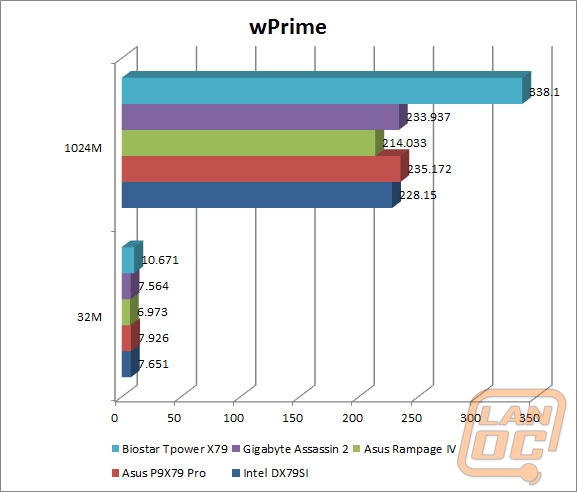
WPrime – Perfect for testing the multithreading of multiple core CPU’s. “wPrime uses a recursive call of Newton's method for estimating functions, with f(x)=x2-k, where k is the number we're sorting, until Sgn(f(x)/f'(x)) does not equal that of the previous iteration, starting with an estimation of k/2. It then uses an iterative calling of the estimation method a set amount of times to increase the accuracy of the results. It then confirms that n(k)2=k to ensure the calculation was correct. It repeats this for all numbers from 1 to the requested maximum.”
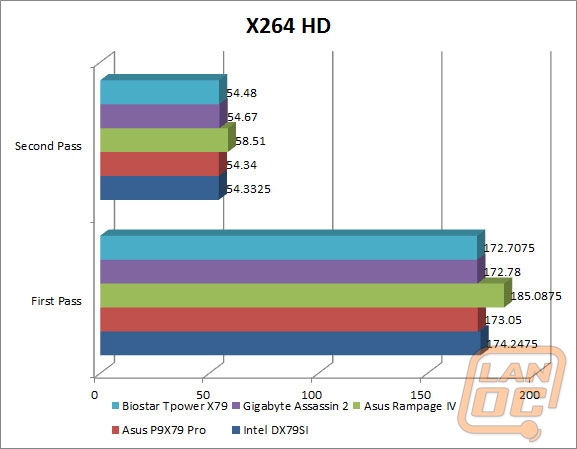
X264 HD – X264 HD is a CPU encoding benchmark. Using the x264 codec this test encodes a video file and times its performance.
Overall Synthetic Benchmarks
We run the entire collection of Futuremark’s PC and 3D benchmarks. Although they are synthetic, they do run consistent benchmarks on both in game performance and PC performance. Their new PCMark 7 does an amazing job of testing real world programs including web page loading speed and other activities nearly everyone does on their PC daily.
3DMark Vantage Performance
3DMark Vantage High
3DMark Vantage 2011 Performance
3DMark Vantage 2011 Extreme
In Game Tests
Call Of Duty Black Ops (1920x1080 – high settings, first scene starting after the cut scene, recorded using fraps)
Battlefield Bad Company 2 (1920x1080 – high settings, first scene starting after the cut scene, recorded using fraps)
Dirt 2 (1920x1080 – 4x MSAA – high settings, in-game benchmark)
Metro 2033 DX11 test (built-in benchmark, 1920 x 1080; DirectX: DirectX 11; Quality: Very High; Antialiasing: MSAA 4X; Texture filtering: AF 4X; Advanced PhysX: Enabled; Tessellation: Enabled; DOF: Disabled)
Metro 2033 DX10 test (built-in benchmark, 1920 x 1080; DirectX: DirectX 10; Quality: Very High; Antialiasing: MSAA 4X; Texture filtering: AF 4X; Advanced PhysX: Enabled; Tessellation: Enabled; DOF: Disabled)
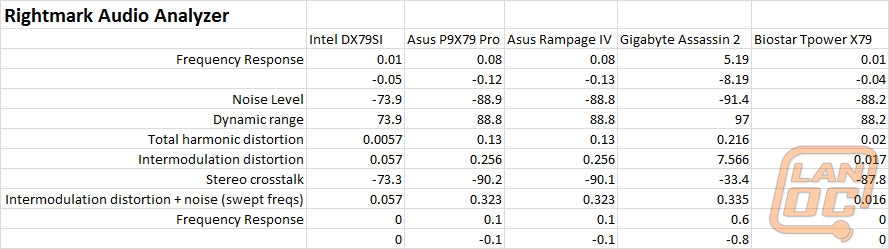
Audio Testing is done using Rightmark Audio Analyzer
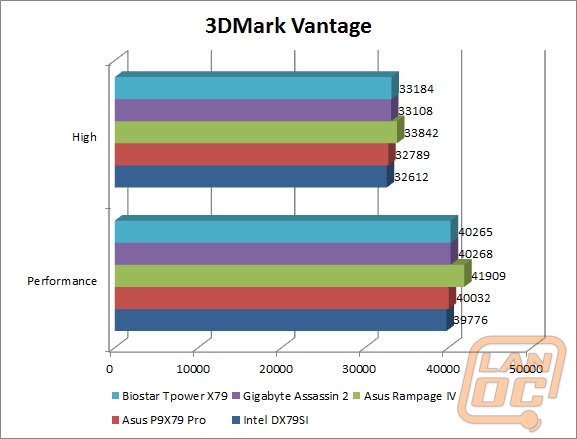
3DMark and PCMark
Due to an unrelated storage benchmark issue we excluded our PCMark results this time around as the storage issue skewed the results. Our 3DMark results on the other hand show the TPower X79 coming in right with our other X79 boards.
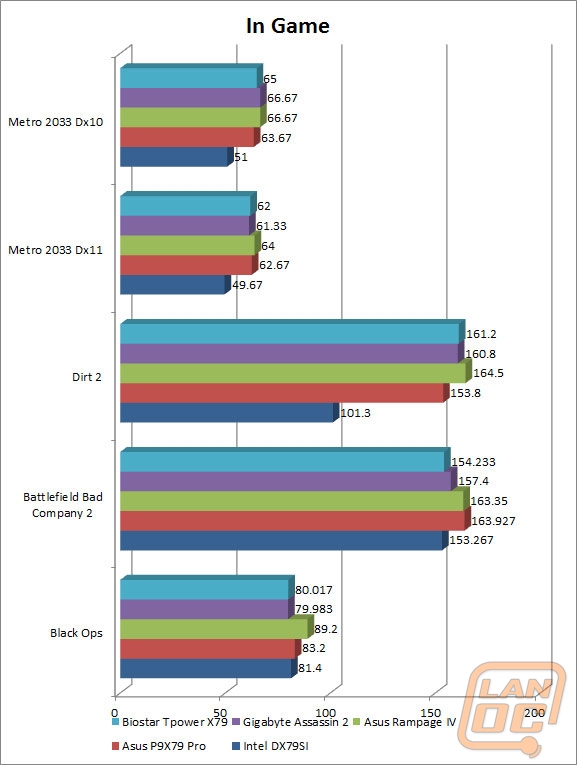
In Game
All of our in game benchmarks show fairly consistent results with the TPower X79, giving performance above what we saw with the Intel DX79SI and the Asus P9X79 Pro but below the other gaming focused boards did outperform slightly.
AIDA64
In the FPU Julia testing has both the Assassin 2 and the TPower X79 well above the others. Beyond that the only time you see much of a variance at all is with the CPU AES benchmark, with the Rampage 4 outperforming considerably.
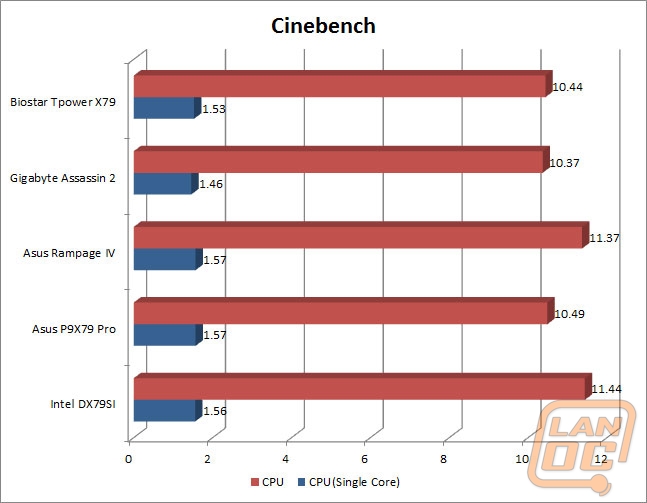
Cinebench
Our single core numbers in Cinebench show the TPower X79 coming up near the bottom, beating out the Assassin 2. The full CPU test shows similar results with the exception that the results are also very close to the Asus P9X79 Pro’s numbers.
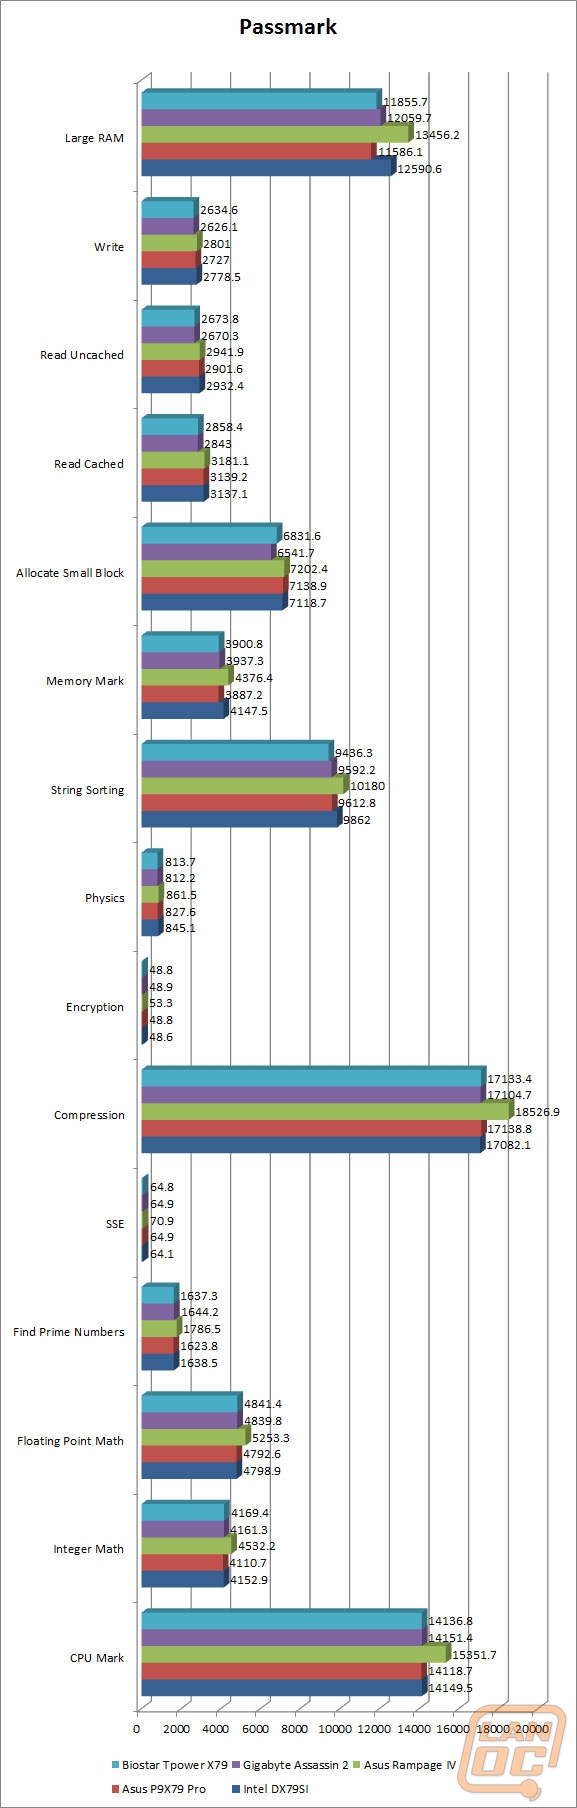
Passmark
Both CPU and Memory tests in Passmark have very similar results between all of the boards other than the Rampage 4.
Sandra
The TPower X79 performed right with the Assassin 2 and the Asus P9X79 Pro leaving the Intel board behind in most tests but still not besting the Rampage 4 in the arithmetic benchmarks.
X264 HD and wPrime
Our wPrime results were noticeably different than what we saw with all of the other boards, and not in a good way. These tests were repeated multiple times to double check the results, but each time the TPower X79 under performed in this test. The X264 HD results on the other hand are spot on with the TPower X79 performing right with every board other than the Rampage 4.
Worldbench
In Worldbench, a lower score is a better score. This puts the Tpower X79 in the middle across the board in all of our real world testing. The difference between all of the boards is slight, but the results are very consistently putting it in the middle.
Audio
Audio performance on the TPower X79 falls in between the Intel DX79SI and the Asus boards. The Asus boards outperformed in almost every metric, but the TPower X79 still looks good when considering the Intel and Gigabyte boards’ performance.
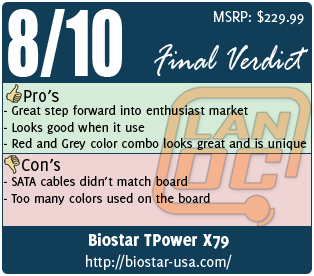
Overall and FV
After spending time with the TPower X79 I am really happy with their first real effort to get into the enthusiast market. It’s obvious they are taking into account what gamers and enthusiasts what in their boards. That’s not to say it was perfect. I didn’t like the use of so many colors with both the board itself and also the SATA cables. I would like to see them lock it down to two colors and run with it. The red and grey they selected for the cooling looks amazing and is unique, this would be a good one to go with. The UEFI bios is always a nice touch also. I would keep an eye out on Biostar; I expect to see them making even more amazing boards. They are no longer just the budget manufacture of the past.